Principles of Economics: Equilibrium and CPI
VerifiedAdded on 2019/12/03
|9
|2432
|310
Report
AI Summary
This report delves into the fundamental principles of economics, focusing on the impact of increased customers on market equilibrium and the calculation of the Consumer Price Index (CPI) in the UK. It explains how changes in demand and supply affect equilibrium price and quantity, using examples like milk and cornflakes to illustrate the concepts. The report also details how the CPI is calculated in the UK, highlighting its role in measuring inflation and its impact on the cost of living. The conclusion summarizes the key findings, emphasizing the relationship between supply, demand, and equilibrium, as well as the importance of the CPI in understanding the UK's economic condition.
Principles of
economics
economics
Paraphrase This Document
Need a fresh take? Get an instant paraphrase of this document with our AI Paraphraser
TABLE OF CONTENTS
Introduction......................................................................................................................................3
A: Impact of increase In customers on equilibrium price and quantity of product ........................3
Impact of increase in customers on Equilibrium price and quantity...........................................3
B. HOW CONSUMER PRICE INDEX MEASURE OF INFLATION IS CALCULATED IN
UK....................................................................................................................................................6
Conclusion.......................................................................................................................................7
References........................................................................................................................................8
2
INTRODUCTION
Economics can be described as field of science that provide description of factors which
affects production, consumption and distribution of goods and services. Present study is based on
the evaluation of basic principles of economics (Bold and Vega, 2003.). In this report,
description will be provided regarding, impact of increase in consumers will be described on the
equilibrium price and quantity of product. Further, computation of Consumer Prices Index
measure of inflation will be provided.
A: IMPACT OF INCREASE IN CUSTOMERS ON EQUILIBRIUM PRICE
AND QUANTITY OF PRODUCT
Equilibrium can be defined as point of price at which supply and demand of quantity of
product is equal. At the point of equilibrium, there is no change in the price of product because
quantity supplied to the customers is equivalent to quantity provided by the customers (Brooks,
2002). With the change in economic factors there is also change in the point of equilibrium. It is
because; there is direct change in supply and demand point. This aspect can be noticed by the
following table:
Table 1: Changes in equilibrium prices due to demand curve
Shift in demand curve Impact on demand Impact on equilibrium point
To the right Increase in demand Equilibrium point will be
increased
To the left Decrease in demand Equilibrium point will be
decreased
Table 2: Changes in equilibrium prices due to supply curve
Shift in supply curve Impact on supply Impact on equilibrium point
To the right Increase in supply Equilibrium point will be
decreased
To the left Decrease in supply Equilibrium point will be
increased
Impact of increase in customers on Equilibrium price and quantity
In terms of economics, demand refers to the quantity of product or service desired by the
buyers. Quantity demanded is the amount of product at which customers are willing to buy by
3
⊘ This is a preview!⊘
Do you want full access?
Subscribe today to unlock all pages.
Trusted by 1+ million students worldwide
giving certain price (Caravle, 2002). Relationship between price and quantity is known as
demand relationship. Increase in customers is direct in relationship with the quantity of products.
By considering this fact, with the increase in customers there will also be increase in the quantity
of product. For example, if a new phone is launched by company than number of customers of
phone will be increased.
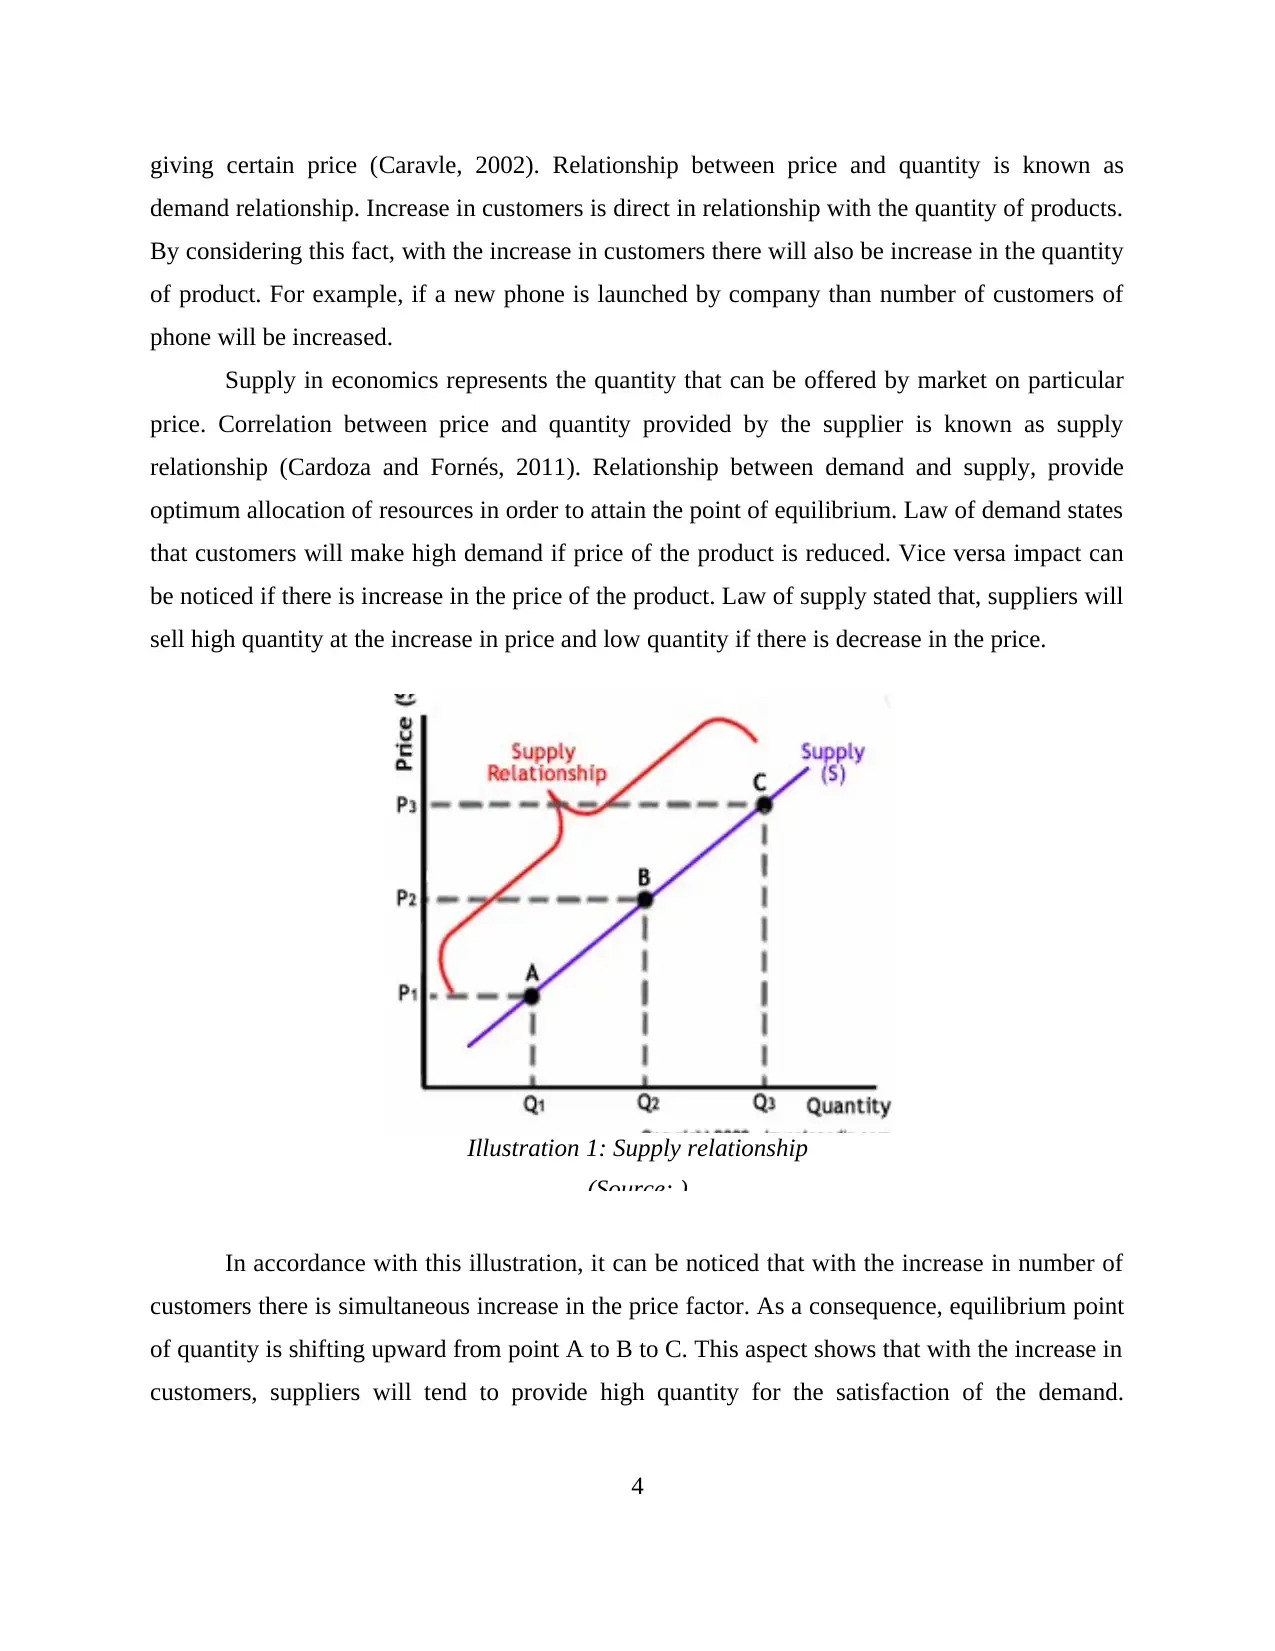
Supply in economics represents the quantity that can be offered by market on particular
price. Correlation between price and quantity provided by the supplier is known as supply
relationship (Cardoza and Fornés, 2011). Relationship between demand and supply, provide
optimum allocation of resources in order to attain the point of equilibrium. Law of demand states
that customers will make high demand if price of the product is reduced. Vice versa impact can
be noticed if there is increase in the price of the product. Law of supply stated that, suppliers will
sell high quantity at the increase in price and low quantity if there is decrease in the price.
In accordance with this illustration, it can be noticed that with the increase in number of
customers there is simultaneous increase in the price factor. As a consequence, equilibrium point
of quantity is shifting upward from point A to B to C. This aspect shows that with the increase in
customers, suppliers will tend to provide high quantity for the satisfaction of the demand.
4
Illustration 1: Supply relationship
(Source: )
demand relationship. Increase in customers is direct in relationship with the quantity of products.
By considering this fact, with the increase in customers there will also be increase in the quantity
of product. For example, if a new phone is launched by company than number of customers of
phone will be increased.
Supply in economics represents the quantity that can be offered by market on particular
price. Correlation between price and quantity provided by the supplier is known as supply
relationship (Cardoza and Fornés, 2011). Relationship between demand and supply, provide
optimum allocation of resources in order to attain the point of equilibrium. Law of demand states
that customers will make high demand if price of the product is reduced. Vice versa impact can
be noticed if there is increase in the price of the product. Law of supply stated that, suppliers will
sell high quantity at the increase in price and low quantity if there is decrease in the price.
In accordance with this illustration, it can be noticed that with the increase in number of
customers there is simultaneous increase in the price factor. As a consequence, equilibrium point
of quantity is shifting upward from point A to B to C. This aspect shows that with the increase in
customers, suppliers will tend to provide high quantity for the satisfaction of the demand.
4
Illustration 1: Supply relationship
(Source: )
Paraphrase This Document
Need a fresh take? Get an instant paraphrase of this document with our AI Paraphraser
However, to attain the point of equilibrium price of product will also be increased (Ceccherini-
Nelli and Priebe, 2007).
With the increase in customers, there will be increase in demand and consequently
equilibrium point will be increased. For example, at present there are 30 customers of the
product then 3 quantity is demanded in the market. Now, if number of customers is increased up
to 40 then demand of the product will also be increased. In this situation supplier will provide
product at the higher price in order to mitigate the demand. Due to this aspect equilibrium in
price will be achieved at the higher point.
This discussion can be explained with the help of an example by taking products who are
substitutes to each other. Milk and cornflakes both have direct relationship to each other as when
price of milk increases, demand diminishes and this ultimately reduces the supply of milk.
On the other hand, when price of the milk reduces, its demand increases and that further
enhances supply ratio. Relating it to cornflakes, the demand of cornflakes increases at the time
when price of milk is declined and people will purchase the same product in higher quantity.
Thus, it reflects that when price declines, level of quantity demanded increases of primary and
substitute both the products.
The quantity demanded by cornflakes is directly associated with milk as both have direct
relationship with each other. People will consume cornflakes more if the price will decrease and
this ultimately will augment the demand and quantity supply of milk because cornflakes most of
the time is consumed with milk only. If price of milk will fall down, then it will augment also
augment the demand for cornflakes.
In the particular situation, demand and supply for both the products will come to
equilibrium state when declined price of milk will increase the demand of cornflakes. Hence, it
can be said that price and quantity demanded both are inversely related to each other. Demand
and price of milk have a great impact on quantity demanded of cornflakes.
5
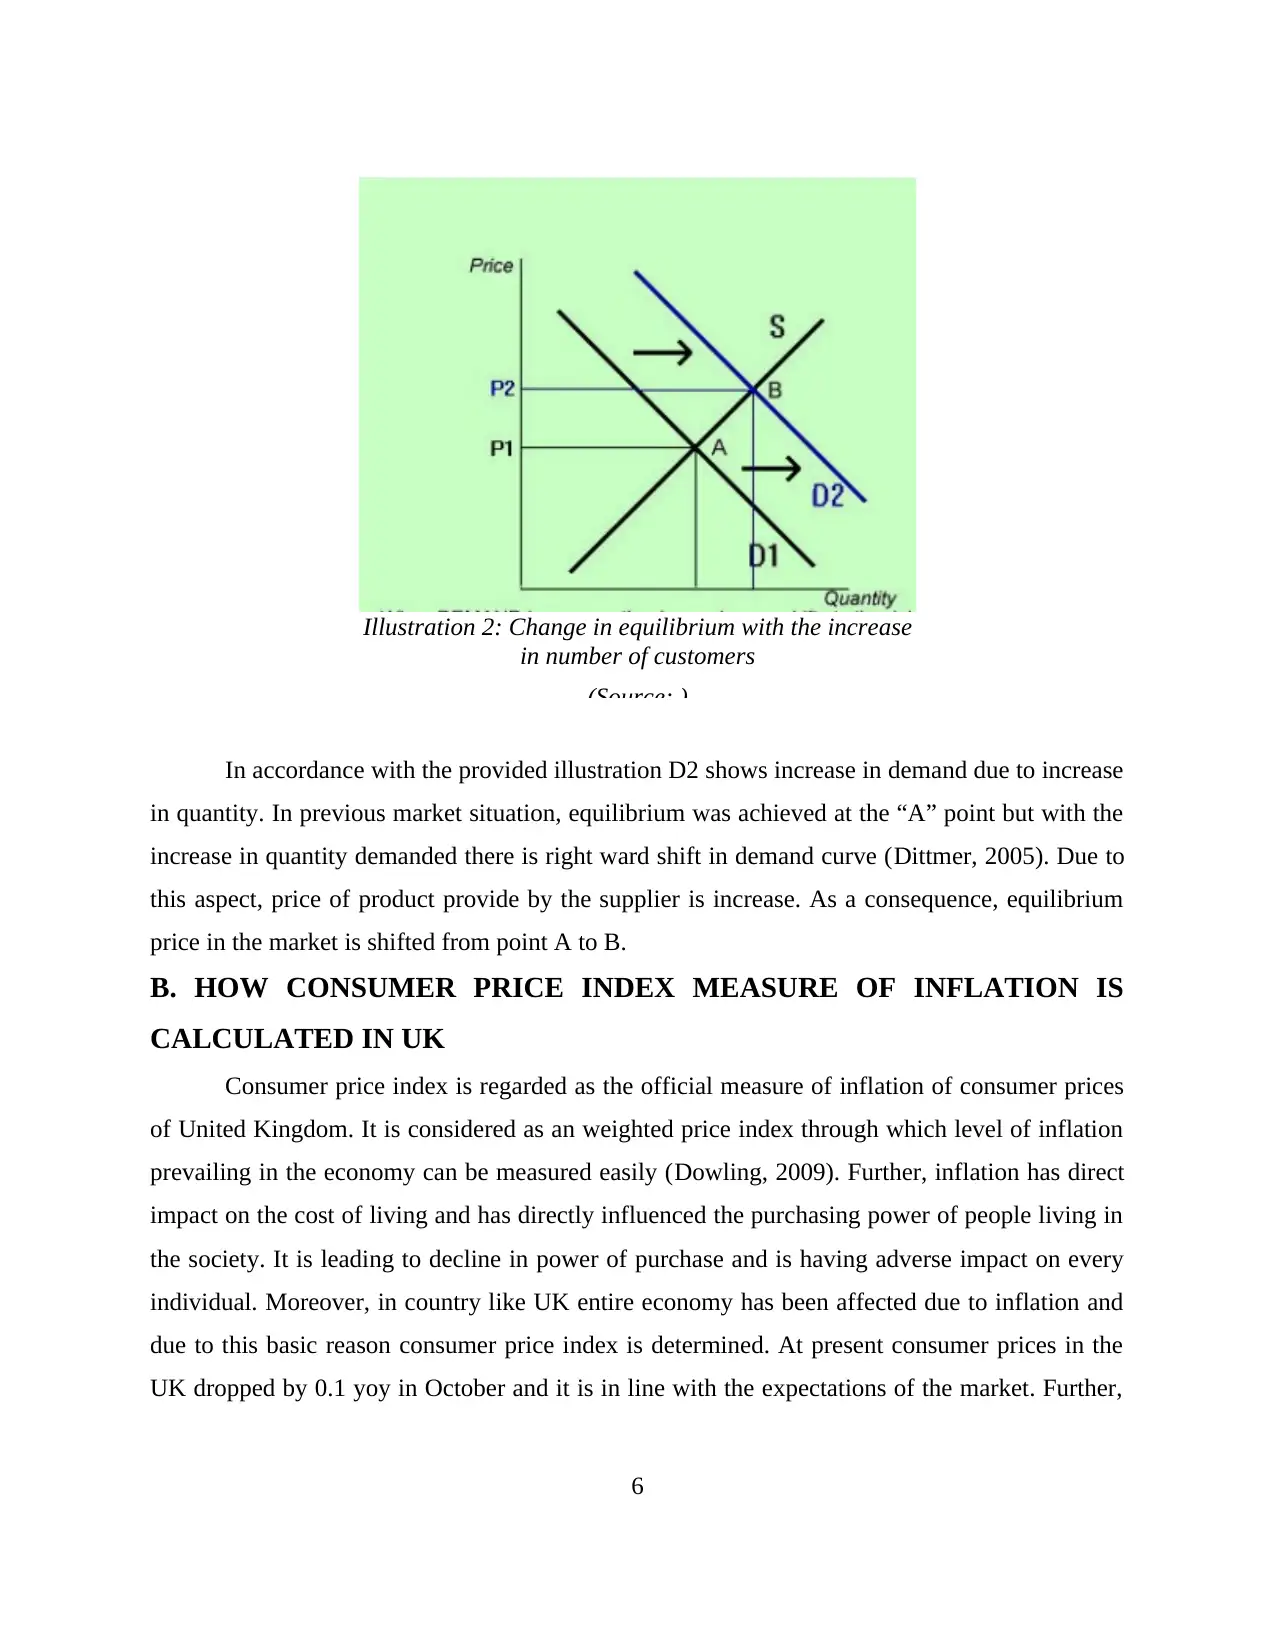
In accordance with the provided illustration D2 shows increase in demand due to increase
in quantity. In previous market situation, equilibrium was achieved at the “A” point but with the
increase in quantity demanded there is right ward shift in demand curve (Dittmer, 2005). Due to
this aspect, price of product provide by the supplier is increase. As a consequence, equilibrium
price in the market is shifted from point A to B.
B. HOW CONSUMER PRICE INDEX MEASURE OF INFLATION IS
CALCULATED IN UK
Consumer price index is regarded as the official measure of inflation of consumer prices
of United Kingdom. It is considered as an weighted price index through which level of inflation
prevailing in the economy can be measured easily (Dowling, 2009). Further, inflation has direct
impact on the cost of living and has directly influenced the purchasing power of people living in
the society. It is leading to decline in power of purchase and is having adverse impact on every
individual. Moreover, in country like UK entire economy has been affected due to inflation and
due to this basic reason consumer price index is determined. At present consumer prices in the
UK dropped by 0.1 yoy in October and it is in line with the expectations of the market. Further,
6
Illustration 2: Change in equilibrium with the increase
in number of customers
(Source: )
⊘ This is a preview!⊘
Do you want full access?
Subscribe today to unlock all pages.
Trusted by 1+ million students worldwide
in the first time consumer price index has fallen for two months as cost of food reduced and
overall oil prices keep dragging transport cost down (Dutta, 2006). Average rate of inflation in
the country like United Kingdom is 2.67 percent from the year 1989 until 2015. Further, the key
categories in the consumer price index are transport with share of 16.2%, water, electricity, gas
and fuels. Further, culture accounts for 11.2% and index also takes into consideration clothing
and footwear, miscellaneous goods and services, household equipment and maintenance etc
(How is the Consumer Prices Index calculated. 2013).
For calculation of consumer price index individual price charges of goods and services
for a particular month are compared to levels for the previous year. Further, after this stage
weights are assigned from current year to produce overall average price change (How is Inflation
Calculated. 2010). In the last stage average price changes are linked with the figures for earlier
years. Therefore, by following all these steps it is possible to calculate consumer price index.
Moreover, the inflation supports in measuring the change in price between two point in a time
and it is generally for the last year but the change in any period of time can be calculated easily.
Through consumer price index it is possible to calculate price changes rather than price levels.
Therefore, in this way by calculating consumer price index it is possible to know level of
inflation (Inflation Measuring Inflation 2015).
Retail Price Index measure of inflation in UK is the adequate way of evaluating the
extent to which workers are affected by the changes held in the First World War (). In order to
manage inflation rate, the cost of living needs to be considered on the basis of general price
level. Thus, the rate of inflation can be measured by the annual percentage according to which
changes occur in consumer prices. It has been observed that the British government has
determined an inflation target rate of 2% afterwards using the consumer price index. Further, in
the context of UK, Bank of England is entitled to determine interest rates for the purpose of
controlling aggregate demand in the economy (Inflation: How Is It Measured, 2015). Further,
inflation pressures are subdued and on that aspects inflation target can be adequately managed.
The Bank of England is independent entity according to the government since it controls
interest rates and the major reason is also that no political intervention are present in this
scenario. The Bank is considered as the adequate measure through which price deflation can be
managed. Further, for the purpose of calculating the cost of living of consumers, average price
7
Paraphrase This Document
Need a fresh take? Get an instant paraphrase of this document with our AI Paraphraser
needs to be calculated according to the buying ability of the consumers. RPI further includes cost
of housing and CPI does not include such things because the major emphasis here is given on
buying behaviour of the consumers (UK inflation rate turns negative again, 2015). RPI is
considered as an arithmetic means because prices of everything can not be included in it and it
can be simply added in the list merely by dividing the number of items. Therefore, CPI is also
called a geometric mean and it is further calculated by multiplying the prices of all the items
together, then afterwards it requires to take the nth root of all the calculated items.
CONCLUSION
In accordance with the present study it can be concluded that, equilibrium in the market is
directly affected by the supply and demand factors. With the change in these curves, equilibrium
point will also be altered. Increase in customers will make increase in demand and consequently
supply will be increased. Due to this aspect, point of equilibrium will be attained at higher price.
Further, calculation of consumer price index assists in knowing the level of inflation and through
this economic condition of UK can be known easily which is fruitful for the entire nation.
Moreover, this index only assist in calculating the prices changes and does not considers price
level.
8
REFERENCES
Books and journals
Bold, F.X. and Vega, C., 2003. Micro E ects of Macro Announcements: Real-Time Priceff
Discovery in Foreign Exchange. American Economic Review. 93. pp. 38–62.
Brooks, C, 2002. Introductory Econometrics for Finance. Cambridge University Press.
Cambridge. United Kingdom.
Caravle, G., 2002. Equilibrium and Economic Theory. Routledge
Cardoza, G. and Fornés, G., 2011. International co-operation of Ibero-American countries in
business administration and economics research: Presence in high-impact journals.
European Business Review. 23(1). pp.7-22.
Ceccherini-Nelli, A. and Priebe, S., 2007. Economic factors – an analysis of historical trends.
International Journal of Social Economics. 34(11). pp.788 – 810
Dittmer, T., 2005. Diminishing Marginal Utility in Economics Textbooks. The Journal of
Economic Education. 36(4). pp. 391-399
Dowling, E., 2009. Schaum's Outline of Mathematical Methods for Business and Economics.
McGraw Hill Professional.
Dutta, S., 2006. Introductory Economics (Micro and Macro): A Textbook for Class XII. New Age
International.
Online
How is Inflation Calculated. 2010. [Online]. Available through
<http://www.economicshelp.org/blog/54/inflation/how-is-inflation-calculated/>. [Accessed
on 5th December 2015].
How is the Consumer Prices Index calculated. 2013. [Online]. Available through
<http://www.ons.gov.uk/ons/infographics/how-cpi-is-calculated/index.html>. [Accessed
on 5th December 2015].
Inflation Measuring Inflation. 2015. [Online]. Available through
<https://www.unison.org.uk/content/uploads/2014/11/TowebFull-report-Consumer-Price-
indices-in-the-UK2.pdf>. [Accessed on 5th December 2015].
Inflation: How Is It Measured. 2015. [Online]. Available through
<http://www.economicshelp.org/blog/54/inflation/how-is-inflation-calculated/>. [Accessed
on 5th December 2015].
UK inflation rate turns negative again. 2015. [Online]. Available through
<http://www.bbc.com/news/business-34514135>. [Accessed on 5th December 2015].
9
⊘ This is a preview!⊘
Do you want full access?
Subscribe today to unlock all pages.
Trusted by 1+ million students worldwide
1 out of 9
Related Documents


Your All-in-One AI-Powered Toolkit for Academic Success.
+13062052269
info@desklib.com
Available 24*7 on WhatsApp / Email
![[object Object]](/_next/static/media/star-bottom.7253800d.svg)
Unlock your academic potential
Copyright © 2020–2026 A2Z Services. All Rights Reserved. Developed and managed by ZUCOL.