ECOM4000 Economics Individual Assignment: Australian Economy Analysis

Verified

Added on  2023/03/29

|10
|1404
|234
Homework Assignment
AI Summary
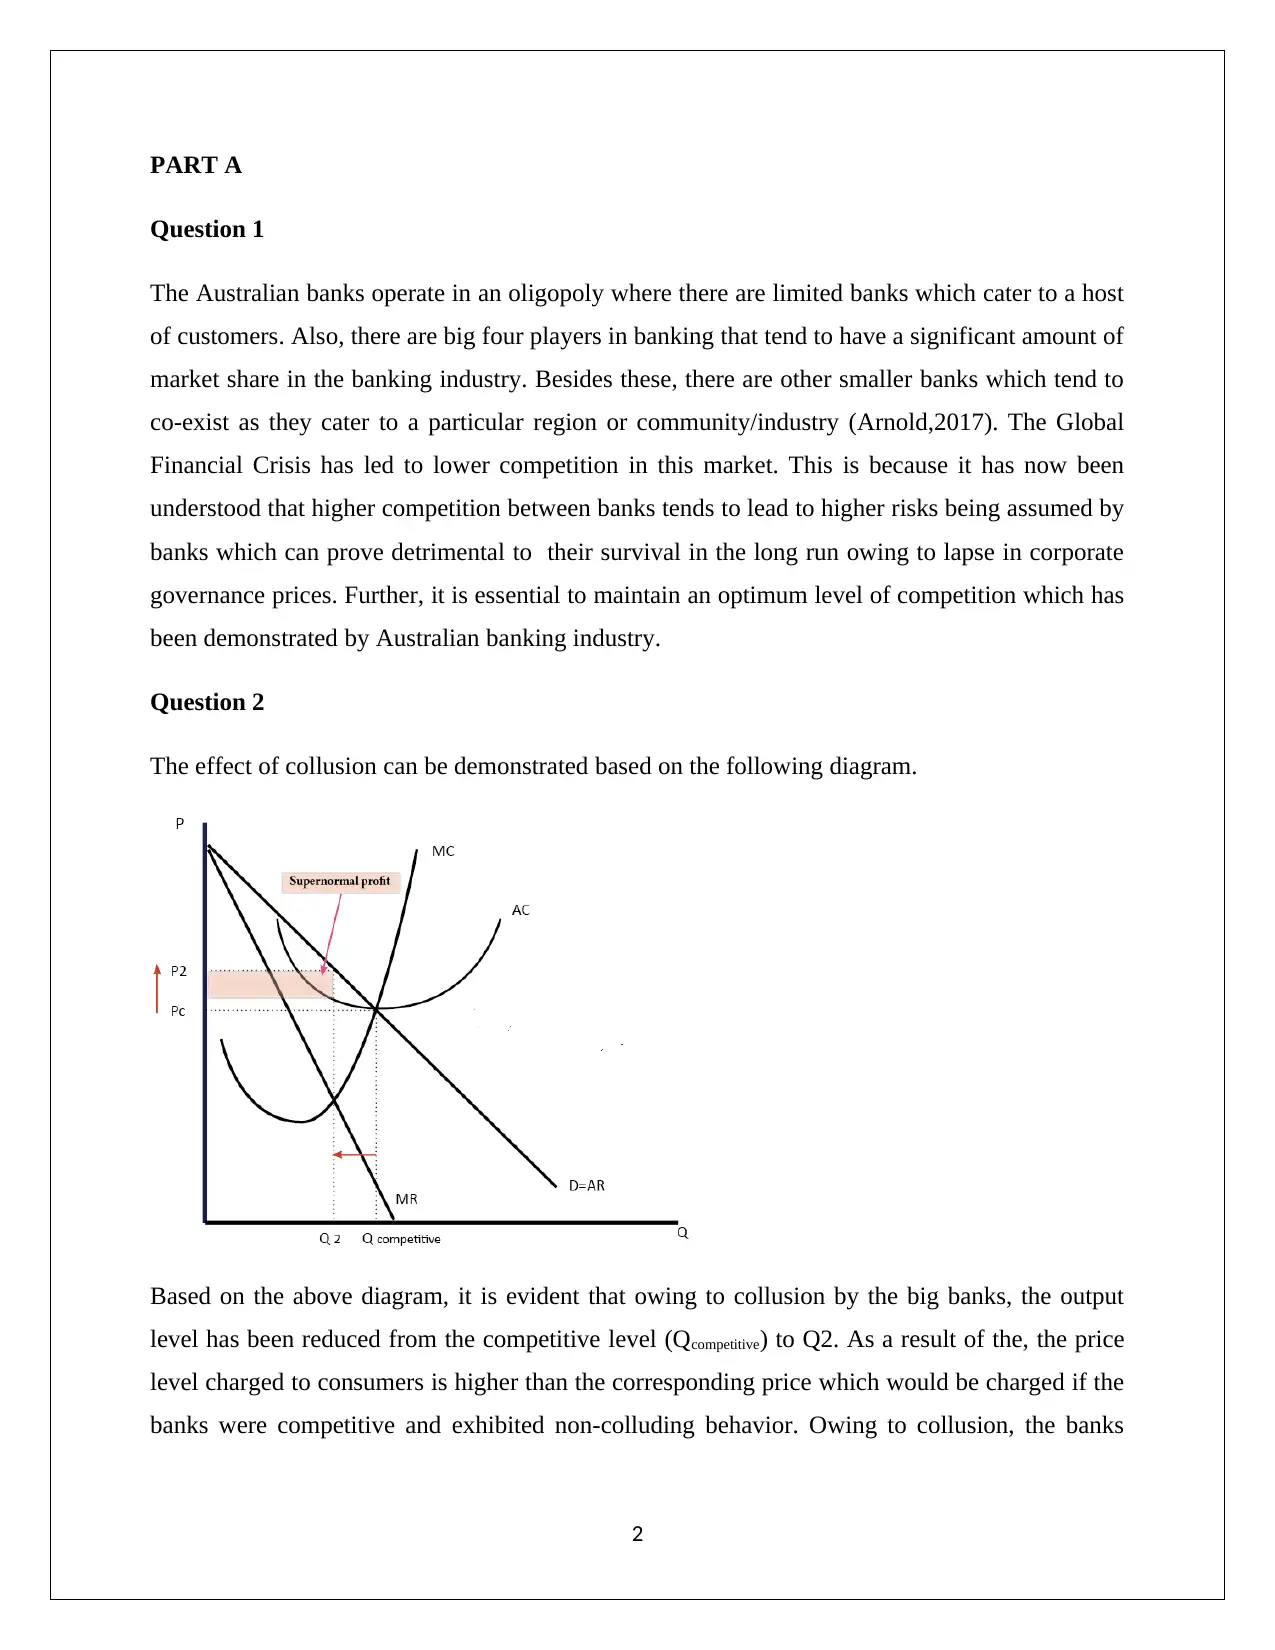
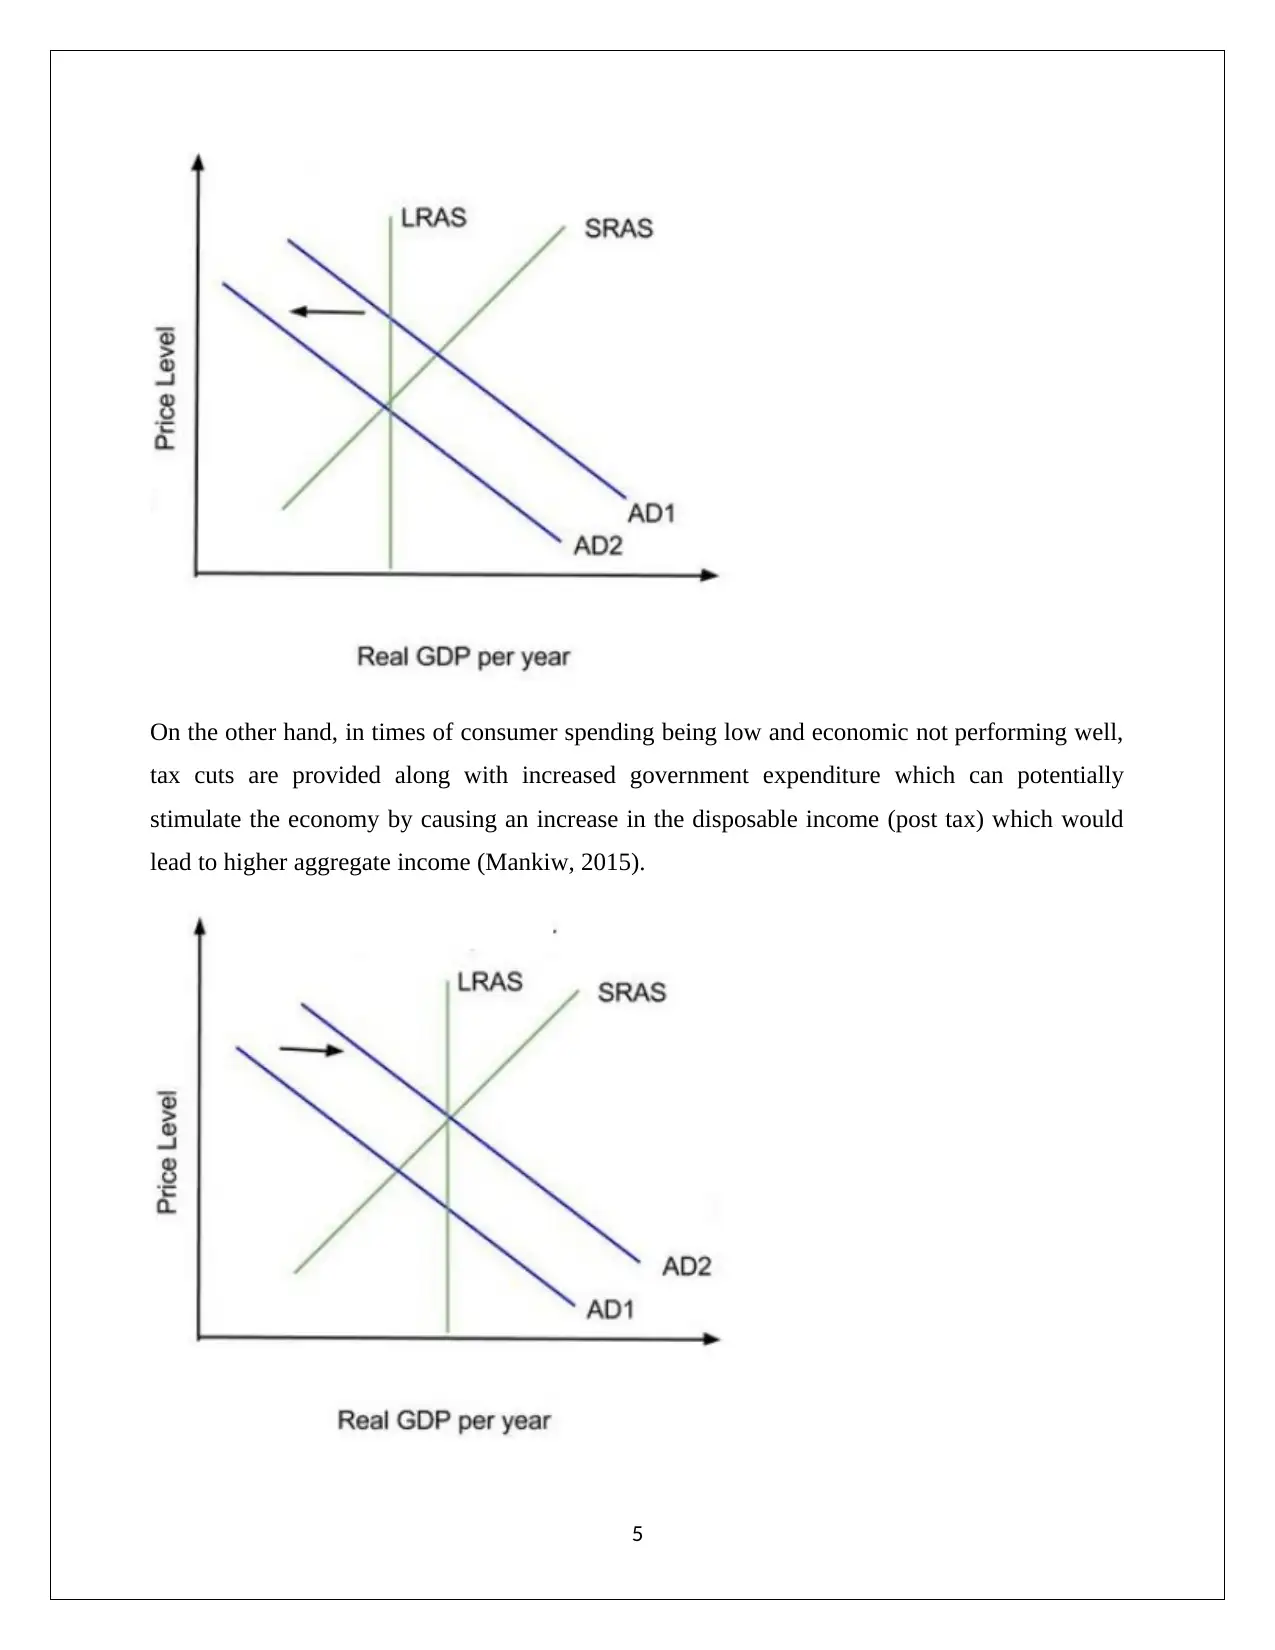
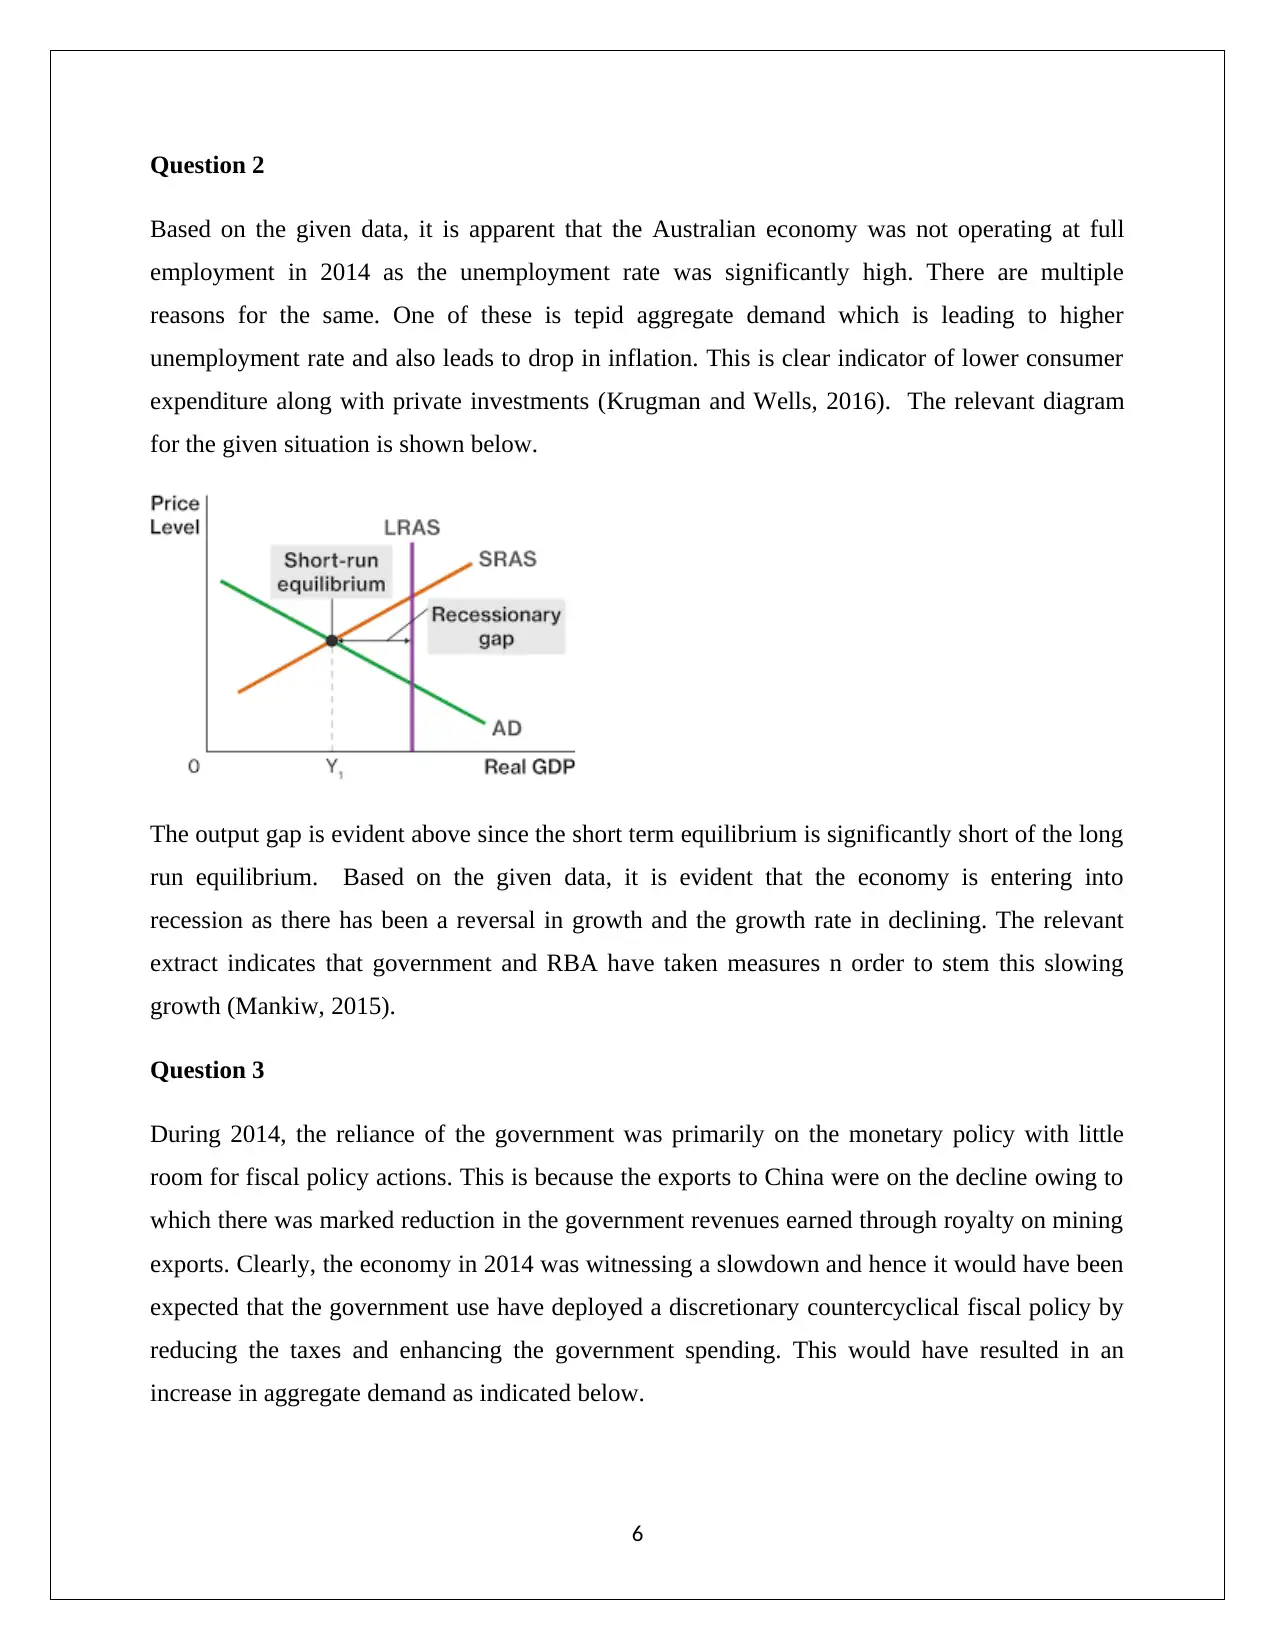
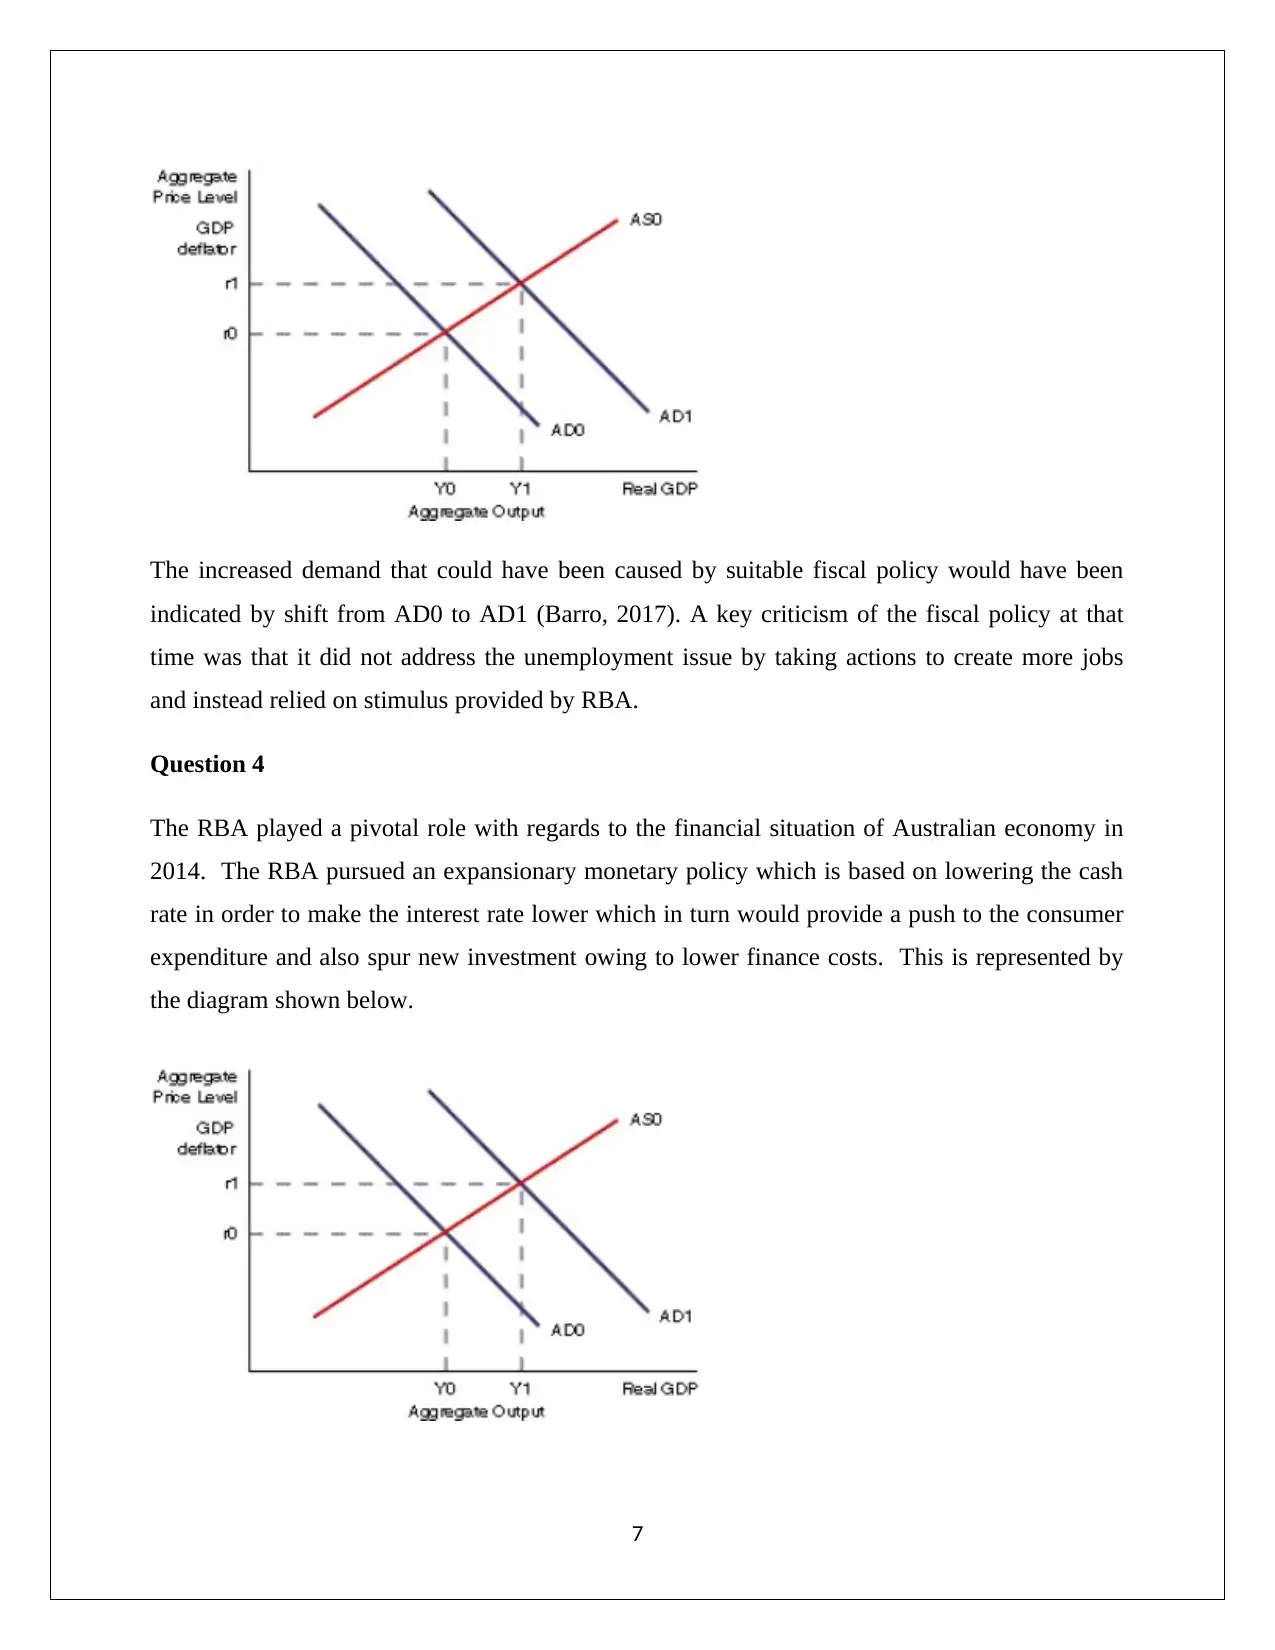
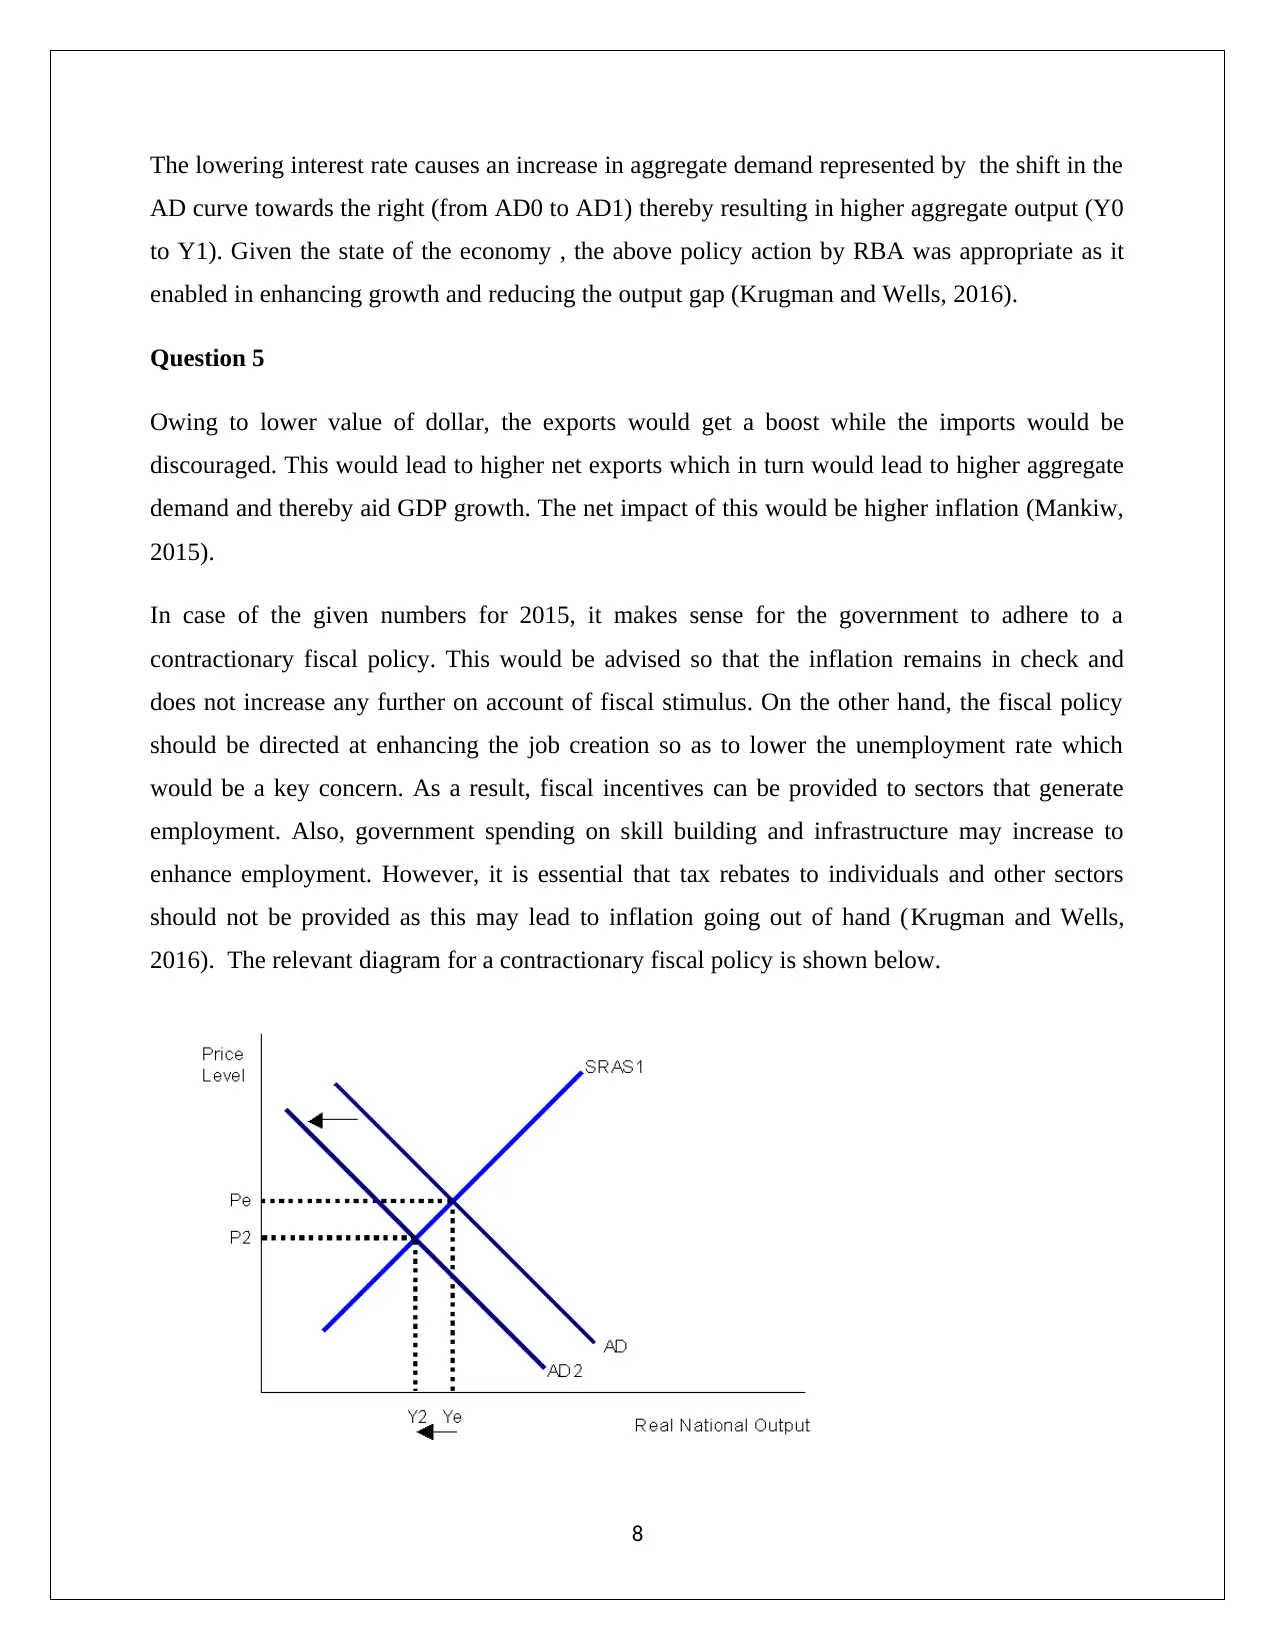
This economics assignment solution analyzes the Australian banking industry, highlighting its oligopolistic structure and the impact of collusion on output and pricing. It explores discretionary fiscal policy, examining its application during economic booms and downturns, with diagrams illustrating the effects of tax changes and government spending. The solution then assesses the Australian economy in 2014, discussing factors contributing to unemployment and the role of the Reserve Bank of Australia (RBA) in implementing monetary policy to stimulate growth. The assignment further evaluates the impact of currency devaluation on exports and imports and recommends appropriate fiscal policies to manage inflation and unemployment in 2015, including the use of contractionary measures and employment-focused initiatives.
Document Page
ECONOMICS
STUDENT ID:
[Pick the date]
tabler-icon-diamond-filled.svg

Paraphrase This Document

Need a fresh take? Get an instant paraphrase of this document with our AI Paraphraser
Document Page
PART A
Question 1
The Australian banks operate in an oligopoly where there are limited banks which cater to a host
of customers. Also, there are big four players in banking that tend to have a significant amount of
market share in the banking industry. Besides these, there are other smaller banks which tend to
co-exist as they cater to a particular region or community/industry (Arnold,2017). The Global
Financial Crisis has led to lower competition in this market. This is because it has now been
understood that higher competition between banks tends to lead to higher risks being assumed by
banks which can prove detrimental to their survival in the long run owing to lapse in corporate
governance prices. Further, it is essential to maintain an optimum level of competition which has
been demonstrated by Australian banking industry.
Question 2
The effect of collusion can be demonstrated based on the following diagram.
Based on the above diagram, it is evident that owing to collusion by the big banks, the output
level has been reduced from the competitive level (Qcompetitive) to Q2. As a result of the, the price
level charged to consumers is higher than the corresponding price which would be charged if the
banks were competitive and exhibited non-colluding behavior. Owing to collusion, the banks
2
Document Page
would be able to earn super normal profits as indicated through the highlighted region (Mankiw ,
Mankiw and Taylor, 2016).
Question 3
The regulators are trying to increase competition so as to ensure that the services provided to
customers are provided at reasonable cost and also the quality standards are maintained. The
effect of decreased competition in the banking industry can be exhibited with the use of the
previous graph where it is evident that higher competition would lead to higher output and lower
prices for the consumers. On the other hand reduced competition would lead to falling output
(standards of service) along with rising price for the various banking services. In order to
enhance the competition, the regulators are making efforts to ensure that collusion does not occur
amongst players and also by ensuring that minimum quality standards are met. Further, various
platforms are being provided in order to address various complaints that customers may have
against the banks especially with regards to over-charging and abuse of their market power
(Nicholson and Snyder, 2015).
Question 4
With regards to entry in the competitive market, the key factor is existence of supernormal
profits which would lure the new entrants. However, as new players would keep entering the
market, the supply of services would keep on increasing. On account of higher supply, there
would be higher competition and downward pressure on prices. Finally, more than requisite
entry of new entrants would lead to situation when equilibrium price would dip below the cost
price thereby leading to losses which would to discourage the entry of new players and perhaps
lead to shutdown of some existing players so as to create a balance between demand and supply
(Arnold, 2017) . The relevant diagram is shown below.
3
Document Page
The above graph highlights the equilibrium situation where new entrants would have
indifference towards entry and existing players towards exit (Nicholson and Snyder, 2015).
PART B
Question 1
Discretionary fiscal policy is the change in fiscal policy which is not driven by pre-determined
rules but by the will of the policymakers. This policy can be countercyclical as in times of boom,
the tax rates can be made higher while government expenditure may be brought down so as to
restrain spending by the customers and ensure that there is no overheating of the economy
(Barro,2017). This is exhibited below.
4
tabler-icon-diamond-filled.svg

Paraphrase This Document

Need a fresh take? Get an instant paraphrase of this document with our AI Paraphraser
Document Page
On the other hand, in times of consumer spending being low and economic not performing well,
tax cuts are provided along with increased government expenditure which can potentially
stimulate the economy by causing an increase in the disposable income (post tax) which would
lead to higher aggregate income (Mankiw, 2015).
5
Document Page
Question 2
Based on the given data, it is apparent that the Australian economy was not operating at full
employment in 2014 as the unemployment rate was significantly high. There are multiple
reasons for the same. One of these is tepid aggregate demand which is leading to higher
unemployment rate and also leads to drop in inflation. This is clear indicator of lower consumer
expenditure along with private investments (Krugman and Wells, 2016). The relevant diagram
for the given situation is shown below.
The output gap is evident above since the short term equilibrium is significantly short of the long
run equilibrium. Based on the given data, it is evident that the economy is entering into
recession as there has been a reversal in growth and the growth rate in declining. The relevant
extract indicates that government and RBA have taken measures n order to stem this slowing
growth (Mankiw, 2015).
Question 3
During 2014, the reliance of the government was primarily on the monetary policy with little
room for fiscal policy actions. This is because the exports to China were on the decline owing to
which there was marked reduction in the government revenues earned through royalty on mining
exports. Clearly, the economy in 2014 was witnessing a slowdown and hence it would have been
expected that the government use have deployed a discretionary countercyclical fiscal policy by
reducing the taxes and enhancing the government spending. This would have resulted in an
increase in aggregate demand as indicated below.
6
Document Page
The increased demand that could have been caused by suitable fiscal policy would have been
indicated by shift from AD0 to AD1 (Barro, 2017). A key criticism of the fiscal policy at that
time was that it did not address the unemployment issue by taking actions to create more jobs
and instead relied on stimulus provided by RBA.
Question 4
The RBA played a pivotal role with regards to the financial situation of Australian economy in
2014. The RBA pursued an expansionary monetary policy which is based on lowering the cash
rate in order to make the interest rate lower which in turn would provide a push to the consumer
expenditure and also spur new investment owing to lower finance costs. This is represented by
the diagram shown below.
7
tabler-icon-diamond-filled.svg

Paraphrase This Document

Need a fresh take? Get an instant paraphrase of this document with our AI Paraphraser
Document Page
The lowering interest rate causes an increase in aggregate demand represented by the shift in the
AD curve towards the right (from AD0 to AD1) thereby resulting in higher aggregate output (Y0
to Y1). Given the state of the economy , the above policy action by RBA was appropriate as it
enabled in enhancing growth and reducing the output gap (Krugman and Wells, 2016).
Question 5
Owing to lower value of dollar, the exports would get a boost while the imports would be
discouraged. This would lead to higher net exports which in turn would lead to higher aggregate
demand and thereby aid GDP growth. The net impact of this would be higher inflation (Mankiw,
2015).
In case of the given numbers for 2015, it makes sense for the government to adhere to a
contractionary fiscal policy. This would be advised so that the inflation remains in check and
does not increase any further on account of fiscal stimulus. On the other hand, the fiscal policy
should be directed at enhancing the job creation so as to lower the unemployment rate which
would be a key concern. As a result, fiscal incentives can be provided to sectors that generate
employment. Also, government spending on skill building and infrastructure may increase to
enhance employment. However, it is essential that tax rebates to individuals and other sectors
should not be provided as this may lead to inflation going out of hand (Krugman and Wells,
2016). The relevant diagram for a contractionary fiscal policy is shown below.
8
Document Page
It is evident that the prices are decreasing which would help in ensuring inflation remains under
check. However, initiatives for enhancing employment must be undertaken by the government.
9
Document Page
References
Arnold, A.R. (2017) Microeconomics. 9th edn. Sydney: Cengage Learning.
Barro, R. (2017) Macroeconomics: A Modern Approach. 4th edn. London: Cengage Learning
Krugman, P. and Wells, R. (2016) Macroeconomics.3rd edn. London: Worth Publishers.
Mankiw, G. (2015) Principles of Macroeconomics.6th edn. London: Cengage Learning.
Mankiw, G.N., Mankiw, G.N. and Taylor, P. (2016) Microeconomics. 5th edn. Sydney: Cengage
Learning.
Nicholson, W. and Snyder, C. (2015) Fundamentals of Microeconomics.11th edn. New York:
Cengage Learning.
10
chevron_up_icon
1 out of 10
circle_padding
hide_on_mobile
zoom_out_icon
[object Object]