Economics for Manager: NPV, Elasticities, and Forecasting Report

Verified

Added on  2022/08/12

|14
|1344
|95
Report
AI Summary
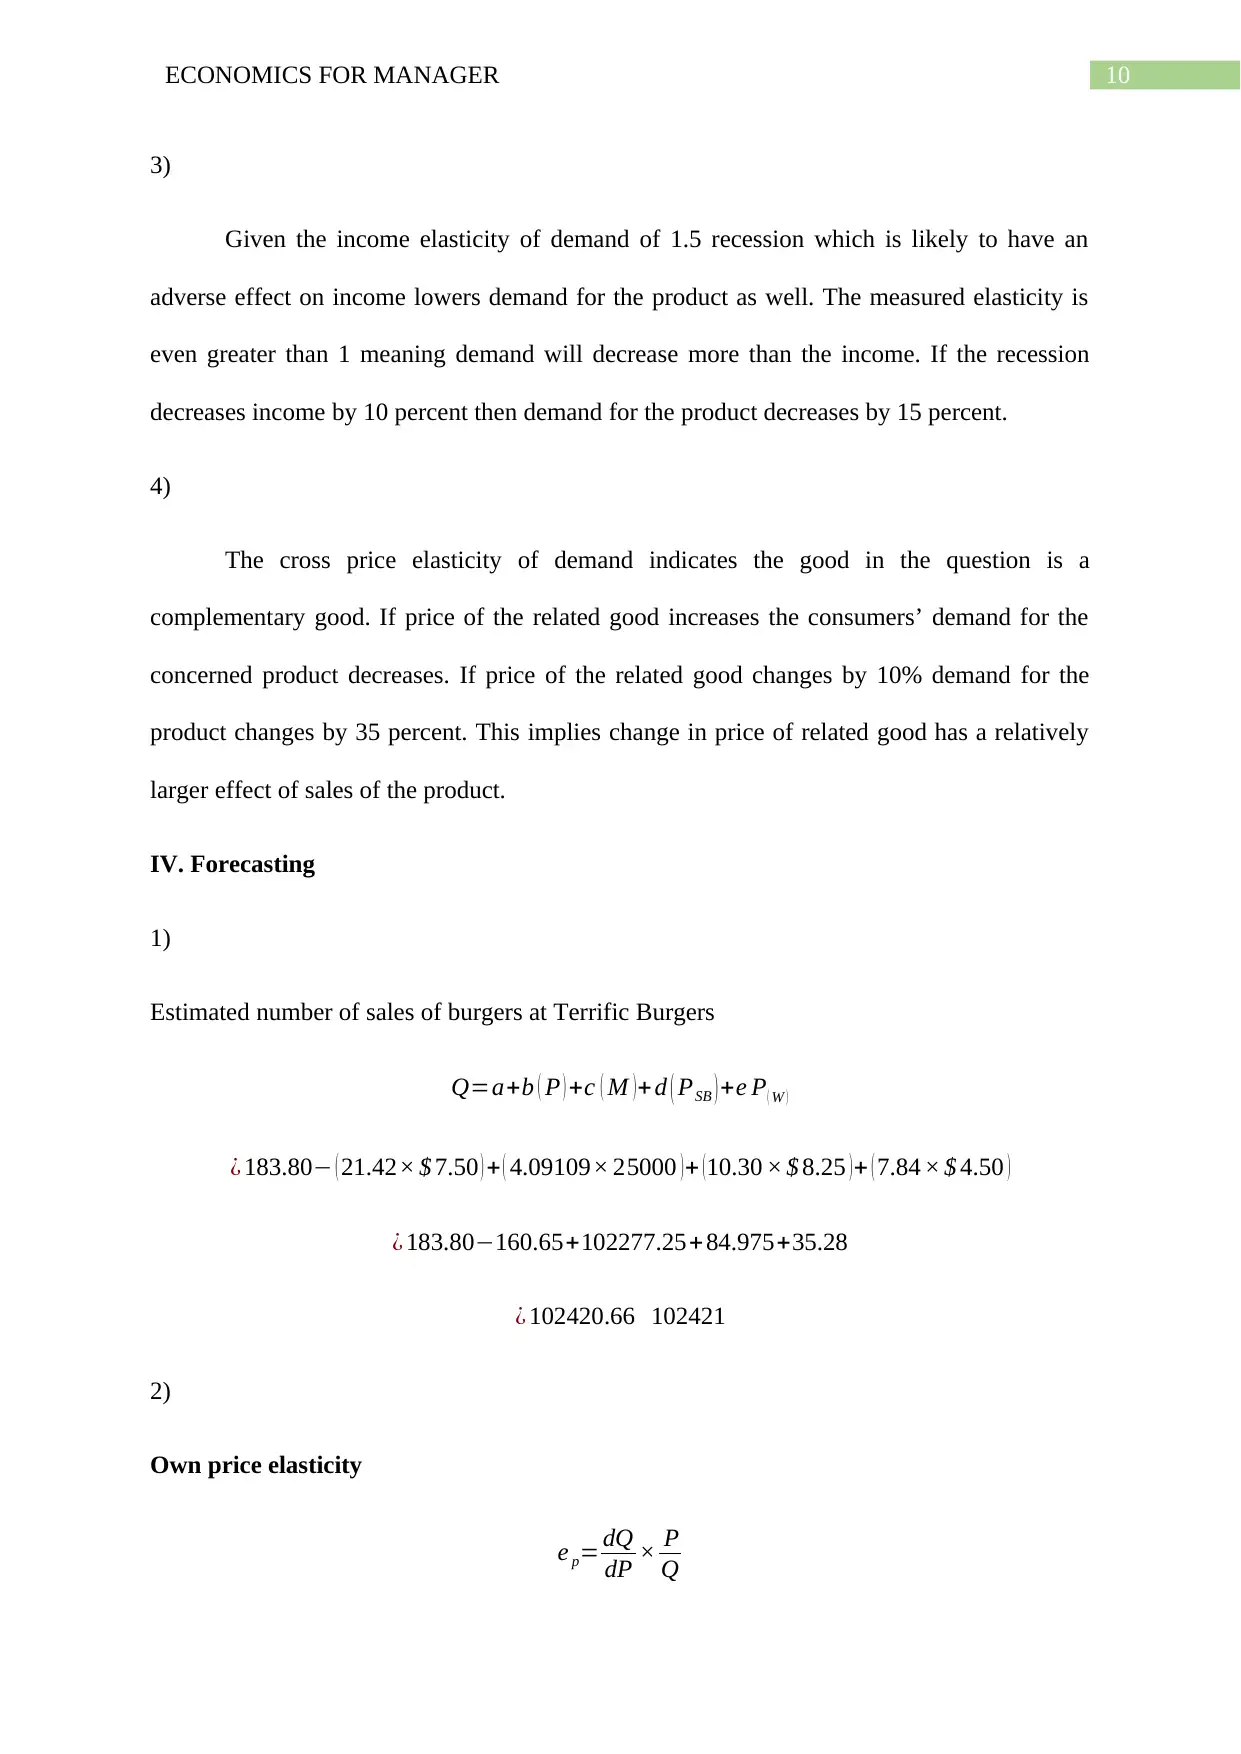
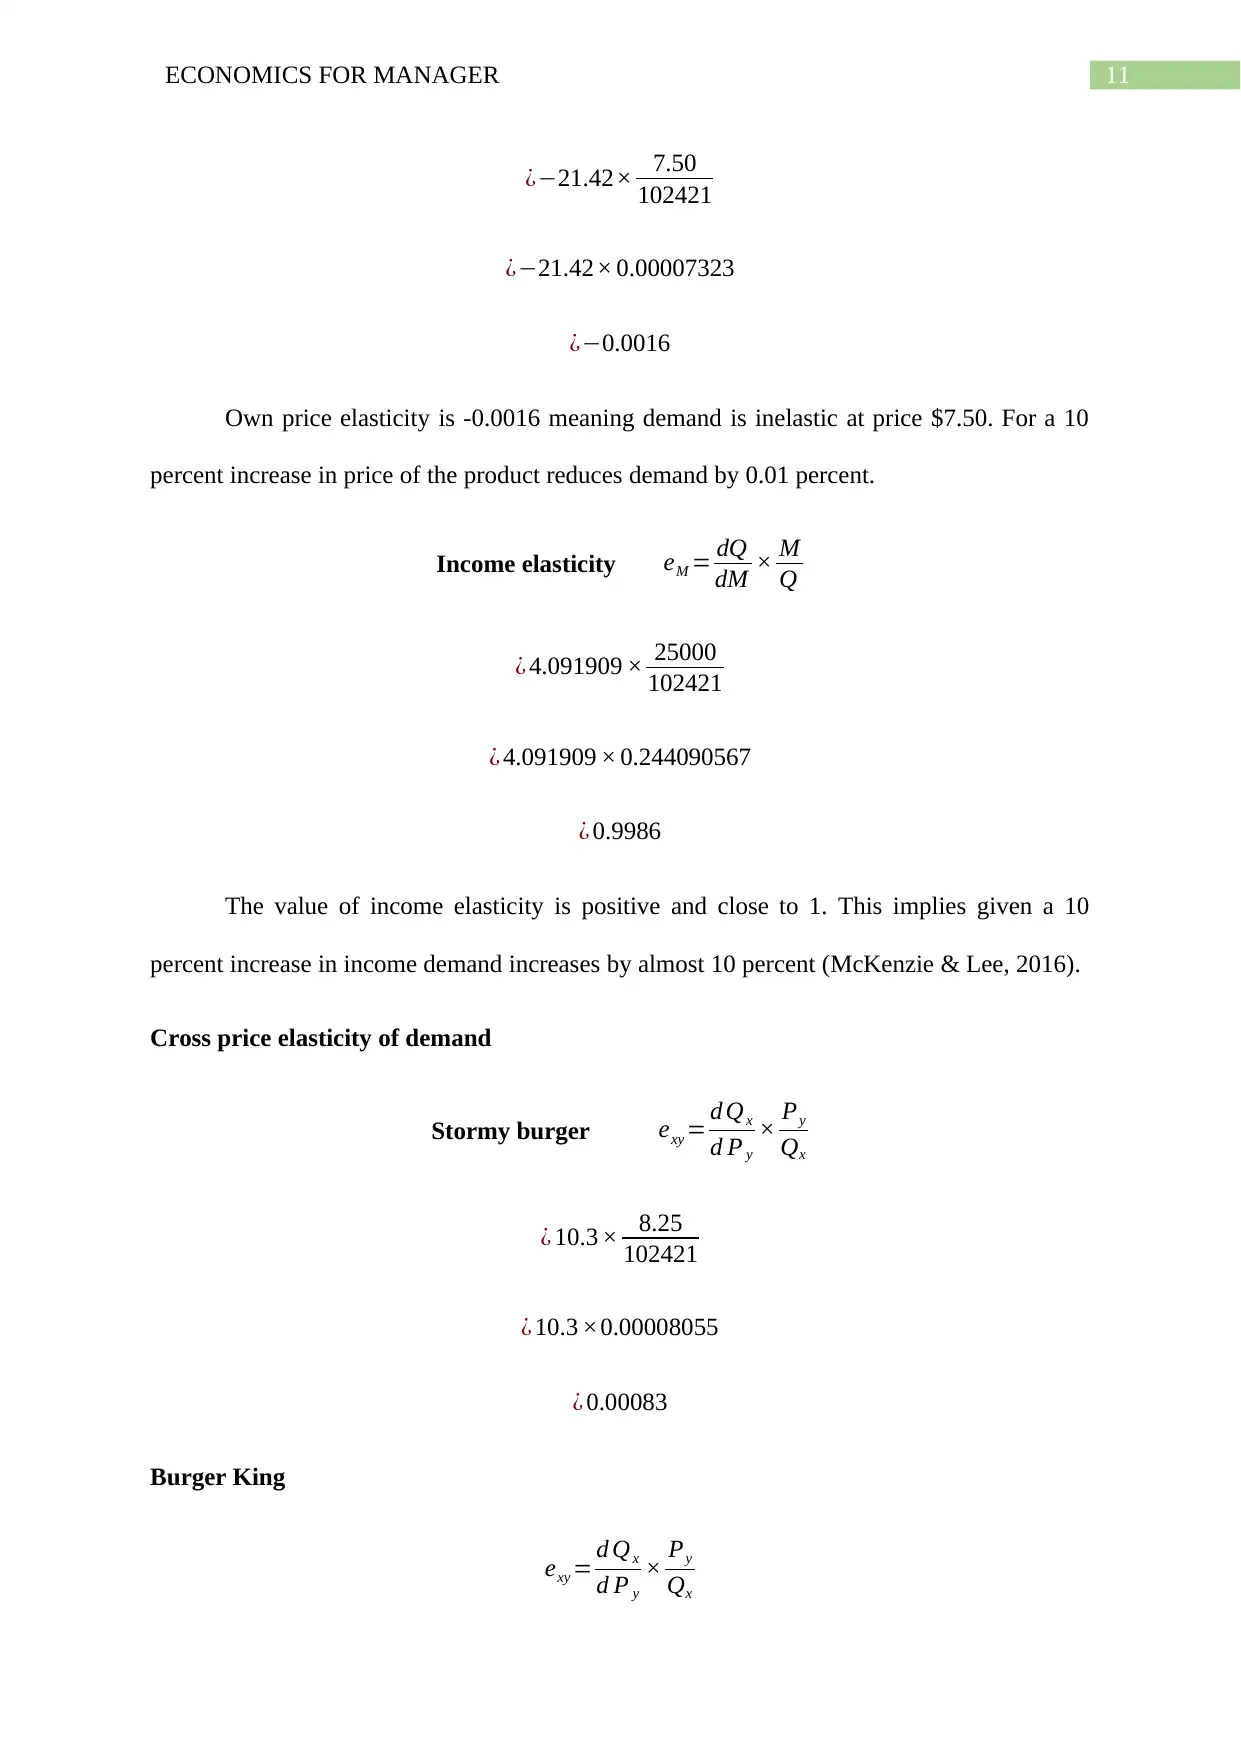
This economics report provides a comprehensive analysis of key economic concepts relevant to managerial decision-making. The report begins with a Net Present Value (NPV) analysis, evaluating the financial viability of a project under different discount rates. It then delves into the impact of various factors on the demand for Wrangler jeans, including changes in the price of substitute goods, shifts in consumer preferences, and alterations in production costs and wages. The report further explores the concept of elasticities, calculating price elasticity of demand and examining its implications for revenue maximization. It also considers income and cross-price elasticities, assessing how changes in income and the prices of related goods affect demand. Finally, the report applies these economic principles to forecasting sales for Terrific Burgers, analyzing own-price, income, and cross-price elasticities to inform pricing and strategic decisions. The report also includes references to relevant economic literature.
tabler-icon-diamond-filled.svg

Contribute Materials

Your contribution can guide someone’s learning journey. Share your documents today.
Document Page
Running head: ECONOMICS FOR MANAGER
Economics for Manager
Name of the Student
Name of the University
Course ID
tabler-icon-diamond-filled.svg

Secure Best Marks with AI Grader

Need help grading? Try our AI Grader for instant feedback on your assignments.
Document Page
1ECONOMICS FOR MANAGER
Table of Contents
I. To Buy or Not to Buy.............................................................................................................2
II. Wranglers Jeans.....................................................................................................................2
III. Elasticities............................................................................................................................6
IV. Forecasting.........................................................................................................................10
References................................................................................................................................13
Document Page
2ECONOMICS FOR MANAGER
I. To Buy or Not to Buy
Table 1: Calculation table for Net Present Value
1) With 6 percent discount rate, the press should be bought as the NPV is $139,267.65 which
indicates that the project will provide higher return in the long run.
2) If the discount rate is 10 percent, the NPV for the project is - $347,978.03 meaning buying
the press the company would incur a loss and therefore should not buy the press (Cornwall,
Vang & Hartman, 2019).
3) In case of discount rate is 4 percent, the NPV of the project is $440, 810.63 which is higher
than the same received with a discount rate of 6 percent. Hence, she should buy the press.
II. Wranglers Jeans
1)
Document Page
3ECONOMICS FOR MANAGER
Figure 1: Impact of an increase in price of cargo pants
Demand for Wrangle Jeans will change because of the change in the price of related
products. Because of a rise in price of cargo pants that are substitutes of Jeans, demand for
Jeans will increase as people substitute cargo pants with relatively cheaper Jeans.
Consequently, there will be a rightward shift of the demand curve of Wrangler Jeans leading
to an increase in equilibrium price and equilibrium quantity of Jeans.
2)
Figure 2: Impact of a change in perception towards wearing Jeans
tabler-icon-diamond-filled.svg

Secure Best Marks with AI Grader

Need help grading? Try our AI Grader for instant feedback on your assignments.
Document Page
4ECONOMICS FOR MANAGER
Given the perception that wearing jeans is not as fashionable as it once was leads to a
change in taste and preferences for Jeans. Under this circumstance people prefer Jeans less
resulting in a decrease in demand for Jeans (Kreps, 2019). This causes demand curve for
Jeans to shift leftward. Because of decrease in demand for Jeans, equilibrium price and
equilibrium quantity of Jeans will be lowered.
3)
Figure 3: Effect of an increase in transportation cost
An increase in the price of transporting the jeans from China where they are made to
United State where they are sold indicate an increase in input cost. The increase in
transportation cost increases effective cost of production and therefore reduces supply of
jeans. In response to the event supply curve of jeans shifts inward. As a result equilibrium
price of jeans increases and that of the equilibrium quantity of jeans fall.
Document Page
5ECONOMICS FOR MANAGER
4)
Figure 4: Impact of a fall in wage
Fall in wages paid to factory workers who make the jeans relates to the input cost of
production. As wage decreases, production cost of jeans falls resulting in an increase in
supply of jeans. With increase in supply of jeans the supply curve of jeans shifts outward
(Mankiw, 2020). Because of the excess supply of jeans, equilibrium price of jeans fall and
that of equilibrium quantity of jeans increases.
5)
Document Page
6ECONOMICS FOR MANAGER
Figure 5: Effect of increase in number of Jeans manufacturer
Increase in number of companies manufacturing jeans has the similar effect on supply
as the increase in number of sellers in the market has. In this case, supply of jeans in the
market increases causing supply curve of jean to shift to the right. Because of the event
equilibrium price and equilibrium quantity of jeans increases.
III. Elasticities
QD=500050 PX
a)
If price of the product is $50,
QD=500050 PX
¿ 5000 (50 × 50 )
¿ 50002500
¿ 2500
Price elasticity of demand at price $50,
Price elasticity of demand= dQ
dP × P
Q
¿50 × 50
2500
¿50 ×0.02
¿1.0
Demand therefore is unit elastic if price of the product is $50.
tabler-icon-diamond-filled.svg

Paraphrase This Document

Need a fresh take? Get an instant paraphrase of this document with our AI Paraphraser
Document Page
7ECONOMICS FOR MANAGER
Document Page
8ECONOMICS FOR MANAGER
b)
If price of the product is $75,
QD=500050 PX
¿ 5000 (50 × 75 )
¿ 50003750
¿ 1250
Price elasticity of demand at price $75,
Price elasticity of demand= dQ
dP × P
Q
¿50 × 75
1250
¿50 ×0.06
¿3.0
Demand therefore is elastic if price of the product is $50.
2)
At price $50 demand is unitary elastic meaning at this point demand changes by the
same magnitude as price. Therefore, increasing or decreasing price will have no effect on
revenue because of same proportionate change in demand.
When price of the product is $75, demand is elastic meaning that demand change by a
larger proportion of price. In this case the firm should lower price of the product since this
leads to an increase in revenue in terms of offsetting lower price by increased sales volume
(Cowell, 2018).
Document Page
9ECONOMICS FOR MANAGER
tabler-icon-diamond-filled.svg

Secure Best Marks with AI Grader

Need help grading? Try our AI Grader for instant feedback on your assignments.
Document Page
10ECONOMICS FOR MANAGER
3)
Given the income elasticity of demand of 1.5 recession which is likely to have an
adverse effect on income lowers demand for the product as well. The measured elasticity is
even greater than 1 meaning demand will decrease more than the income. If the recession
decreases income by 10 percent then demand for the product decreases by 15 percent.
4)
The cross price elasticity of demand indicates the good in the question is a
complementary good. If price of the related good increases the consumers’ demand for the
concerned product decreases. If price of the related good changes by 10% demand for the
product changes by 35 percent. This implies change in price of related good has a relatively
larger effect of sales of the product.
IV. Forecasting
1)
Estimated number of sales of burgers at Terrific Burgers
Q=a+b ( P ) +c ( M ) + d ( PSB ) +e P ( W )
¿ 183.80 ( 21.42× $ 7.50 ) + ( 4.09109× 25000 ) + ( 10.30 × $ 8.25 ) + ( 7.84 × $ 4.50 )
¿ 183.80160.65+102277.25+ 84.975+35.28
¿ 102420.66 102421
2)
Own price elasticity
e p= dQ
dP × P
Q
Document Page
11ECONOMICS FOR MANAGER
¿21.42× 7.50
102421
¿21.42× 0.00007323
¿0.0016
Own price elasticity is -0.0016 meaning demand is inelastic at price $7.50. For a 10
percent increase in price of the product reduces demand by 0.01 percent.
Income elasticity eM = dQ
dM × M
Q
¿ 4.091909 × 25000
102421
¿ 4.091909 × 0.244090567
¿ 0.9986
The value of income elasticity is positive and close to 1. This implies given a 10
percent increase in income demand increases by almost 10 percent (McKenzie & Lee, 2016).
Cross price elasticity of demand
Stormy burger exy = d Qx
d P y
× Py
Qx
¿ 10.3 × 8.25
102421
¿ 10.3 ×0.00008055
¿ 0.00083
Burger King
exy = d Qx
d P y
× Py
Qx
Document Page
12ECONOMICS FOR MANAGER
¿ 7.84 × 4.5
102421
¿ 7.84 × 0.000044
¿ 0.00034
Cross price elasticity of demand is positive for both Stormy burger and Burger king.
The cross price elasticity of demand suggests that an increase in price of any of the
competitor’s product would lead to an increase in demand for Terrific Burgers.
3)
The own price elasticity of demand for Terrific burger is relatively inelastic. Given
the inelastic demand, she should increase price she is selling to increase revenue. In this case
decrease in sales volume is relatively lower than increase in price causing an increase in
revenue.
When an economy heading into a recession people generally experience a fall in
income. The income elasticity of demand for Ann’s product is positive and almost equivalent
to 1 meaning that Ann will experience an almost same proportionate decrease in sales (Fine,
2016).
Stormy Burgers is the main competitor since cross price elasticity is higher with
Stormy Burger. The impact of a change in pricing decision of Stormy Burger on sales of
Terrific Burger is relatively larger than the same of Burger King.
References
Cornwall, J. R., Vang, D. O., & Hartman, J. M. (2019). Entrepreneurial financial
management: an applied approach. Routledge.
tabler-icon-diamond-filled.svg

Paraphrase This Document

Need a fresh take? Get an instant paraphrase of this document with our AI Paraphraser
Document Page
13ECONOMICS FOR MANAGER
Cowell, F. (2018). Microeconomics: principles and analysis. Oxford University Press.
Fine, B. (2016). Microeconomics. University of Chicago Press Economics Books.
Kreps, D. M. (2019). Microeconomics for managers. Princeton University Press.
Mankiw, N. G. (2020). Principles of microeconomics. Cengage Learning.
McKenzie, R. B., & Lee, D. R. (2016). Microeconomics for MBAs: The economic way of
thinking for managers. Cambridge University Press.
chevron_up_icon
1 out of 14
circle_padding
hide_on_mobile
zoom_out_icon
logo.png

Your All-in-One AI-Powered Toolkit for Academic Success.

Available 24*7 on WhatsApp / Email

[object Object]