University Economics Assignment: Fuel Prices, Taxation, and Demand
VerifiedAdded on 2023/01/18
|7
|663
|92
Homework Assignment
AI Summary
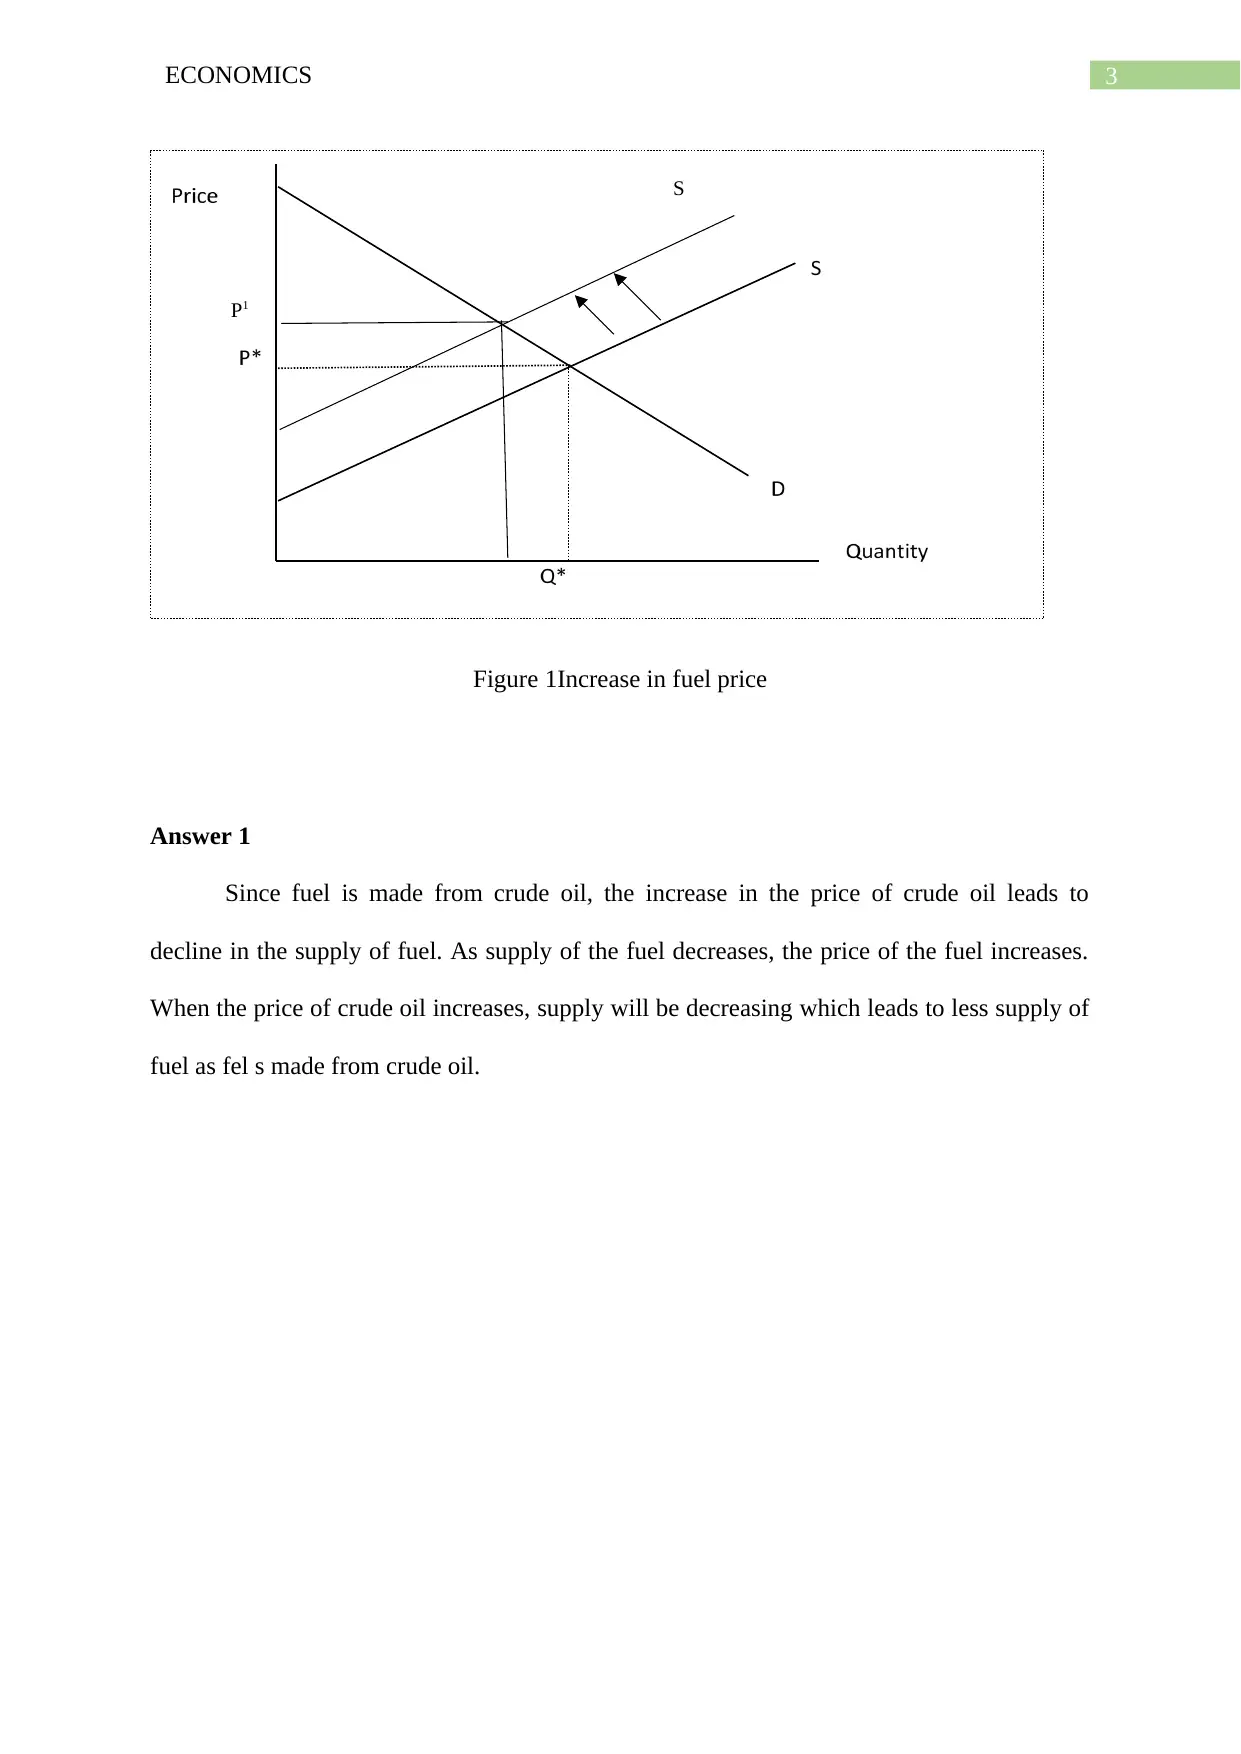
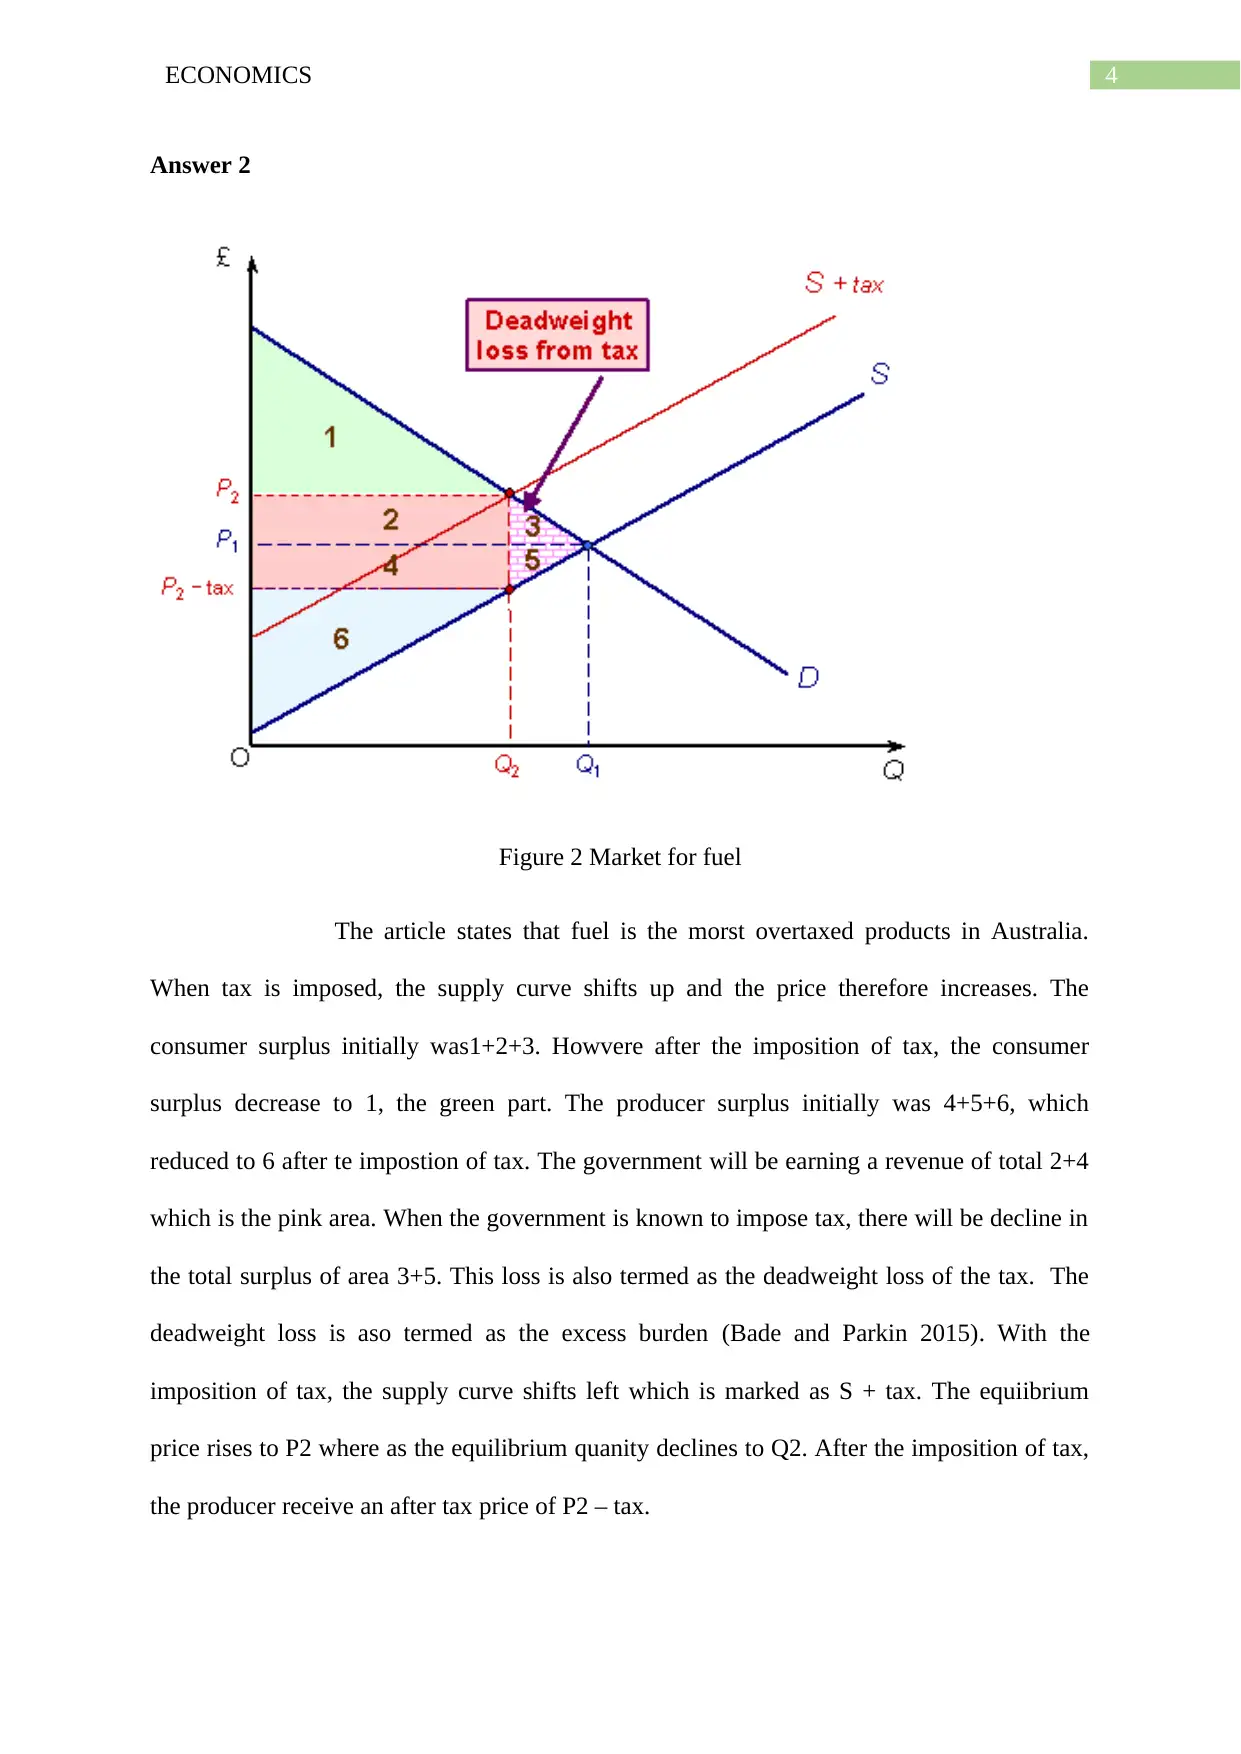
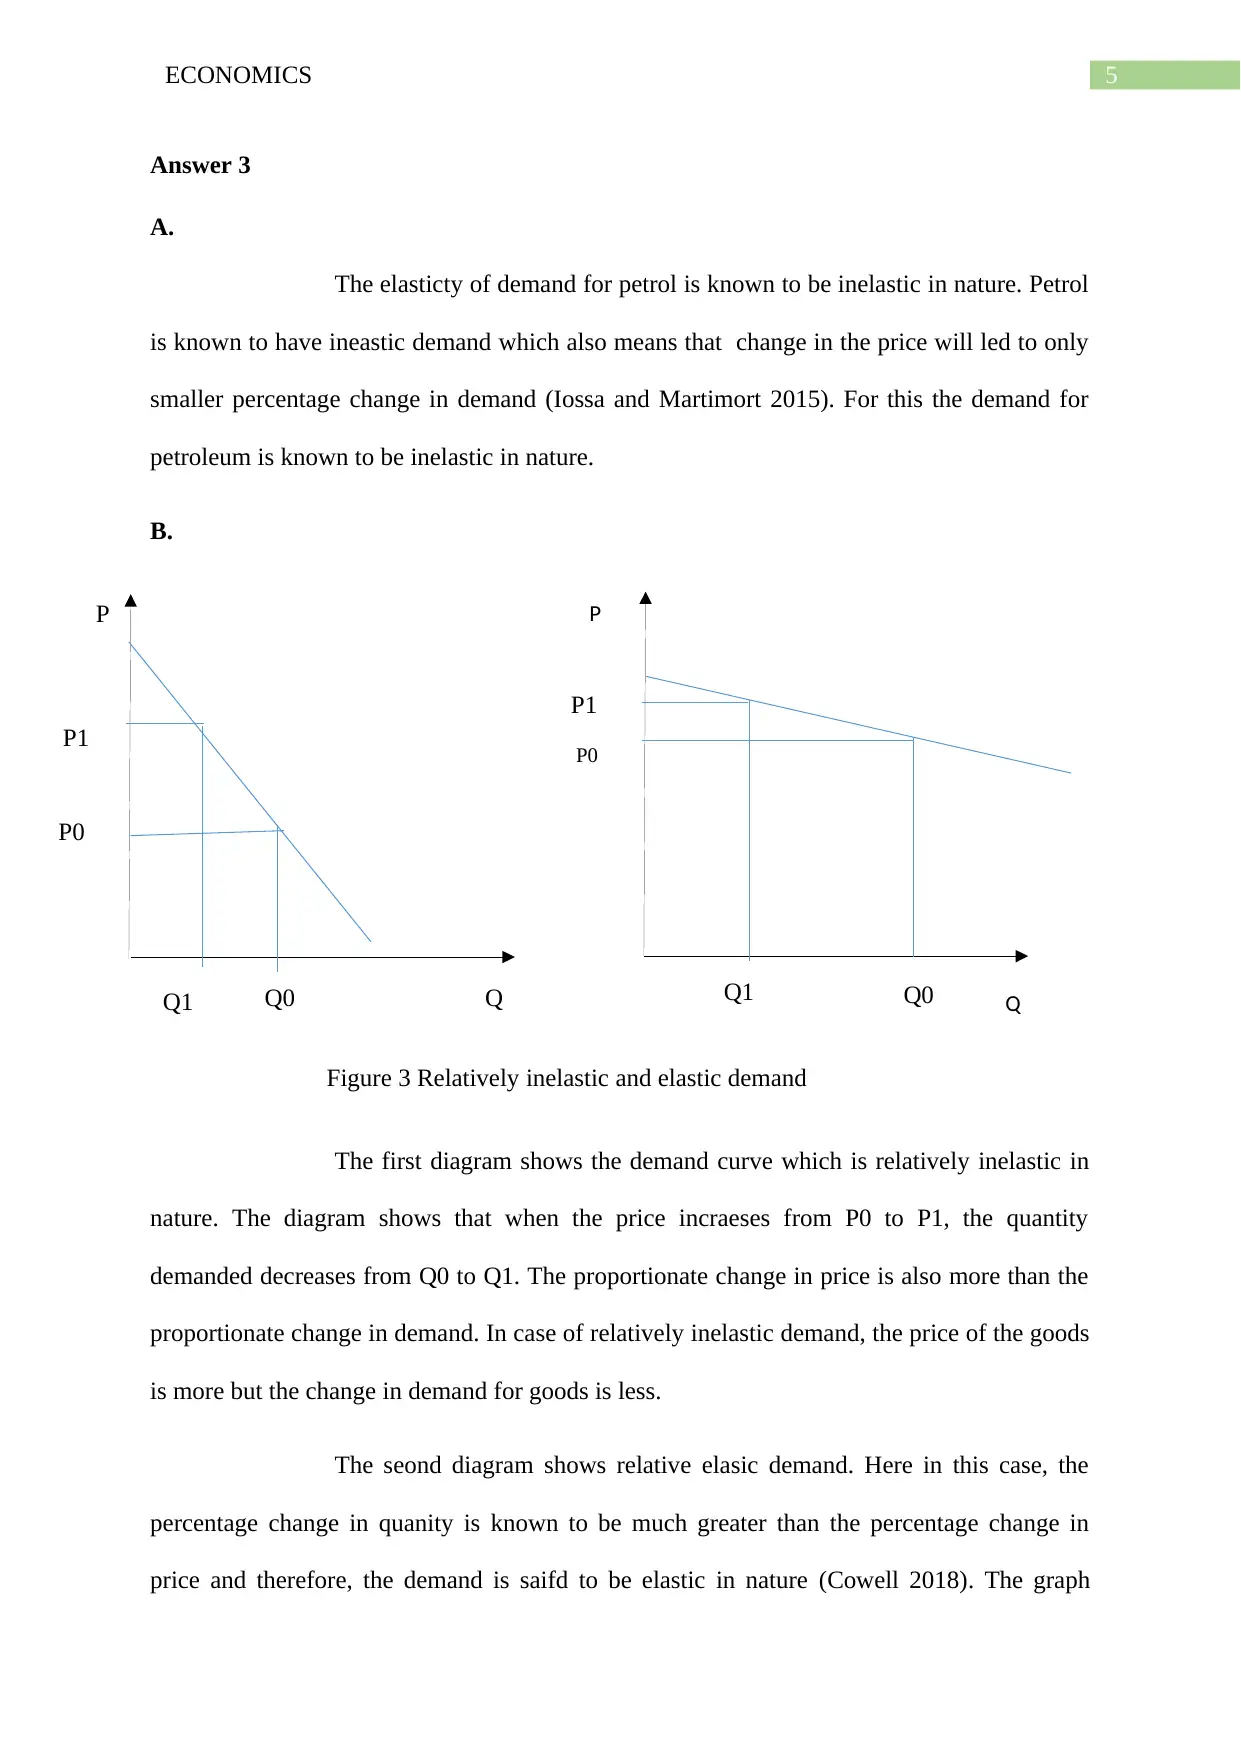
This economics assignment analyzes the impact of crude oil price increases on fuel supply and demand, illustrating the effects with a supply and demand diagram. It then examines the impact of fuel taxation in Australia, explaining how taxes affect consumer and producer surplus, government revenue, and deadweight loss using a market diagram. The assignment further explores the concept of demand elasticity for petrol, classifying it as inelastic and providing diagrams to differentiate between relatively elastic and inelastic demand curves. The solution references the provided article and relevant economic literature to support its analysis and conclusions. It addresses the provided assignment brief, answering the questions and completing the diagrams as required.

Running head: ECONOMICS
Economics
Name of the student
Name of the university
Author note
Economics
Name of the student
Name of the university
Author note
Paraphrase This Document
Need a fresh take? Get an instant paraphrase of this document with our AI Paraphraser

2ECONOMICS
Table of Contents
Answer 1....................................................................................................................................3
Answer 2....................................................................................................................................4
Answer 3....................................................................................................................................5
A.............................................................................................................................................5
B.............................................................................................................................................5
Reference list..............................................................................................................................7

3ECONOMICS
Figure 1Increase in fuel price
Answer 1
Since fuel is made from crude oil, the increase in the price of crude oil leads to
decline in the supply of fuel. As supply of the fuel decreases, the price of the fuel increases.
When the price of crude oil increases, supply will be decreasing which leads to less supply of
fuel as fel s made from crude oil.
P1
S
⊘ This is a preview!⊘
Do you want full access?
Subscribe today to unlock all pages.

Trusted by 1+ million students worldwide

4ECONOMICS
Answer 2
Figure 2 Market for fuel
The article states that fuel is the morst overtaxed products in Australia.
When tax is imposed, the supply curve shifts up and the price therefore increases. The
consumer surplus initially was1+2+3. Howvere after the imposition of tax, the consumer
surplus decrease to 1, the green part. The producer surplus initially was 4+5+6, which
reduced to 6 after te impostion of tax. The government will be earning a revenue of total 2+4
which is the pink area. When the government is known to impose tax, there will be decline in
the total surplus of area 3+5. This loss is also termed as the deadweight loss of the tax. The
deadweight loss is aso termed as the excess burden (Bade and Parkin 2015). With the
imposition of tax, the supply curve shifts left which is marked as S + tax. The equiibrium
price rises to P2 where as the equilibrium quanity declines to Q2. After the imposition of tax,
the producer receive an after tax price of P2 – tax.
Paraphrase This Document
Need a fresh take? Get an instant paraphrase of this document with our AI Paraphraser

5ECONOMICS
P P
Q QQ1 Q0
P1
P0
P1
P0
Q1 Q0
Answer 3
A.
The elasticty of demand for petrol is known to be inelastic in nature. Petrol
is known to have ineastic demand which also means that change in the price will led to only
smaller percentage change in demand (Iossa and Martimort 2015). For this the demand for
petroleum is known to be inelastic in nature.
B.
The first diagram shows the demand curve which is relatively inelastic in
nature. The diagram shows that when the price incraeses from P0 to P1, the quantity
demanded decreases from Q0 to Q1. The proportionate change in price is also more than the
proportionate change in demand. In case of relatively inelastic demand, the price of the goods
is more but the change in demand for goods is less.
The seond diagram shows relative elasic demand. Here in this case, the
percentage change in quanity is known to be much greater than the percentage change in
price and therefore, the demand is saifd to be elastic in nature (Cowell 2018). The graph
Figure 3 Relatively inelastic and elastic demand

6ECONOMICS
above sows that when the price of good increases from P0 to P1, the demand for goods will
be decreasing from Q0 to Q1.The demand for goods therefore will be declining. However,
the proportionate change in quantity is much more than proportionate change in price.
above sows that when the price of good increases from P0 to P1, the demand for goods will
be decreasing from Q0 to Q1.The demand for goods therefore will be declining. However,
the proportionate change in quantity is much more than proportionate change in price.
⊘ This is a preview!⊘
Do you want full access?
Subscribe today to unlock all pages.

Trusted by 1+ million students worldwide

7ECONOMICS
Reference list
Bade, R. and Parkin, M., 2015. Foundations of microeconomics. Pearson.
Baumol, W.J. and Blinder, A.S., 2015. Microeconomics: Principles and policy. Nelson
Education.
Cowell, F., 2018. Microeconomics: principles and analysis. Oxford University Press.
Iossa, E. and Martimort, D., 2015. The simple microeconomics of public‐private partnerships.
Journal of Public Economic Theory, 17(1), pp.4-48.
1 out of 7
Related Documents

Your All-in-One AI-Powered Toolkit for Academic Success.
+13062052269
info@desklib.com
Available 24*7 on WhatsApp / Email
Unlock your academic potential
Copyright © 2020–2025 A2Z Services. All Rights Reserved. Developed and managed by ZUCOL.