Economics for Business: Analysis of the Australian Gas Industry
VerifiedAdded on 2022/09/30
|20
|5324
|32
Report
AI Summary
This report provides an in-depth analysis of the Australian gas industry, examining its structure, key players, and the significant changes it has undergone. The report explores the rising demand for natural gas, driven by factors such as its cleaner nature compared to coal and the growth of the LNG market. It analyzes historical gas price trends, identifying factors contributing to price hikes, including crude oil prices, local demand, and distribution costs. The analysis further delves into demand-related factors, such as increased local and export demand, and supply-side effects, including limited resources and shifts in supply curves. The report also discusses the role of substitutes like renewable energy sources and the impact of gas-fired power generators. Finally, it concludes with an overview of the current state of the Australian gas market and its future challenges and opportunities.
Running head: ECONOMICS FOR BUSINESS
Economics for Business
Name of the Student
Name of the University
Course ID
Economics for Business
Name of the Student
Name of the University
Course ID
Paraphrase This Document
Need a fresh take? Get an instant paraphrase of this document with our AI Paraphraser
1ECONOMICS FOR BUSINESS
Answer 1
Introduction
Australia has a highly complex gas industry comprising of about 150 gas companies.
They are grouped into operational divisions, gas types, deposit basins and group of players. This
sector is undergoing a great deal of changes due high usage by replacing coal (Baffes et al.,
2015). The structure works in response to retrogress the environmental conditions and issues
regarding air pollution. The economy plays an essential role for growth in seaborne trade of
Liquefied Natural Gas (LNG) that acts as a special implication for investing by the investors.
Australian economy is based on an open trade model such that alteration of demand and
supply of goods in other countries have a strong impact on the economy. Booms in terms of trade
was directed by the sharp increase in price of export commodities (Cassidy & Kosev, 2015).
Australia has ample supply of natural resources directing it towards the second largest reachable
reserves of iron ore. The market resource as the fifth largest reserves of coal and compelling gas
assets. Since the middle of 2000s, gas prices starting increasing due to arrival if global demand
and lack of supply. Rise of price in extraordinary amount provoked massive investment in gas
industry which positively affected the business with increased profits.
Discussion
Natural gas consumption has risen over the past ten years. LNG has huge demand due to
its flexibility degree in the market. Being relatively modest, Australia gained over the overall
market and became as the world’s largest exporter of LNG in 2018 (Collard‐Wexler, 2013). This
upraise is fascinated by a list of factors such as climate, favourable business coverage and
geographic proximity of potential buyers and efficiency of skilled labours. Even with such rising
2ECONOMICS FOR BUSINESS
benefits, the industry has been facing surveillance from environmentalists who have
contaminated the industry’s status.
The Australian Petroleum Production and Exploration Association (APPEA) planned on
taking more active policies in the promotion of the industry. The aim is to attract more domestic
and global customers and entrepreneurs. Australia is reported to export an approximate amount
of 80 million tonnes of chilled natural gas. The next session of this expansion is expected to be in
2020 as producers are gearing up for it (Collard‐Wexler, 2013).
Trend in change of gas price
Usage of total gas has grown steadily from 2006. The biggest rise came from the
electricity sector for its generation. Mining sector was another big sector to have used gas in
huge proportions.
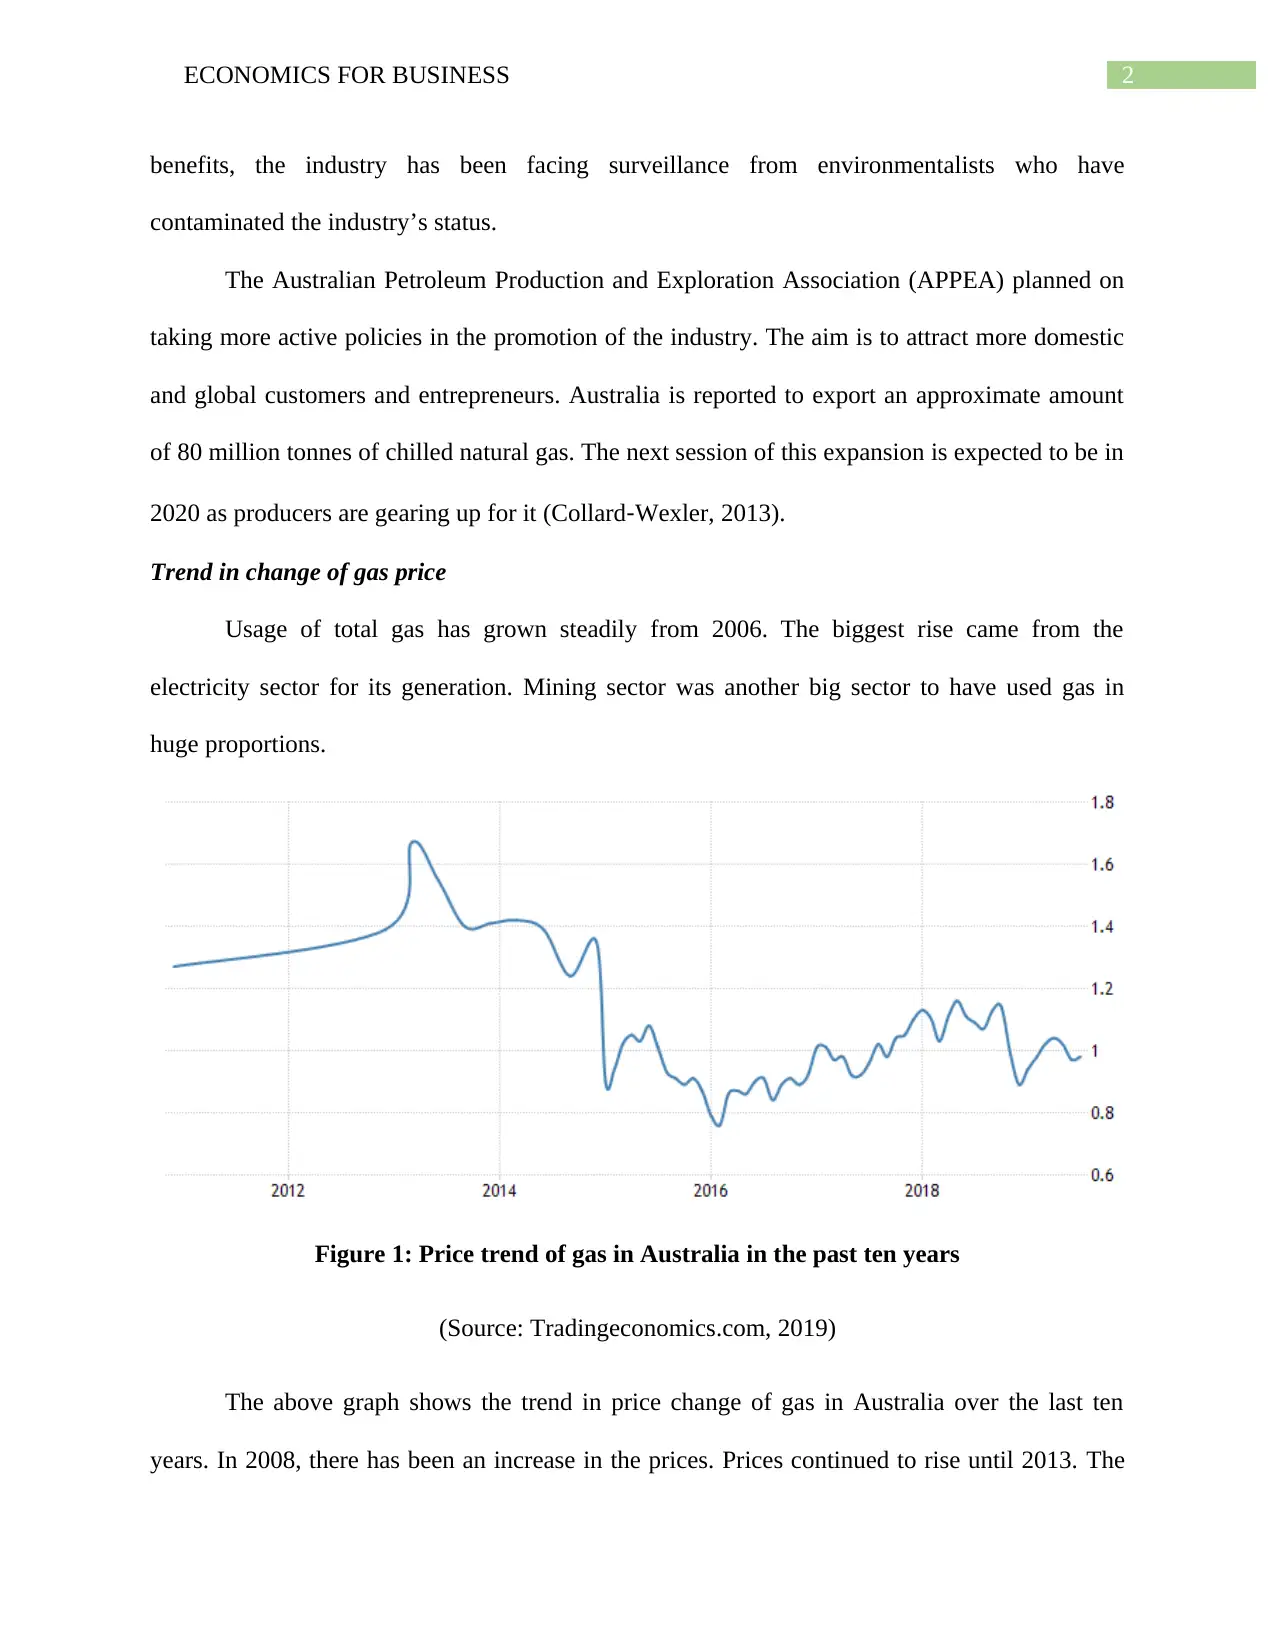
Figure 1: Price trend of gas in Australia in the past ten years
(Source: Tradingeconomics.com, 2019)
The above graph shows the trend in price change of gas in Australia over the last ten
years. In 2008, there has been an increase in the prices. Prices continued to rise until 2013. The
benefits, the industry has been facing surveillance from environmentalists who have
contaminated the industry’s status.
The Australian Petroleum Production and Exploration Association (APPEA) planned on
taking more active policies in the promotion of the industry. The aim is to attract more domestic
and global customers and entrepreneurs. Australia is reported to export an approximate amount
of 80 million tonnes of chilled natural gas. The next session of this expansion is expected to be in
2020 as producers are gearing up for it (Collard‐Wexler, 2013).
Trend in change of gas price
Usage of total gas has grown steadily from 2006. The biggest rise came from the
electricity sector for its generation. Mining sector was another big sector to have used gas in
huge proportions.
Figure 1: Price trend of gas in Australia in the past ten years
(Source: Tradingeconomics.com, 2019)
The above graph shows the trend in price change of gas in Australia over the last ten
years. In 2008, there has been an increase in the prices. Prices continued to rise until 2013. The
⊘ This is a preview!⊘
Do you want full access?
Subscribe today to unlock all pages.
Trusted by 1+ million students worldwide
3ECONOMICS FOR BUSINESS
average gas price was about 1.27 litres in the financial year of 2008-2009. A steady downfall in
the price is estimated which fluctuates in a range of 1.2-1.4 percent during 2015. In 2016, LNG
exports from eastern Australia was evaluated as 43% of the country’s total LNG exports. The
wholesale price of electricity has fallen from the previous level in the middle of 2017 (Downes &
Tulip, 2014). However, this fall is much bigger than the price level 20 years back. Again, from
2017 the price started to increase which again fell at the end of 2018.
Reasons for hike in price
Gas price was determined from the crude oil prices, local demand, strength of local
currencies and distribution costs. Due to trade, fuel and diesel prices have been transformed. The
average price of petrol became 160 per litre in 2018 from 90 every litre (Espig & de Rijke,
2016).
For most of the past 10 years, Australia’s National Electricity Market (NEM) was
oversupplied and powered by low-cost fuels in old power stations. Then things suddenly
changed. Big, coal-fired power stations were closed – Northern in South Australia in 2016,
followed by Hazelwood in Victoria in 2017. So supply was reduced, pushing prices up. At the
same time, gas and coal prices rose rapidly, increasing running costs for electricity generators,
which pushed up prices even further.
Factors related to price rise
Prices of gases for manufacturing households and businesses have increased acutely in
recent years giving a clear indication that prices are going to increase. Australian State and
Territory government is given the responsibility of regulating gas price all over the world. The
Paraphrase This Document
Need a fresh take? Get an instant paraphrase of this document with our AI Paraphraser
4ECONOMICS FOR BUSINESS
Australian Government has a little influence over the change in oil price level (Fan, MacGill &
Sproul, 2015).
The important components that raised the price is the whole cost that covered the generation of
electricity along with the extraction of gas. Payment for the delivery of power through pipelines
and service of meter reading raises the cost (Forrest & MacGill, 2013).
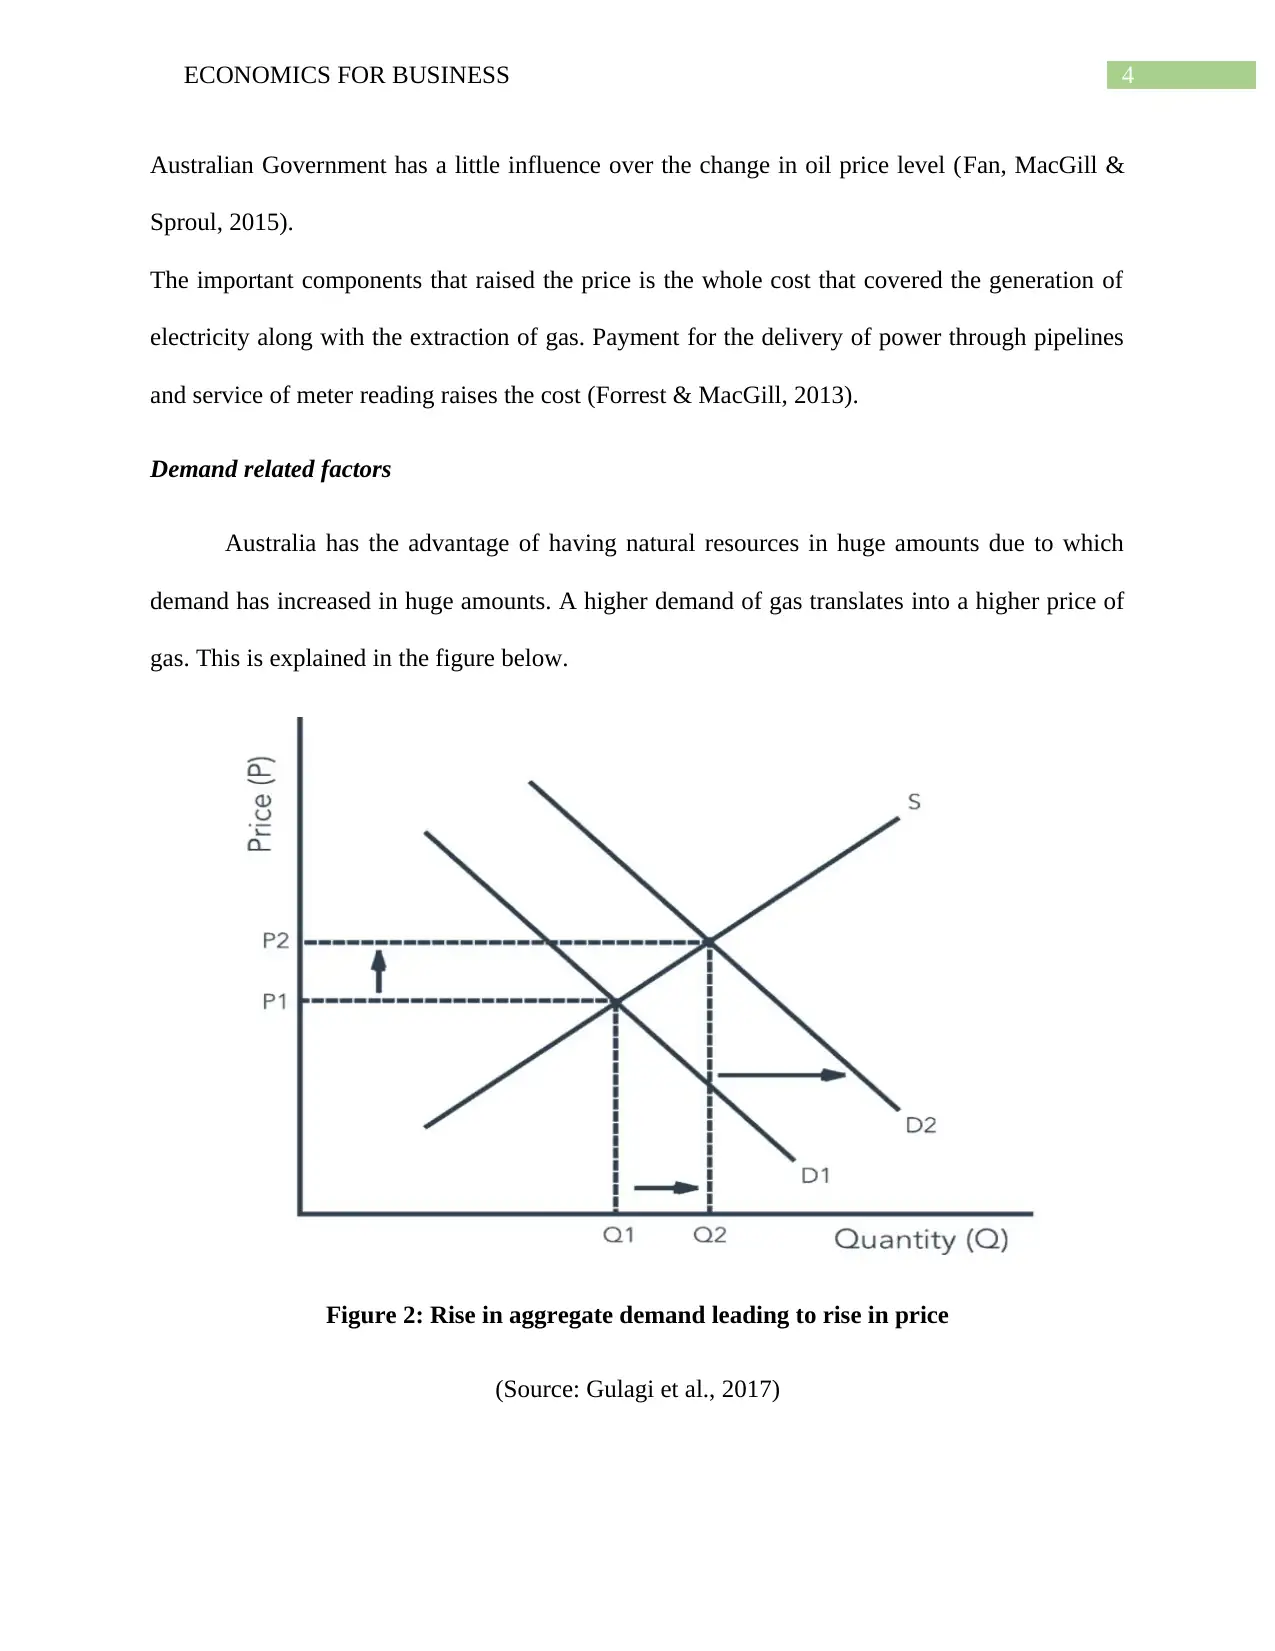
Demand related factors
Australia has the advantage of having natural resources in huge amounts due to which
demand has increased in huge amounts. A higher demand of gas translates into a higher price of
gas. This is explained in the figure below.
Figure 2: Rise in aggregate demand leading to rise in price
(Source: Gulagi et al., 2017)
Australian Government has a little influence over the change in oil price level (Fan, MacGill &
Sproul, 2015).
The important components that raised the price is the whole cost that covered the generation of
electricity along with the extraction of gas. Payment for the delivery of power through pipelines
and service of meter reading raises the cost (Forrest & MacGill, 2013).
Demand related factors
Australia has the advantage of having natural resources in huge amounts due to which
demand has increased in huge amounts. A higher demand of gas translates into a higher price of
gas. This is explained in the figure below.
Figure 2: Rise in aggregate demand leading to rise in price
(Source: Gulagi et al., 2017)
5ECONOMICS FOR BUSINESS
In the market, the initial demand and supply curve are given by D1 and S respectively.
Demand of natural gas in Australia increases at a faster rate due to increase in both local and
export demand. Now an increase in the demand shifts the demand curve rightwards from D1 to
D2. Supply remains fixed in its initial position S, because the companies do not increase the level
of production until the cost of production goes down. The equilibrium price and output produced
is determined by the intersection of demand and supply curves. Initially the price stays at point
P1 with the quantity demanded being Q1. However excess demand pushes up price from its
initial level to P2 leading to a rise in equilibrium quantity from Q1 to Q2. This is the reason why
Australia’s price of gas is increasing.
Conflicts among the retailers leads to hike in prices as each of them try to capture the
market. Gas at pumps are dependent on the wholesale price charged by the suppliers which
fluctuates daily. However, these swing in price fluctuation is determined by the shift of customer
demand for gas. These factors are not very reliable as number of people travelling are constantly
changing and so is the demand (Haslam Mckenzie, 2013). Yet, in cases of hurricane, effect of
natural calamity leads to lessening of supply as there arises a shortage of production. Rise in
consumer demand raises the aggregate demand for gas causing a rightward shift in aggregate
demand making prices to go higher.
Availability of Substitutes
Australia has immense capacity and wide distribution of wind, geothermal, solar, tidal
and wave resources. Hydro energy assets are broadly developed along with solar, wind and bio
energy sources to generate electricity as demanded by industries and other countries. Australia
deals in production of both renewable and non-renewable energy (Isakower & Wang, 2014).
This had led Australia to get a domineering power over other nations. Introduction of new
⊘ This is a preview!⊘
Do you want full access?
Subscribe today to unlock all pages.
Trusted by 1+ million students worldwide
6ECONOMICS FOR BUSINESS
advanced technologies such as solar hot water and geothermal heat pumps has marked the
efficient use of resources by saving time and increasing output per hour. However, reports have
predicted that an improvement in the technological sector has lowered the cost of production.
The utilization of renewable means by support of government scheme of the Renewable
Energy Target has resulted in declining installation cost. Innovation and updating of renewable
energy bearing is crucial for better storage and mapping techniques to undergo continued uptake
with grid integration policy (Landsburg, 2013). As a result, there is a lot of potential for
Australia to grasp the international market through discovery of renewable resource as supply
would not run out and price will not rise further.
Supply Side Effects
Resources are limited compared to human wants. Australia’s abundant supplies of natural gas is
going down both onshore and offshore (Moryadee, Gabriel & Avetisyan, 2014). When human
resources are shifted to the industrial sector and generating profits from them, much of the
energy is getting used up. Thus, we can say that supply of America’s resources is going down
causing a fall in supply with rising demand. The consequence can be seen with a rise in optimum
price.
Paraphrase This Document
Need a fresh take? Get an instant paraphrase of this document with our AI Paraphraser
7ECONOMICS FOR BUSINESS
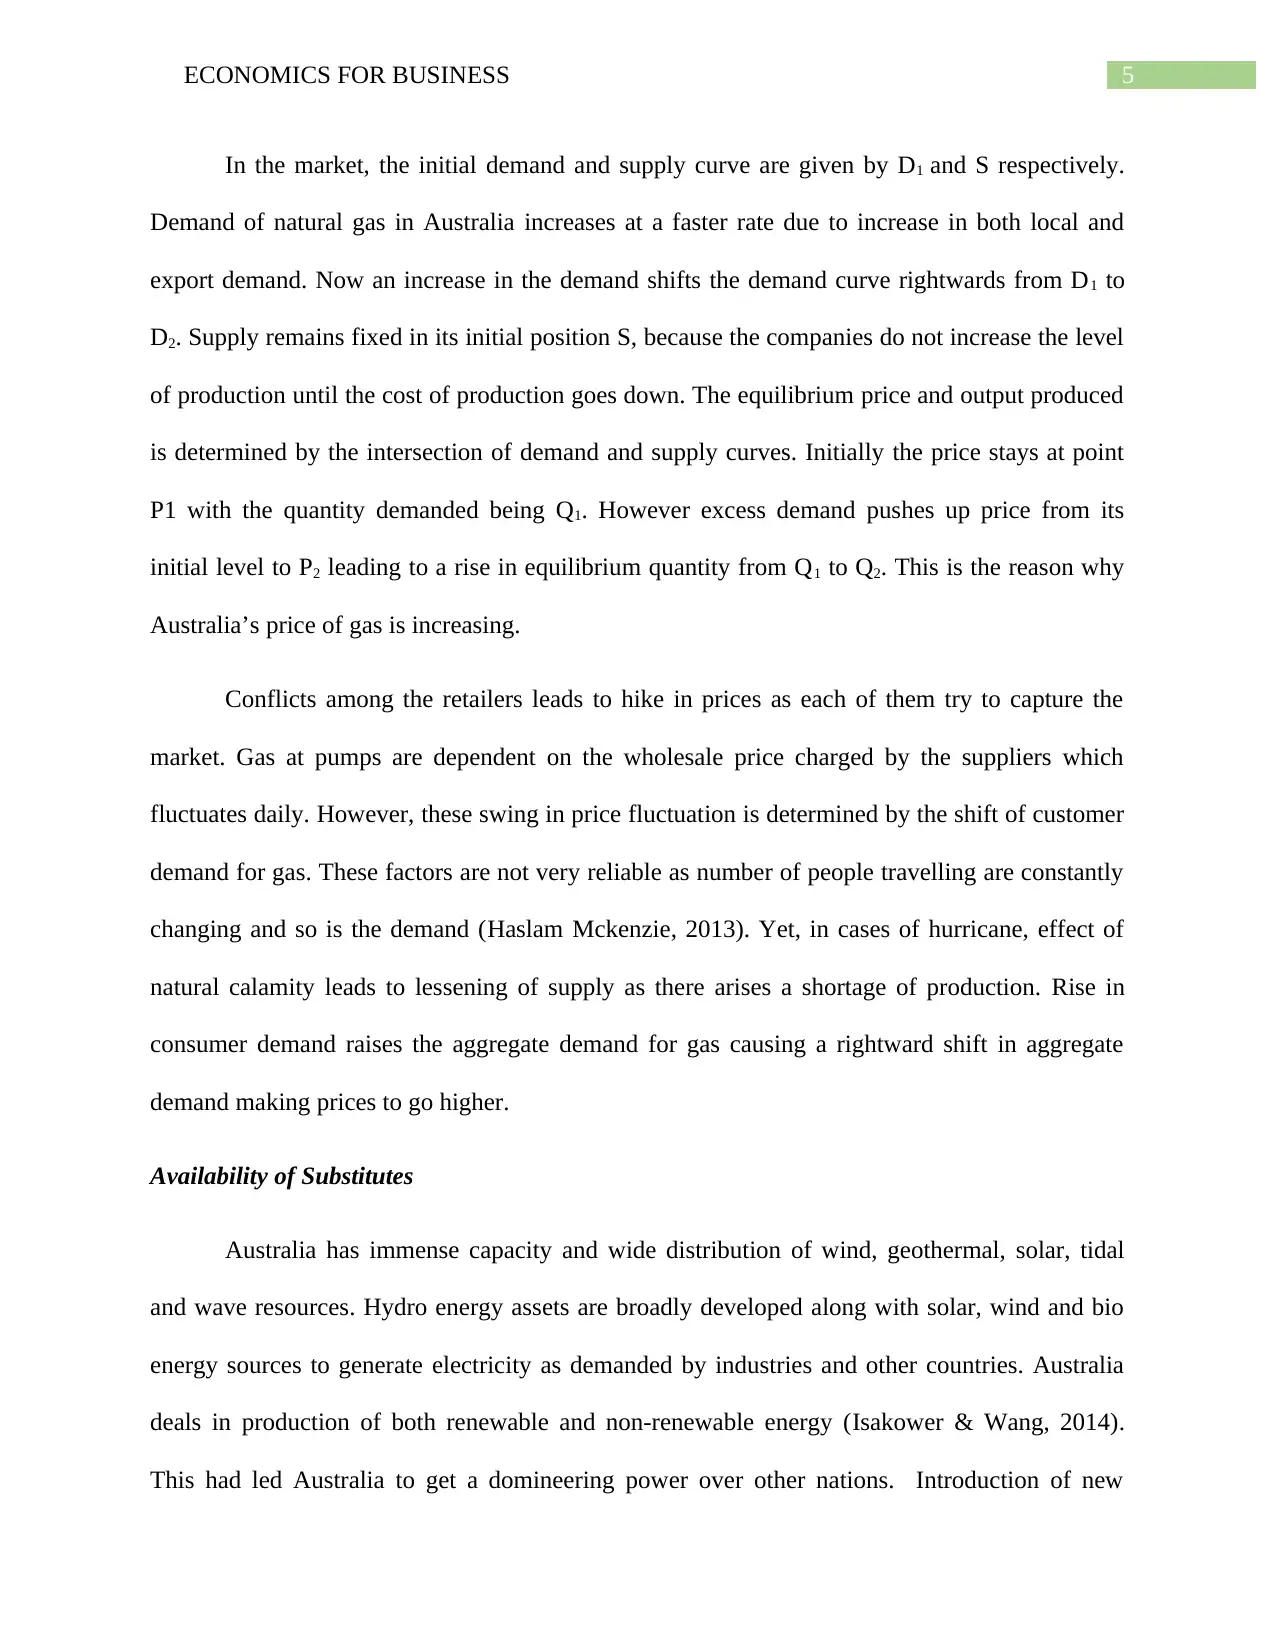
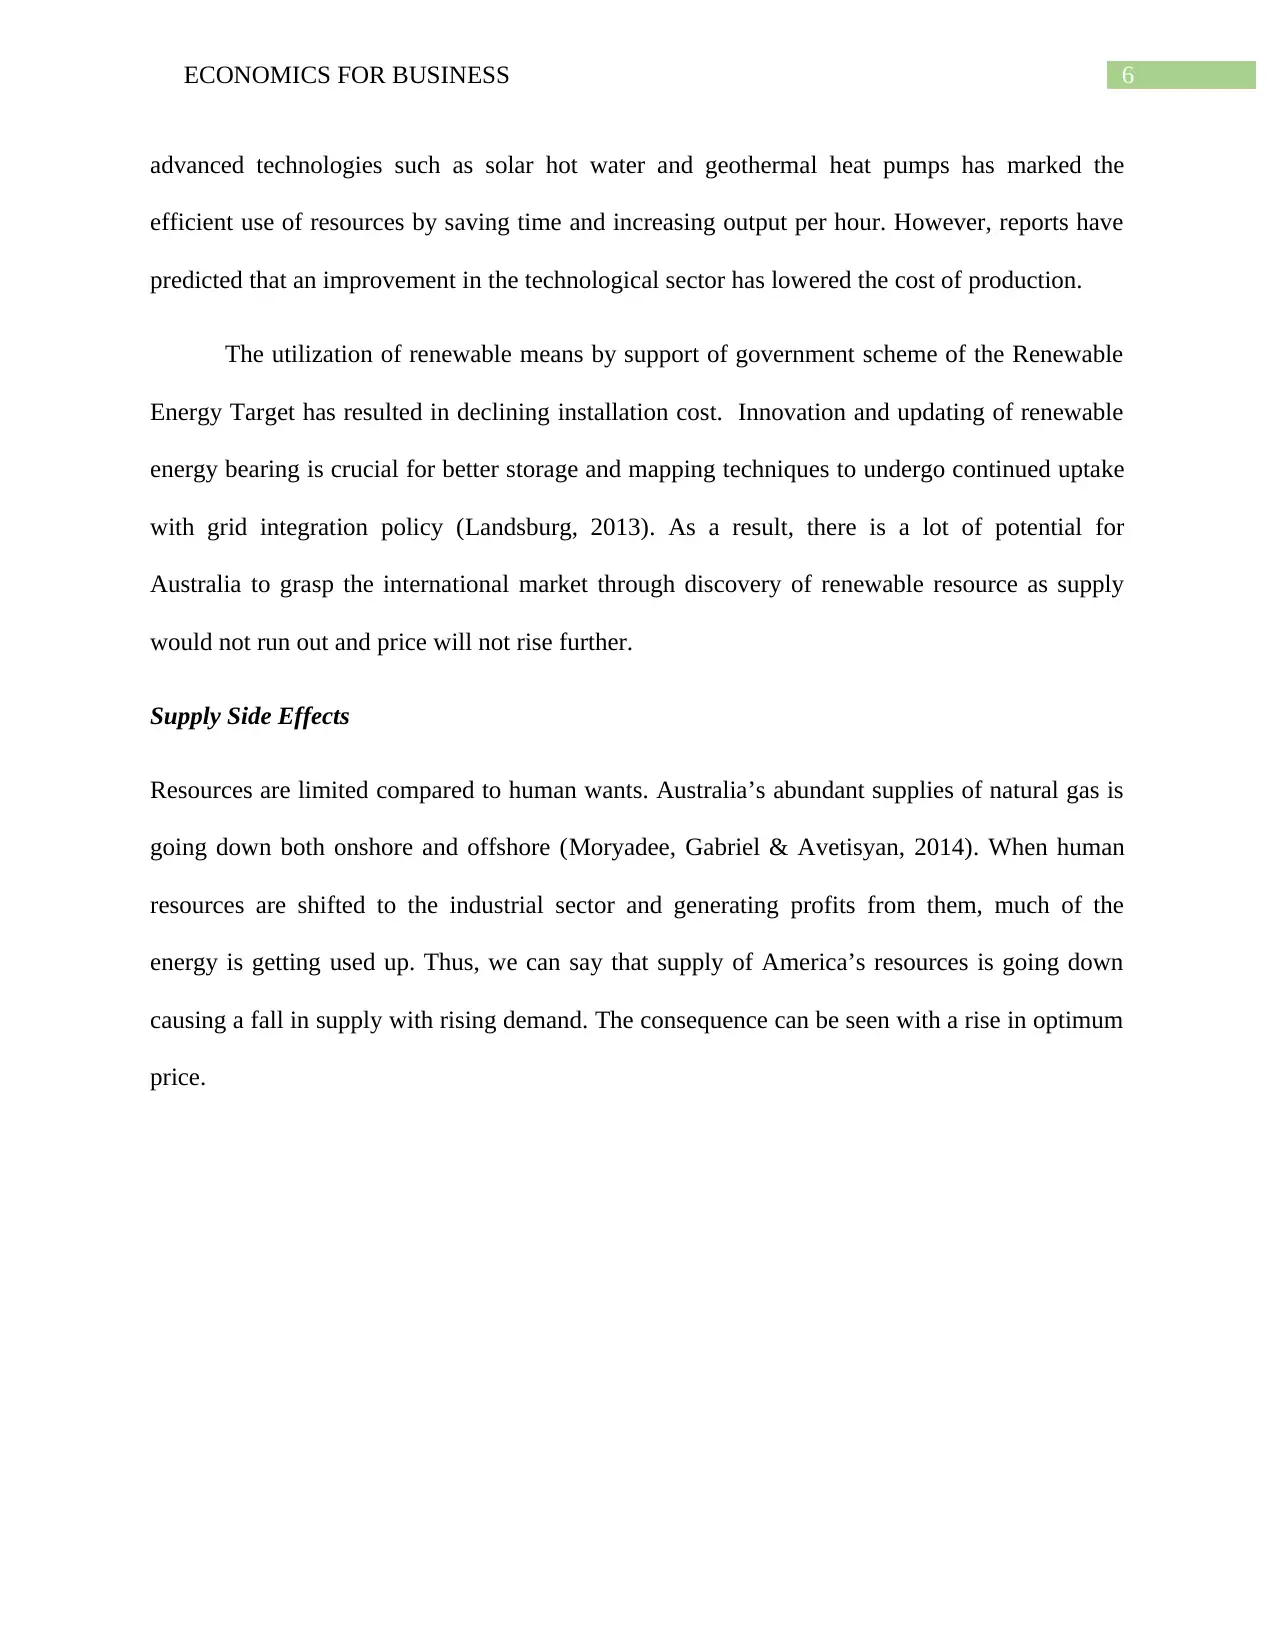
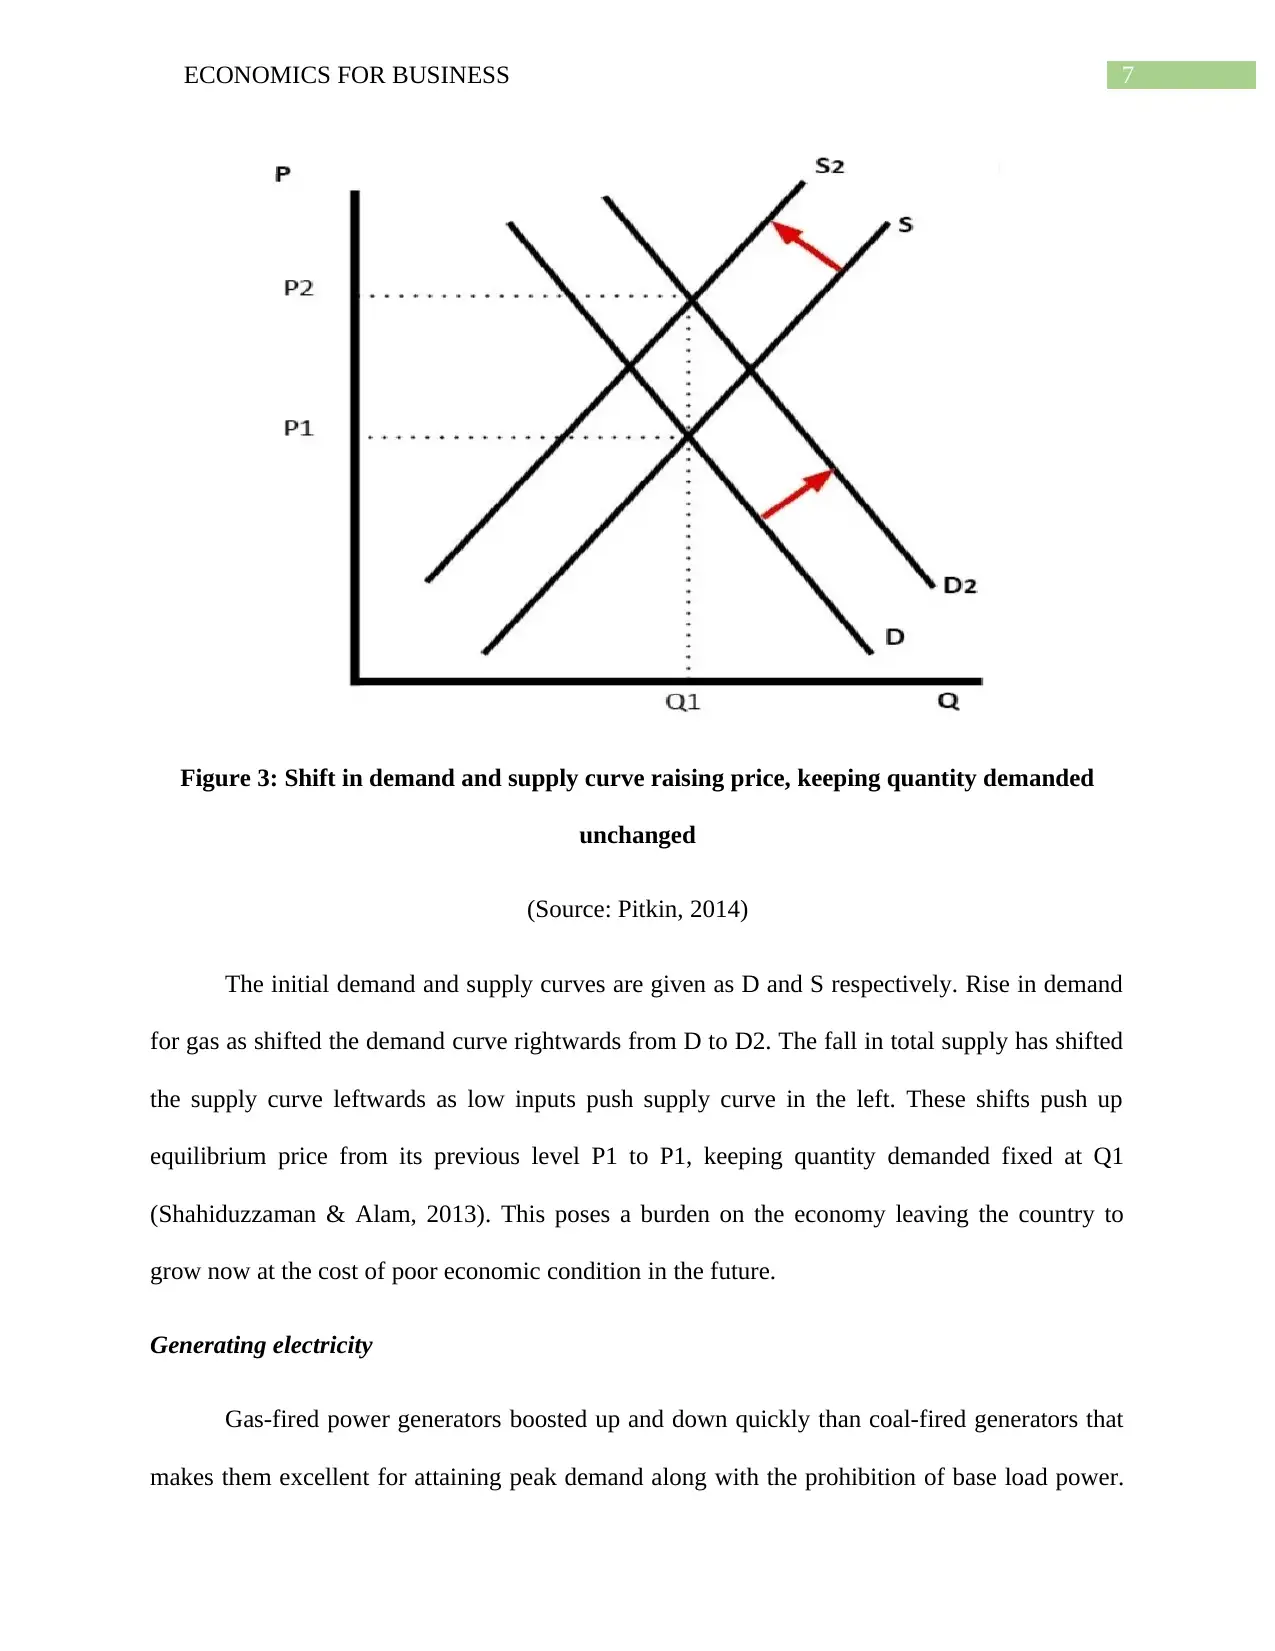
Figure 3: Shift in demand and supply curve raising price, keeping quantity demanded
unchanged
(Source: Pitkin, 2014)
The initial demand and supply curves are given as D and S respectively. Rise in demand
for gas as shifted the demand curve rightwards from D to D2. The fall in total supply has shifted
the supply curve leftwards as low inputs push supply curve in the left. These shifts push up
equilibrium price from its previous level P1 to P1, keeping quantity demanded fixed at Q1
(Shahiduzzaman & Alam, 2013). This poses a burden on the economy leaving the country to
grow now at the cost of poor economic condition in the future.
Generating electricity
Gas-fired power generators boosted up and down quickly than coal-fired generators that
makes them excellent for attaining peak demand along with the prohibition of base load power.
8ECONOMICS FOR BUSINESS
These skills are required for these generators for consumption of less land than what is required
in a coal-fired power plant creating identical energy output which requires limited time for
development. Carbon discharge from gas-fired power house is 50 to 60 per cent below the coal-
fired power (Wu, Li & Zhang, 2013).
In 2016-17, gas-fired generators supplied more than 50,459 Giga watt of electricity. The
level of operation of these energies went up. 20 per cent of Australia’s electricity was provided
from by natural gas in 2016-17. Natural gas is used to generate electricity in all States in
Australia, and it produces most of the electricity to meet peak demand.
The method of natural gas extraction varies from conventional and unconventional
sources. Although the gas that is produced has the same usage until lately the natural gas
extraction is done by fairly permeable stone making the work easier. In the past ten years, share
of gas from unconventional sources have risen.
Conclusion
We can conclude that Australia has undergone great changes in price of gas because of its
over rising demand to meet the supplies. The coast of Australia is facing a lack in energy inputs
to manage the supplies. The need for the hour is to provide with more coal seam gas
developments and production renewable energy using innovative approaches. Australia is
dealing with giant gas exporters to meet the export demand.
The high costs instigate inexplicable behaviour by exporters providing at low price
outside the country and charging excessively in domestic market. However, Australia is keen on
capturing the international market rather than keeping the domestic market secured. This is
⊘ This is a preview!⊘
Do you want full access?
Subscribe today to unlock all pages.
Trusted by 1+ million students worldwide
9ECONOMICS FOR BUSINESS
eventually leading the Australian gas market into great danger by increasing prices and lowering
the supply.
Answer 2
Introduction
Australia has a high demand for natural gas due to abundance of natural resources. The
availability of clean nature of fuel and geographic circulation generate an alternative to
renewable and coal pollutant. The new era has transformed the Liquefied Natural Gas (LNG) in a
global market. That has encouraged the development of the industry. The support of government
has been a crucial role in driving a huge amount of profits from other countries by specialization
of energy. This had motivated a lot of investors to come forward and gain from the businesses
(Bishop et al., 2013).
The world’s population is expected to reach 9.8 billion within upcoming 15-20 years.
With the growing population, demand for energy is on the rise. The standard of living is getting
higher in countries outstanding to massive upsurge in energy consumption. Australia is the third
largest producer and exporter of energy resources in the world and has the audacity to become
the leading exporter from its current designation (Cassidy & Kosev, 2015). Australia has the
potential to operate huge industries for having miles of coastline, wind energy and excess of
sunshine hours. 94 percent of Australia’s electricity generation comes from fossil fuels.
The country’s low population density, makes many regions totally isolated. This has an
advantage since it makes those energy islands cheaper to burn petroleum rather than connecting
them to grid. Having plenty of fossil fuel reserves induces factories to export coal. Australia
earned 40 billion dollar from coal exports in 2017. Due to huge aggregate demand and satisfy the
Paraphrase This Document
Need a fresh take? Get an instant paraphrase of this document with our AI Paraphraser
10ECONOMICS FOR BUSINESS
consumers, the government of Australia created an organization named Australian Domestic Gas
Security Mechanism (ADGSM) for securing the domestic market from exporting. This policy
was not properly followed although the industry has deliberately supplied cargoes from Western
to Eastern Australian areas as the usage has been rising in the land of Down Under (Cludius,
Forrest & MacGill, 2014).
Discussion
As estimated by the Australian Energy Market Commission in 2017 the annual average
electricity bill rose 100 dollars from the last year having 1576 dollars. The average charge rated
to 34.41 cents per kilowatt hour leading to an increase of 4 cents every year. Net export of
Australia’s energy has increased on an average of 7.8 percent over the past few years (Coşar &
Fajgelbaum, 2016).
Trends in Price of Energy
The industrial sector requires most of the electricity for operating machinery, computers,
lights, motors, cooling, heating and ventilation of equipment. Electricity acts as the most
important input for the production of goods in heavy industries. Without electricity, nothing can
be operated (Faccarello & Kurz, 2016). This resulted price of electricity to undergo a quantitative
change in the last five years. Service of electricity generation is reported to have gone up at an
annual rate of 3.3 percent in 2017-18. This rising price of domestic natural energy has boosted
operation costs at gas-fired stations. Hazel Power Station provides coal-fired gas, has a
decommissioning stature due to increased demand for coal-fired power stations.
Industries having the power to pass coast into steam down business gain maximum
welfare by breakthrough of revenues. Yet, this growth has a negative impact on other companies
11ECONOMICS FOR BUSINESS
who depend on energy inputs, experience immense import competition and end up by producing
homogenous products (Gutowski et al., 2013). Heavy industries such as the Petroleum Fuel
Manufacturing, Petroleum Refining, Iron and Steel Smelting industry incurred huge production
cost and were not able to pass on to downstream markets.
The Iron Smelting and Steel Manufacturing industry’s earnings reduced to 10.3 billion
approximately, at a rate of 1.8 percent starting from 2015. The refining companies of petroleum
saw a drastic fall of 15.6 percent of its revenue estimating to 16.5 billion within just five years.
Arousal of strong import competition has limited producers’ ability to raise the prices.
Chemical companies use enormous capacities of electricity units for generation of input
machines for activation purpose. The plastic and chemical industry was imposed with a loss over
13.7 billion due to consumption of excess electricity. Manufacturers and producers are forced to
ingest higher cost since 2012 (Hatfield-Dodds et al., 2015).
Specialization Gain
International trade makes countries better off. Scarcity arises when there is unlimited
wants and limited resources. When countries specialize among themselves, the countries are
expected to gain from trade. Specialization benefits countries with huge demand, generation of
profits, and improved quality of goods, competition and low opportunity cost. When America
source energy for other countries, America and its exporting countries are better off. Generally,
imports from other countries are preferred due to its inexpensive nature and better quality.
Unavailability of close substitutes makes the country to influence the market. However, supply
cannot be increased over night and demand is constantly going up. This raises the cost of
production (Hatfield-Dodds, 2015).
⊘ This is a preview!⊘
Do you want full access?
Subscribe today to unlock all pages.
Trusted by 1+ million students worldwide
1 out of 20
Related Documents


Your All-in-One AI-Powered Toolkit for Academic Success.
+13062052269
info@desklib.com
Available 24*7 on WhatsApp / Email
![[object Object]](/_next/static/media/star-bottom.7253800d.svg)
Unlock your academic potential
Copyright © 2020–2026 A2Z Services. All Rights Reserved. Developed and managed by ZUCOL.