Analysis of GDP Per Capita and Life Satisfaction in OECD Countries

Verified

Added on  2022/08/13

|11
|1618
|21
Report
AI Summary
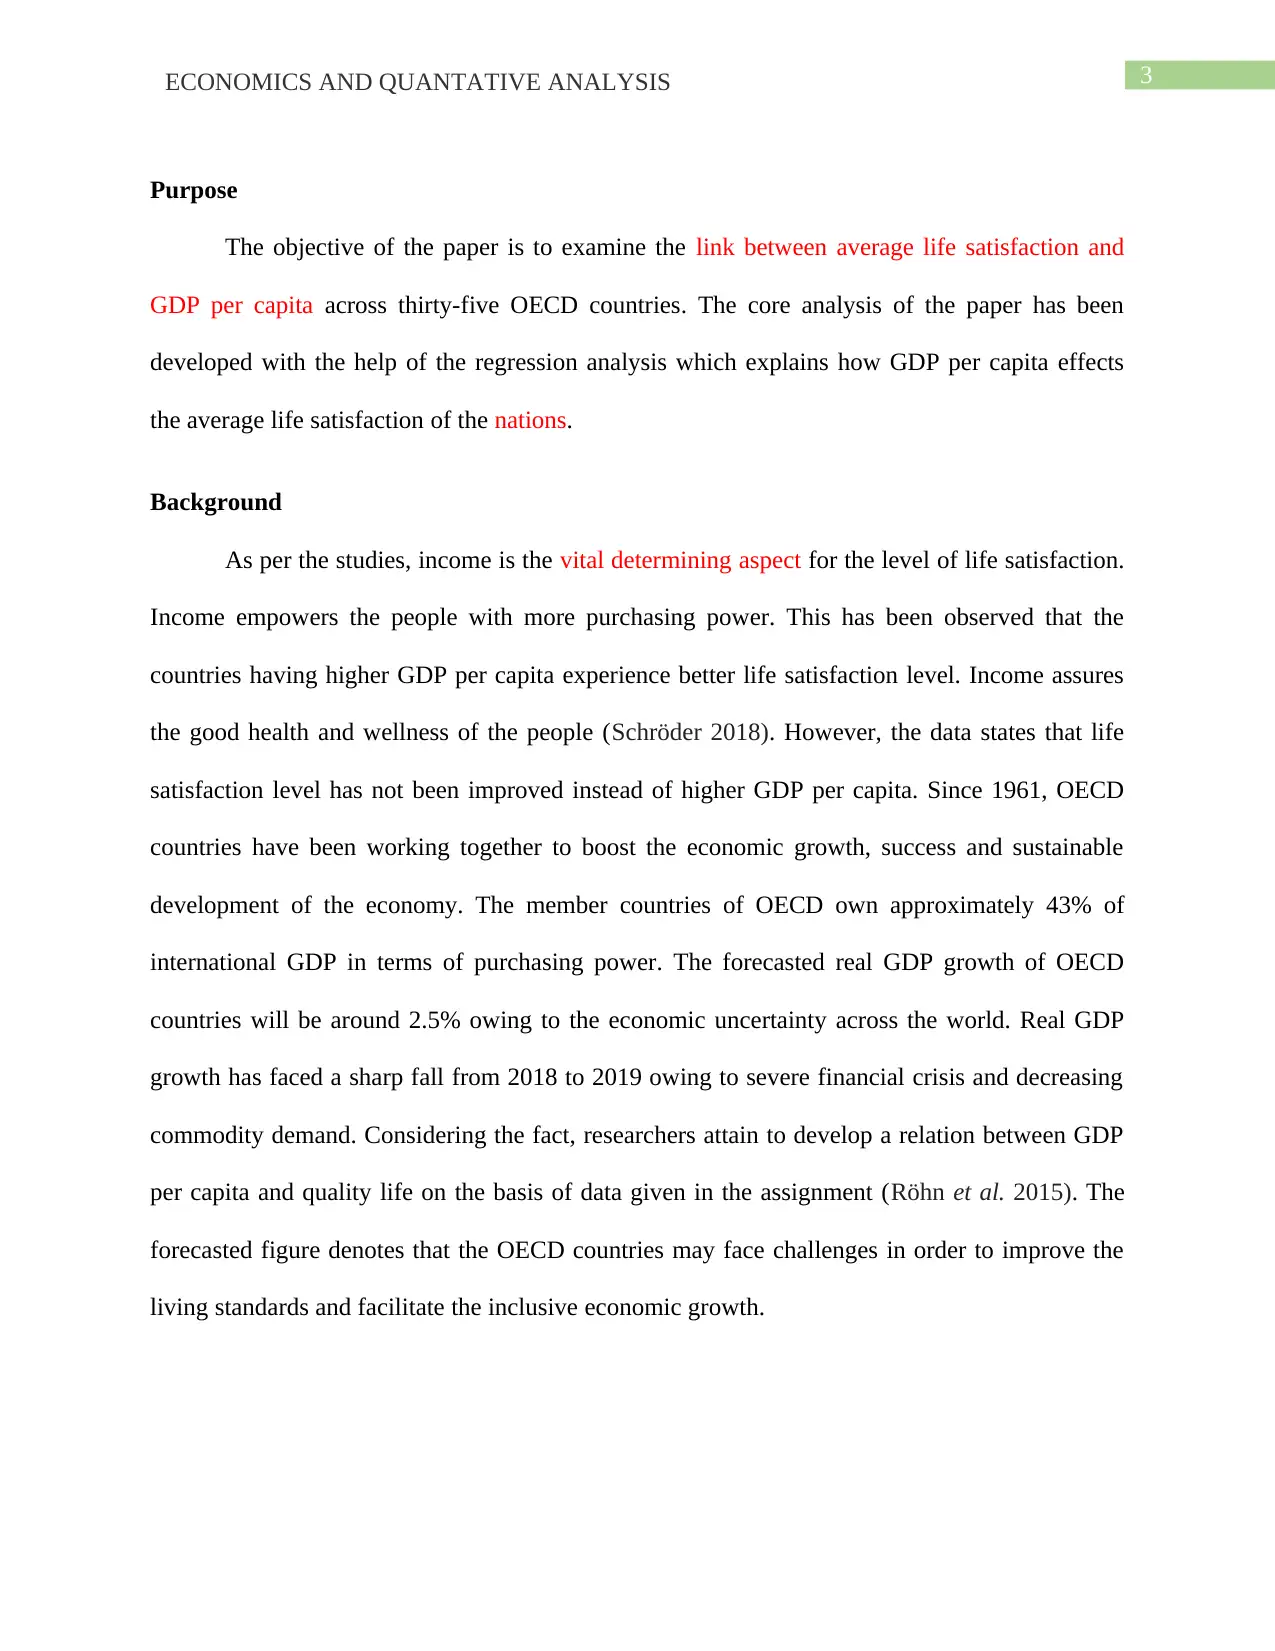
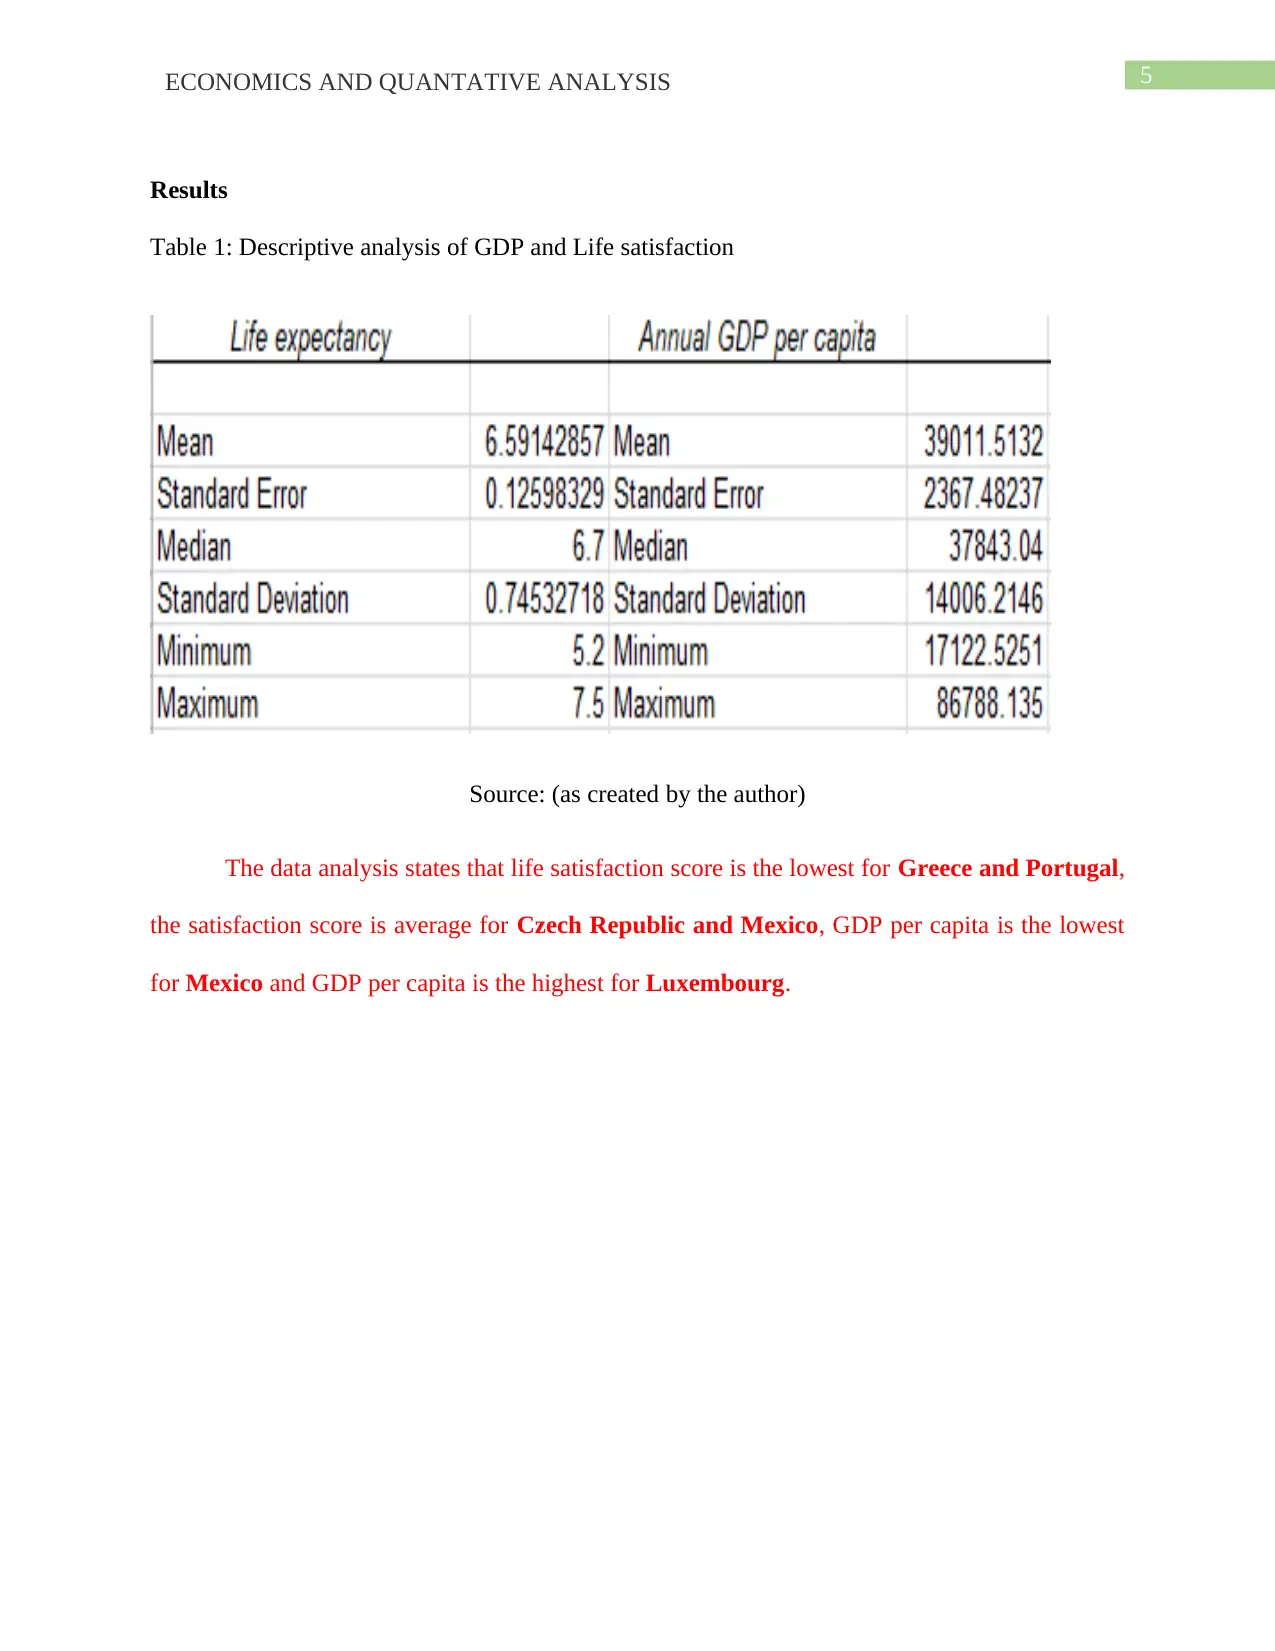
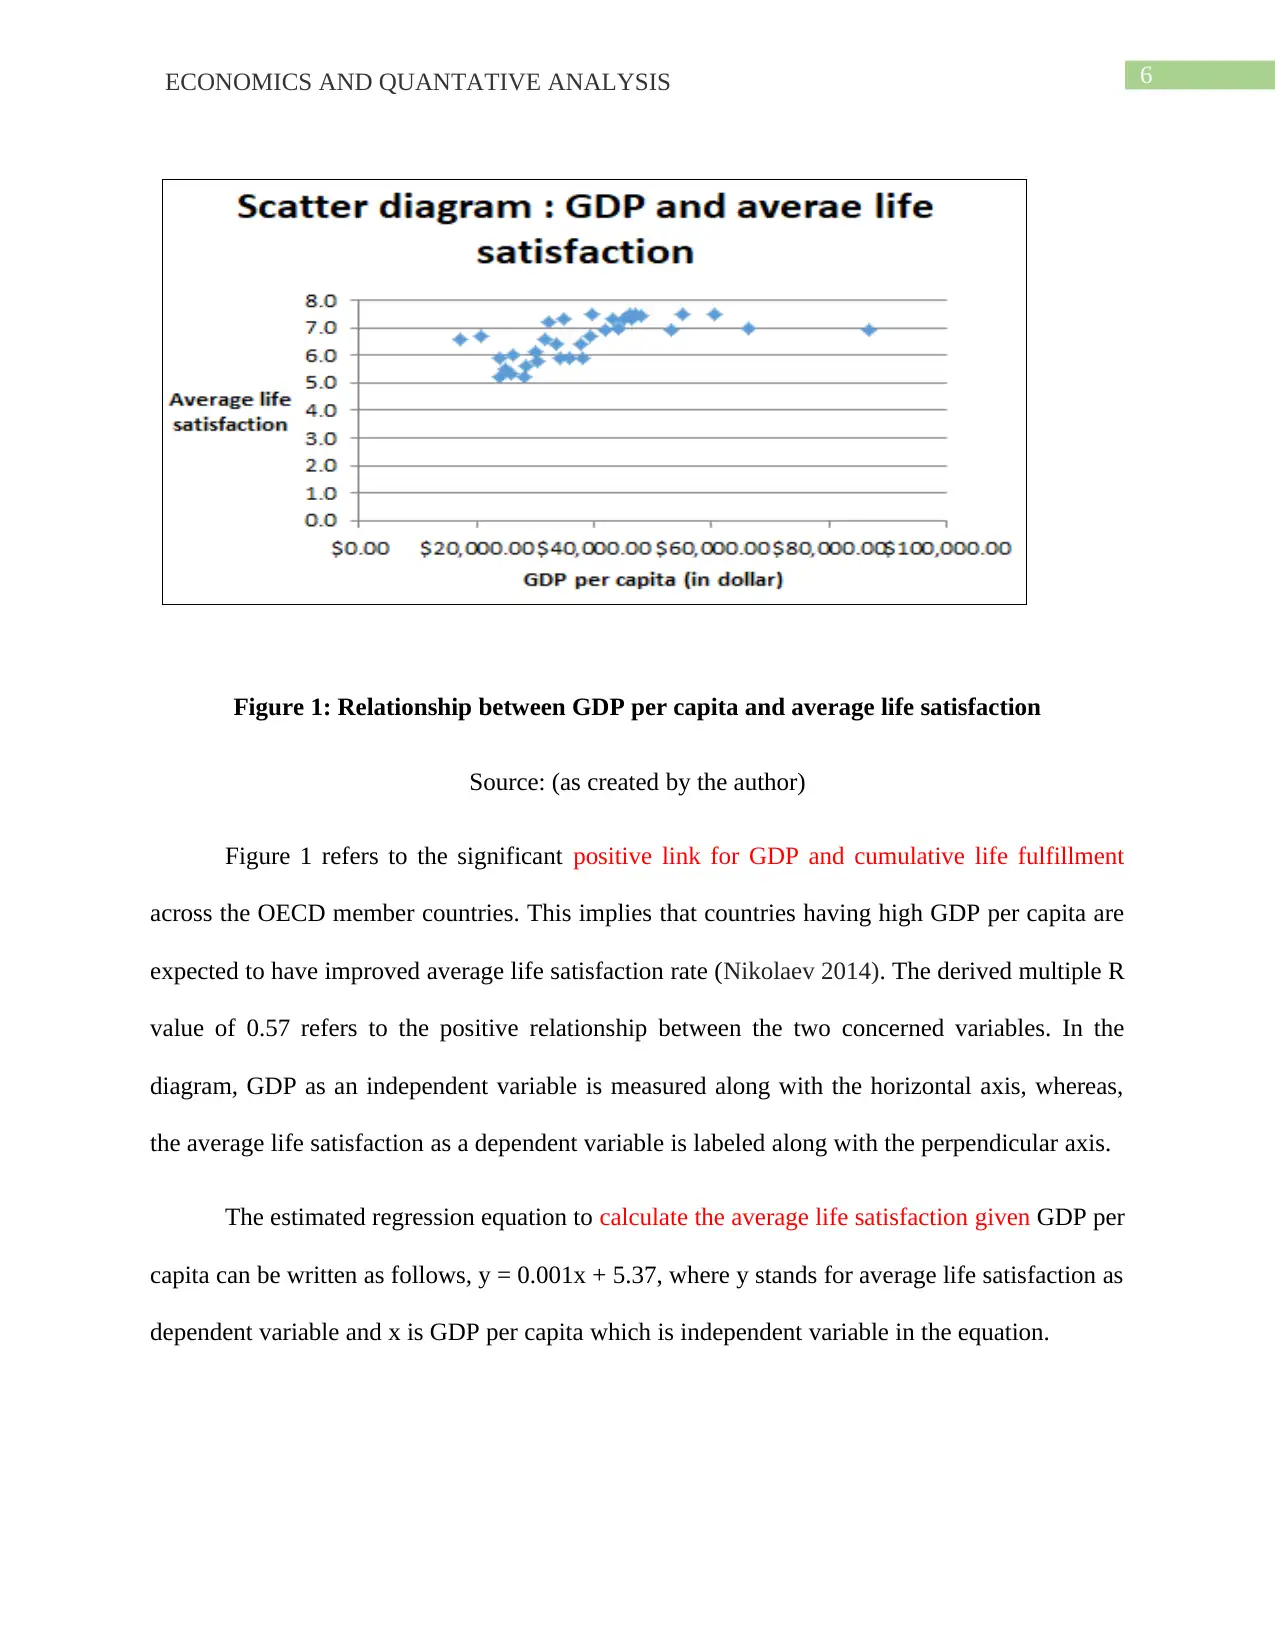
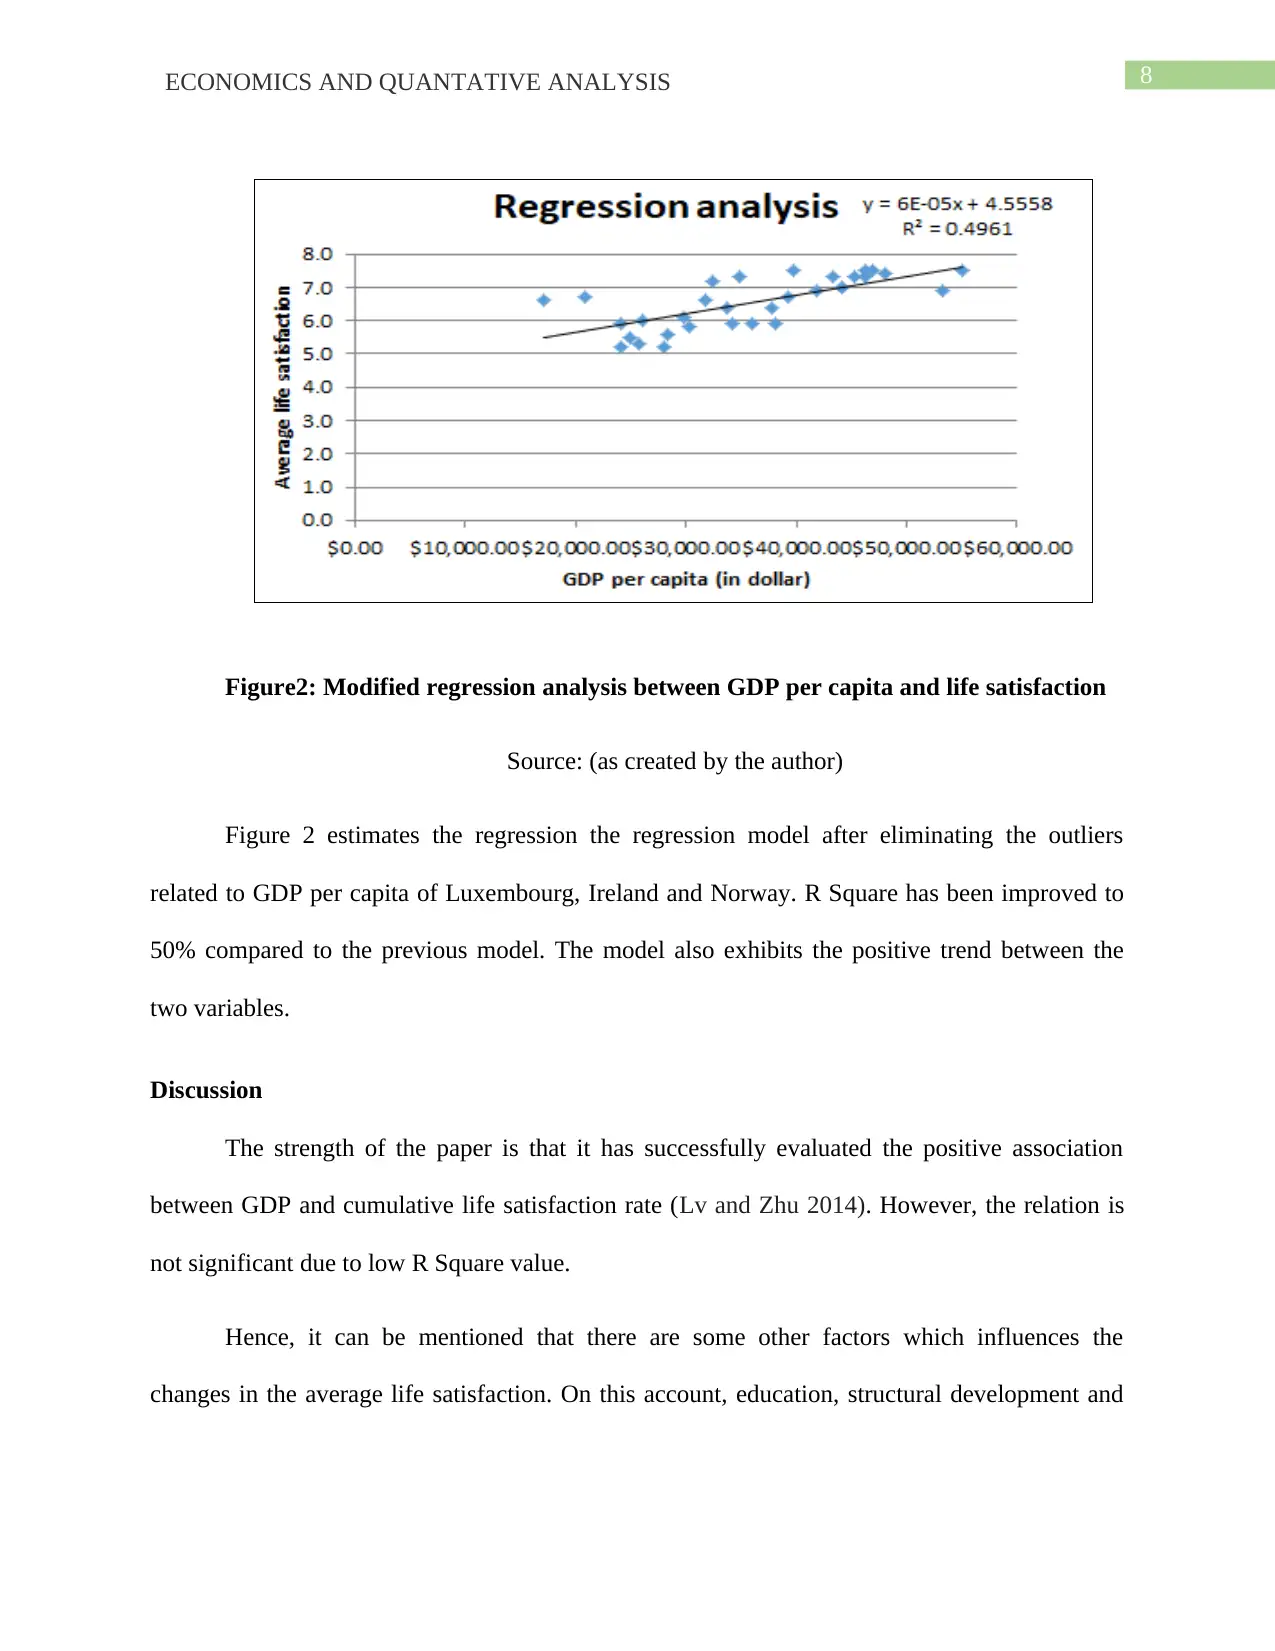
This report analyzes the relationship between GDP per capita and average life satisfaction across thirty-five OECD countries using regression analysis. The study aims to determine how GDP per capita affects life satisfaction. The background section includes a brief literature review on the association between life satisfaction and GDP, emphasizing the economists' interest in this issue. The method section details the data source and the empirical approach used. The results section provides a descriptive analysis of the two variables, including the mean, standard deviation, minimum, and maximum values, and identifies countries with the lowest and average life satisfaction scores. It also presents and summarizes the results from the statistical analysis, including the regression equation and the goodness of fit. The discussion section evaluates the positive association between GDP and life satisfaction, while also acknowledging that the relationship is not significant due to the low R-squared value. The report concludes with recommendations for OECD member countries to promote sustainable economic growth, control inflation, and ensure equitable wealth distribution. The report highlights the importance of structural development, welfare programs, and financial stability in improving citizens' living standards and overall well-being.
Document Page
Running head: ECONOMICS AND QUANTATIVE ANALYSIS
Economics and Quantitative Analysis
Name of the Student
Name of the University
Author Note
tabler-icon-diamond-filled.svg

Secure Best Marks with AI Grader

Need help grading? Try our AI Grader for instant feedback on your assignments.
Document Page
1ECONOMICS AND QUANTATIVE ANALYSIS
Executive Summary
The paper is aimed at analyzing the relationship between two parameters which are GDP per
capita and average life satisfaction. These two variables have been studied across thirty five
OECD countries. The paper has incorporated the regression analysis to examine the linear
relationship between the two variables. The paper has initially attempted to describe the purpose
of the study followed by some effective recommendations to study the association between
income and life satisfaction.
Document Page
2ECONOMICS AND QUANTATIVE ANALYSIS
Table of Contents
Purpose............................................................................................................................................3
Background......................................................................................................................................3
Method.............................................................................................................................................4
Results..............................................................................................................................................5
Discussion........................................................................................................................................8
Recommendations............................................................................................................................9
Reference list.................................................................................................................................10
Document Page
3ECONOMICS AND QUANTATIVE ANALYSIS
Purpose
The objective of the paper is to examine the link between average life satisfaction and
GDP per capita across thirty-five OECD countries. The core analysis of the paper has been
developed with the help of the regression analysis which explains how GDP per capita effects
the average life satisfaction of the nations.
Background
As per the studies, income is the vital determining aspect for the level of life satisfaction.
Income empowers the people with more purchasing power. This has been observed that the
countries having higher GDP per capita experience better life satisfaction level. Income assures
the good health and wellness of the people (Schröder 2018). However, the data states that life
satisfaction level has not been improved instead of higher GDP per capita. Since 1961, OECD
countries have been working together to boost the economic growth, success and sustainable
development of the economy. The member countries of OECD own approximately 43% of
international GDP in terms of purchasing power. The forecasted real GDP growth of OECD
countries will be around 2.5% owing to the economic uncertainty across the world. Real GDP
growth has faced a sharp fall from 2018 to 2019 owing to severe financial crisis and decreasing
commodity demand. Considering the fact, researchers attain to develop a relation between GDP
per capita and quality life on the basis of data given in the assignment (Röhn et al. 2015). The
forecasted figure denotes that the OECD countries may face challenges in order to improve the
living standards and facilitate the inclusive economic growth.
tabler-icon-diamond-filled.svg

Secure Best Marks with AI Grader

Need help grading? Try our AI Grader for instant feedback on your assignments.
Document Page
4ECONOMICS AND QUANTATIVE ANALYSIS
Method
This section highlights the empirical approach of the study. This analysis is applied as to
predict the correlation between two variables, GDP per capita and life contentment level. Here,
GDP per capita is reflected as an independent variable, whereas, the life expectancy is termed as
a dependent variable. The detailed summary report derived using the Excel tool explains how the
predicted variables are good fitted into the regression line. Value of R square mentions how
much variability in the predicted variables has been explained by the explained variables. The
higher R squared value the better explanation of the model. The other statistical parameter is p-
value which decides whether the null hypothesis is accurate. A lower p-value (typically less than
0.05) is statistically significant implying that there is stronger evidence in favor of the null
hypothesis. The model will not agree with the alternative hypothesis. Along with that role of t-
statistic is the key determining factor to examine the effectiveness of the null hypothesis. If t-
value is scored at 0, the null hypothesis will be exact with the sample value (Proto and Rustichini
2015). The higher t-value refers to considerable difference between population mean from the
sample mean, which in turn, explains the variation of the model. The degree of association
between two parameters gets reflected the value of Multiple R. The positive value denotes the
positive relationship between the dependent and independent variable.
Document Page
5ECONOMICS AND QUANTATIVE ANALYSIS
Results
Table 1: Descriptive analysis of GDP and Life satisfaction
Source: (as created by the author)
The data analysis states that life satisfaction score is the lowest for Greece and Portugal,
the satisfaction score is average for Czech Republic and Mexico, GDP per capita is the lowest
for Mexico and GDP per capita is the highest for Luxembourg.
Document Page
6ECONOMICS AND QUANTATIVE ANALYSIS
Figure 1: Relationship between GDP per capita and average life satisfaction
Source: (as created by the author)
Figure 1 refers to the significant positive link for GDP and cumulative life fulfillment
across the OECD member countries. This implies that countries having high GDP per capita are
expected to have improved average life satisfaction rate (Nikolaev 2014). The derived multiple R
value of 0.57 refers to the positive relationship between the two concerned variables. In the
diagram, GDP as an independent variable is measured along with the horizontal axis, whereas,
the average life satisfaction as a dependent variable is labeled along with the perpendicular axis.
The estimated regression equation to calculate the average life satisfaction given GDP per
capita can be written as follows, y = 0.001x + 5.37, where y stands for average life satisfaction as
dependent variable and x is GDP per capita which is independent variable in the equation.
tabler-icon-diamond-filled.svg

Paraphrase This Document

Need a fresh take? Get an instant paraphrase of this document with our AI Paraphraser
Document Page
7ECONOMICS AND QUANTATIVE ANALYSIS
Here the slope of coefficient is too small to derive a significant positive relationship
between the two variables. The coefficient value of 0.001 (approximately) seems like 0 which
does not imply any substantial relationship between GDP and life satisfaction.
The estimated outcome is statistically significant as p-value is less than 0.05. Therefore,
GDP per can be inferred as an important determining factor to predict the fluctuation in the
average life satisfaction level (Durand 2015).
Goodness of fit measures the dispersion between the observed values and the expected
values. It can be determined by the value of R Square which is 0.33 in this analysis. This denotes
that the goodness of fit is not significant. The positive value signifies that two variables are
related but the association is not strong.
Document Page
8ECONOMICS AND QUANTATIVE ANALYSIS
Figure2: Modified regression analysis between GDP per capita and life satisfaction
Source: (as created by the author)
Figure 2 estimates the regression the regression model after eliminating the outliers
related to GDP per capita of Luxembourg, Ireland and Norway. R Square has been improved to
50% compared to the previous model. The model also exhibits the positive trend between the
two variables.
Discussion
The strength of the paper is that it has successfully evaluated the positive association
between GDP and cumulative life satisfaction rate (Lv and Zhu 2014). However, the relation is
not significant due to low R Square value.
Hence, it can be mentioned that there are some other factors which influences the
changes in the average life satisfaction. On this account, education, structural development and
Document Page
9ECONOMICS AND QUANTATIVE ANALYSIS
health can be considered as independent variables along with GDP per capita to determine the
life satisfaction across the OECD countries (Cassiers and Thiry 2014).
These findings have some clear policy implications in terms of government intervention.
This will assure that the average life satisfaction will be improved if GDP per capita increase.
Recommendations
1. OECD member countries should emphasize on the structural development program to support
the sustainable economic growth (Brooks 2014).
2. Inflation rate must be controlled to enhance the real purchasing power of the people.
Increasing inflation rate lowers real GDP of the economy.
3. The benefit of the welfare program must be reached to every citizen. This may lead to the
better living standard for the people.
4. The financial stability needs to be maintained to counter the growing financial challenges in
the international economy.
5. The disparity in the wealth distribution must be discouraged as to boost the equal wealth
distribution process.
tabler-icon-diamond-filled.svg

Secure Best Marks with AI Grader

Need help grading? Try our AI Grader for instant feedback on your assignments.
Document Page
10ECONOMICS AND QUANTATIVE ANALYSIS
Reference list
Brooks, J., 2014. Policy coherence and food security: The effects of OECD countries’
agricultural policies. Food Policy, 44, pp.88-94.
Cassiers, I. and Thiry, G., 2014. A high-stakes shift: Turning the tide from GDP to new
prosperity indicators. Redefining prosperity. London: Routledge.
Durand, M., 2015. The OECD better life initiative: How's life? and the measurement of well‐
being. Review of Income and Wealth, 61(1), pp.4-17.
Lv, Z. and Zhu, H., 2014. Health care expenditure and GDP in African countries: evidence from
semiparametric estimation with panel data. The Scientific World Journal, 2014.
Nikolaev, B., 2014. Economic freedom and quality of life: Evidence from the OECD’s Your
Better Life Index. Journal of Private Enterprise, 29(3), pp.61-96.
Proto, E. and Rustichini, A., 2015. Life satisfaction, income and personality. Journal of
Economic Psychology, 48, pp.17-32.
Röhn, O., Sánchez, A.C., Hermansen, M. and Rasmussen, M., 2015. Economic resilience: A new
set of vulnerability indicators for OECD countries.
Schröder, M., 2018. Income inequality and life satisfaction: Unrelated between countries,
associated within countries over time. Journal of Happiness Studies, 19(4), pp.1021-1043.
chevron_up_icon
1 out of 11
circle_padding
hide_on_mobile
zoom_out_icon
logo.png

Your All-in-One AI-Powered Toolkit for Academic Success.

Available 24*7 on WhatsApp / Email

[object Object]