Report: Australian GDP Components and Wage Growth Analysis
VerifiedAdded on 2022/12/27
|13
|2765
|98
Report
AI Summary
This economics report presents an analysis of the Australian economy, focusing on the components of Gross Domestic Product (GDP) and wage growth trends. The report begins with an examination of GDP components, including consumption, investment, government expenditure, and net exports, using data from the Australian Bureau of Statistics. The data is presented in both raw and per capita terms, with graphical representations illustrating trends over time. The report then shifts its focus to wage growth, discussing factors such as productivity, inflation expectations, and the labor market. It explores the reasons behind low wage growth in Australia, including slack in the labor market, globalization, and declining union influence. The report uses figures to illustrate key concepts, such as the relationship between aggregate demand and real wage growth and the Phillips curve illustrating the inverse relationship between wage growth and unemployment. The report concludes by suggesting government interventions to address low wage growth, including policies to boost labor productivity, increase the minimum wage, and achieve full employment. Overall, the report provides a comprehensive overview of the economic issues in Australia, including GDP and wage dynamics.

Running head: ECONOMICS
Economics
Name of the student
Name of the university
Author note
Economics
Name of the student
Name of the university
Author note
Paraphrase This Document
Need a fresh take? Get an instant paraphrase of this document with our AI Paraphraser
ECONOMICS
Answer 1
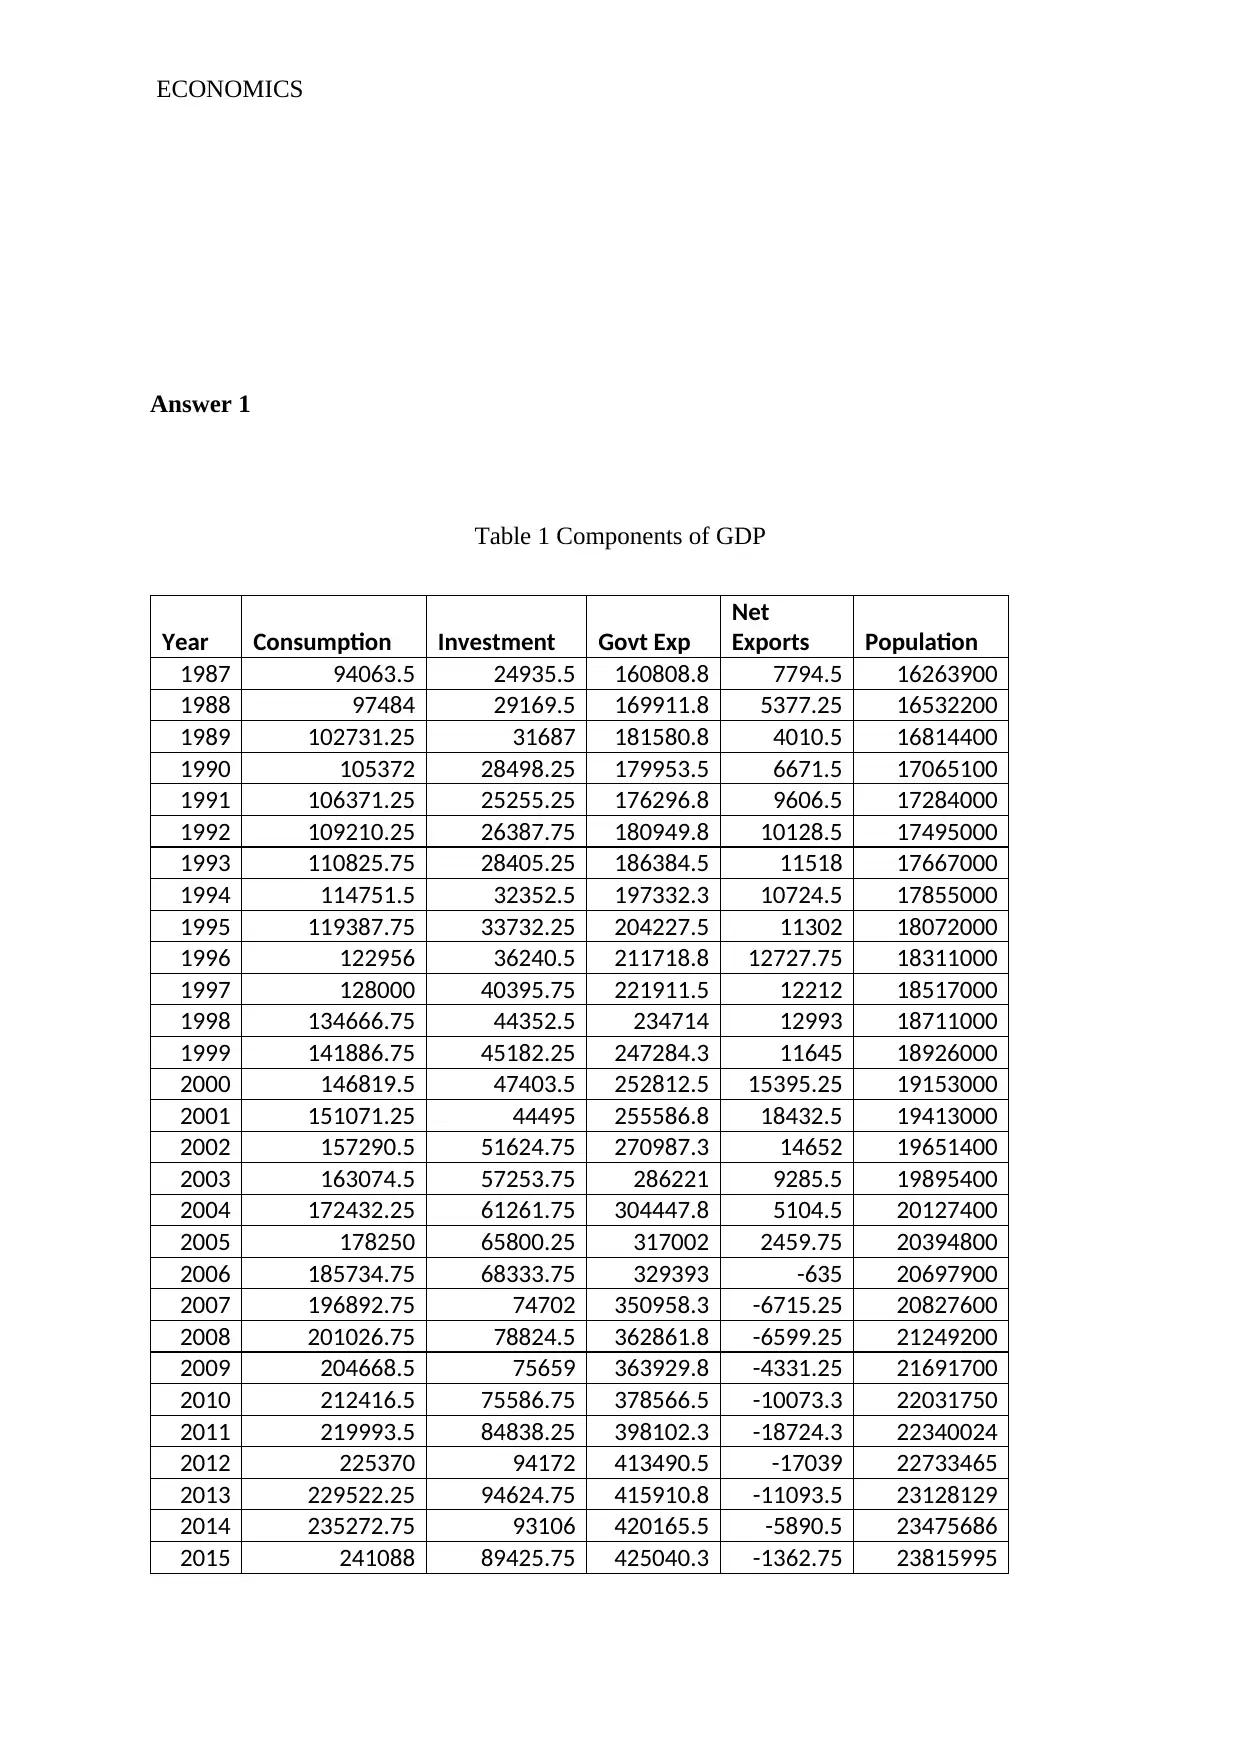
Table 1 Components of GDP
Year Consumption Investment Govt Exp
Net
Exports Population
1987 94063.5 24935.5 160808.8 7794.5 16263900
1988 97484 29169.5 169911.8 5377.25 16532200
1989 102731.25 31687 181580.8 4010.5 16814400
1990 105372 28498.25 179953.5 6671.5 17065100
1991 106371.25 25255.25 176296.8 9606.5 17284000
1992 109210.25 26387.75 180949.8 10128.5 17495000
1993 110825.75 28405.25 186384.5 11518 17667000
1994 114751.5 32352.5 197332.3 10724.5 17855000
1995 119387.75 33732.25 204227.5 11302 18072000
1996 122956 36240.5 211718.8 12727.75 18311000
1997 128000 40395.75 221911.5 12212 18517000
1998 134666.75 44352.5 234714 12993 18711000
1999 141886.75 45182.25 247284.3 11645 18926000
2000 146819.5 47403.5 252812.5 15395.25 19153000
2001 151071.25 44495 255586.8 18432.5 19413000
2002 157290.5 51624.75 270987.3 14652 19651400
2003 163074.5 57253.75 286221 9285.5 19895400
2004 172432.25 61261.75 304447.8 5104.5 20127400
2005 178250 65800.25 317002 2459.75 20394800
2006 185734.75 68333.75 329393 -635 20697900
2007 196892.75 74702 350958.3 -6715.25 20827600
2008 201026.75 78824.5 362861.8 -6599.25 21249200
2009 204668.5 75659 363929.8 -4331.25 21691700
2010 212416.5 75586.75 378566.5 -10073.3 22031750
2011 219993.5 84838.25 398102.3 -18724.3 22340024
2012 225370 94172 413490.5 -17039 22733465
2013 229522.25 94624.75 415910.8 -11093.5 23128129
2014 235272.75 93106 420165.5 -5890.5 23475686
2015 241088 89425.75 425040.3 -1362.75 23815995
Answer 1
Table 1 Components of GDP
Year Consumption Investment Govt Exp
Net
Exports Population
1987 94063.5 24935.5 160808.8 7794.5 16263900
1988 97484 29169.5 169911.8 5377.25 16532200
1989 102731.25 31687 181580.8 4010.5 16814400
1990 105372 28498.25 179953.5 6671.5 17065100
1991 106371.25 25255.25 176296.8 9606.5 17284000
1992 109210.25 26387.75 180949.8 10128.5 17495000
1993 110825.75 28405.25 186384.5 11518 17667000
1994 114751.5 32352.5 197332.3 10724.5 17855000
1995 119387.75 33732.25 204227.5 11302 18072000
1996 122956 36240.5 211718.8 12727.75 18311000
1997 128000 40395.75 221911.5 12212 18517000
1998 134666.75 44352.5 234714 12993 18711000
1999 141886.75 45182.25 247284.3 11645 18926000
2000 146819.5 47403.5 252812.5 15395.25 19153000
2001 151071.25 44495 255586.8 18432.5 19413000
2002 157290.5 51624.75 270987.3 14652 19651400
2003 163074.5 57253.75 286221 9285.5 19895400
2004 172432.25 61261.75 304447.8 5104.5 20127400
2005 178250 65800.25 317002 2459.75 20394800
2006 185734.75 68333.75 329393 -635 20697900
2007 196892.75 74702 350958.3 -6715.25 20827600
2008 201026.75 78824.5 362861.8 -6599.25 21249200
2009 204668.5 75659 363929.8 -4331.25 21691700
2010 212416.5 75586.75 378566.5 -10073.3 22031750
2011 219993.5 84838.25 398102.3 -18724.3 22340024
2012 225370 94172 413490.5 -17039 22733465
2013 229522.25 94624.75 415910.8 -11093.5 23128129
2014 235272.75 93106 420165.5 -5890.5 23475686
2015 241088 89425.75 425040.3 -1362.75 23815995
ECONOMICS
2016 247494 84531.25 433413 2116.25 24190907
2017 253600.75 85857.5 445235.5 -737.25 24601860
2018 260202 88527.75 459286.8 25544.5 25000000
Source: ("Australian Bureau of Statistics, Australian Government", 2019)
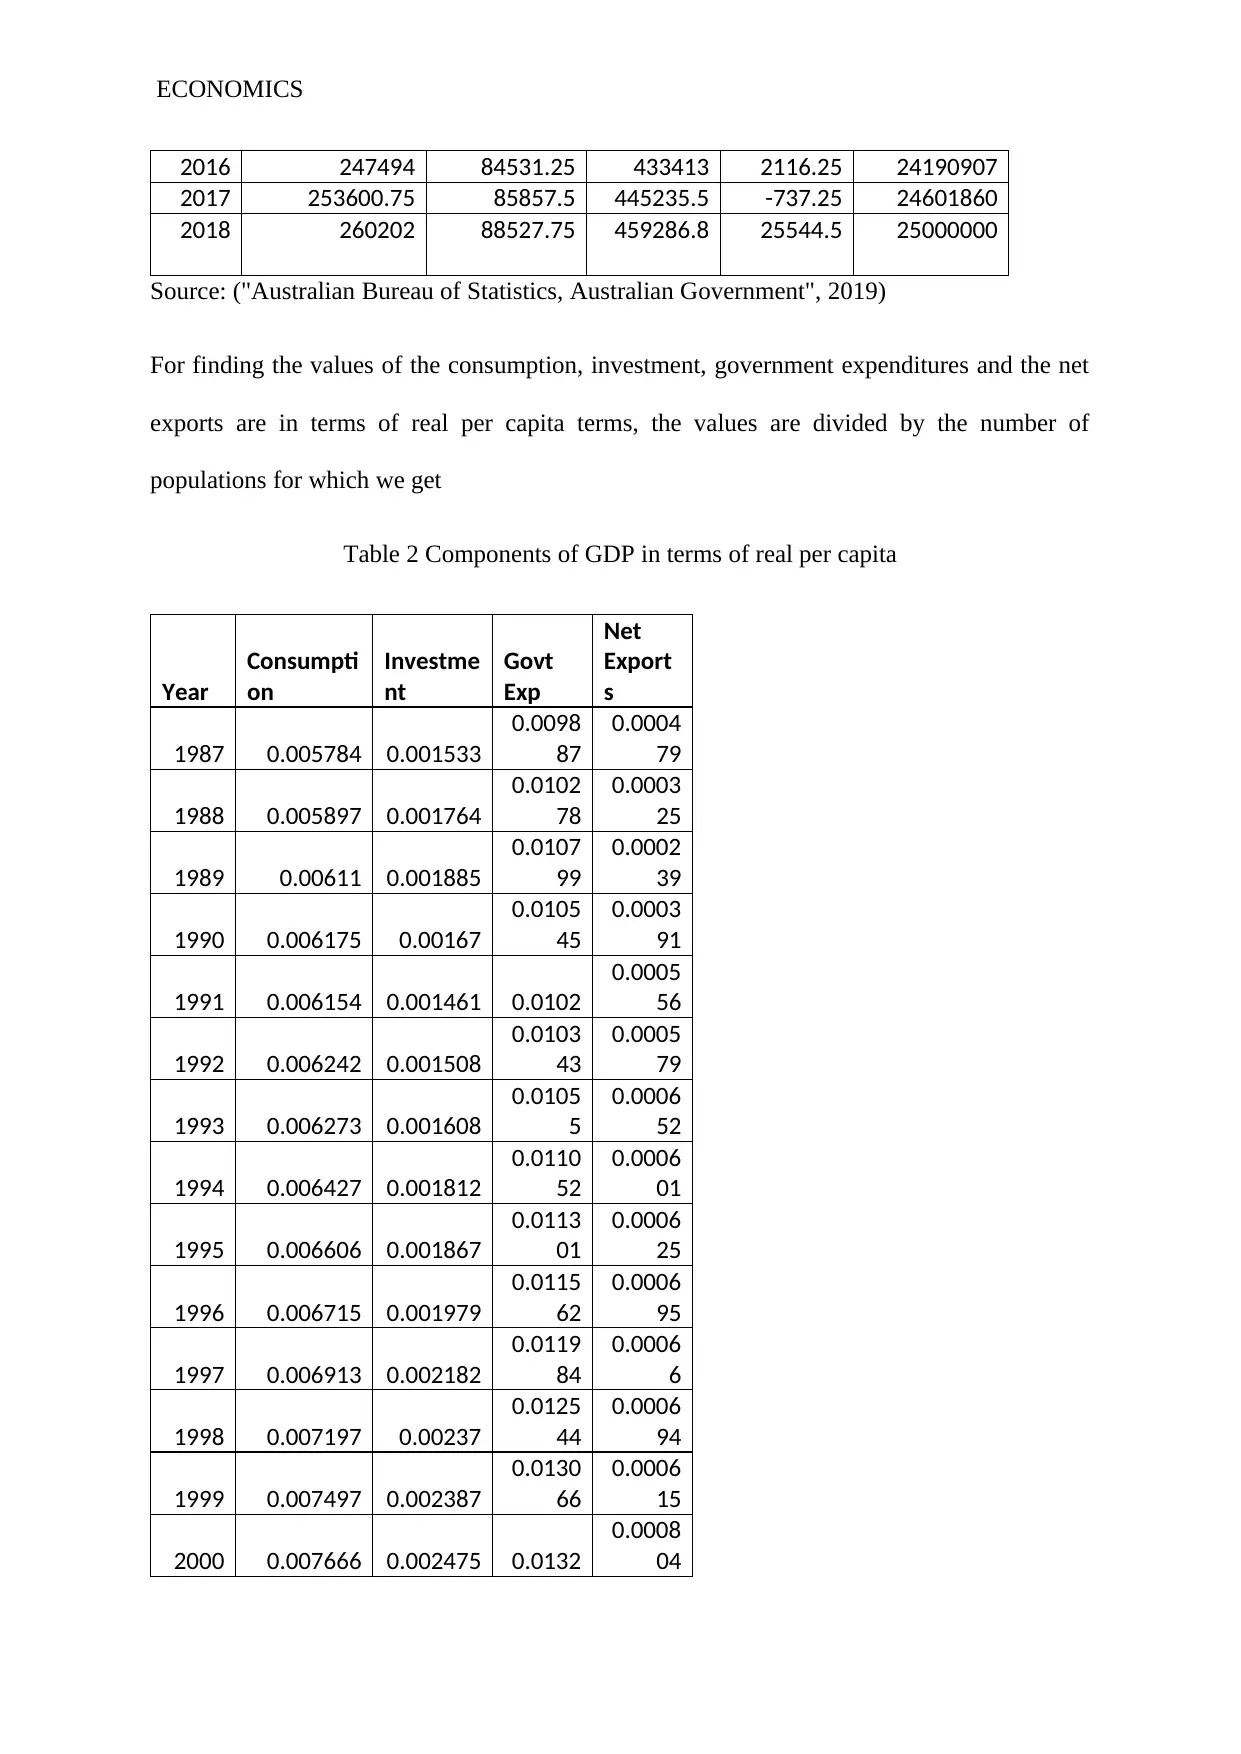
For finding the values of the consumption, investment, government expenditures and the net
exports are in terms of real per capita terms, the values are divided by the number of
populations for which we get
Table 2 Components of GDP in terms of real per capita
Year
Consumpti
on
Investme
nt
Govt
Exp
Net
Export
s
1987 0.005784 0.001533
0.0098
87
0.0004
79
1988 0.005897 0.001764
0.0102
78
0.0003
25
1989 0.00611 0.001885
0.0107
99
0.0002
39
1990 0.006175 0.00167
0.0105
45
0.0003
91
1991 0.006154 0.001461 0.0102
0.0005
56
1992 0.006242 0.001508
0.0103
43
0.0005
79
1993 0.006273 0.001608
0.0105
5
0.0006
52
1994 0.006427 0.001812
0.0110
52
0.0006
01
1995 0.006606 0.001867
0.0113
01
0.0006
25
1996 0.006715 0.001979
0.0115
62
0.0006
95
1997 0.006913 0.002182
0.0119
84
0.0006
6
1998 0.007197 0.00237
0.0125
44
0.0006
94
1999 0.007497 0.002387
0.0130
66
0.0006
15
2000 0.007666 0.002475 0.0132
0.0008
04
2016 247494 84531.25 433413 2116.25 24190907
2017 253600.75 85857.5 445235.5 -737.25 24601860
2018 260202 88527.75 459286.8 25544.5 25000000
Source: ("Australian Bureau of Statistics, Australian Government", 2019)
For finding the values of the consumption, investment, government expenditures and the net
exports are in terms of real per capita terms, the values are divided by the number of
populations for which we get
Table 2 Components of GDP in terms of real per capita
Year
Consumpti
on
Investme
nt
Govt
Exp
Net
Export
s
1987 0.005784 0.001533
0.0098
87
0.0004
79
1988 0.005897 0.001764
0.0102
78
0.0003
25
1989 0.00611 0.001885
0.0107
99
0.0002
39
1990 0.006175 0.00167
0.0105
45
0.0003
91
1991 0.006154 0.001461 0.0102
0.0005
56
1992 0.006242 0.001508
0.0103
43
0.0005
79
1993 0.006273 0.001608
0.0105
5
0.0006
52
1994 0.006427 0.001812
0.0110
52
0.0006
01
1995 0.006606 0.001867
0.0113
01
0.0006
25
1996 0.006715 0.001979
0.0115
62
0.0006
95
1997 0.006913 0.002182
0.0119
84
0.0006
6
1998 0.007197 0.00237
0.0125
44
0.0006
94
1999 0.007497 0.002387
0.0130
66
0.0006
15
2000 0.007666 0.002475 0.0132
0.0008
04
⊘ This is a preview!⊘
Do you want full access?
Subscribe today to unlock all pages.
Trusted by 1+ million students worldwide
ECONOMICS
2001 0.007782 0.002292
0.0131
66
0.0009
49
2002 0.008004 0.002627
0.0137
9
0.0007
46
2003 0.008197 0.002878
0.0143
86
0.0004
67
2004 0.008567 0.003044
0.0151
26
0.0002
54
2005 0.00874 0.003226
0.0155
43
0.0001
21
2006 0.008974 0.003301
0.0159
14
-3.1E-
05
2007 0.009453 0.003587
0.0168
51
-
0.0003
2
2008 0.00946 0.00371
0.0170
76
-
0.0003
1
2009 0.009435 0.003488
0.0167
77 -0.0002
2010 0.009641 0.003431
0.0171
83
-
0.0004
6
2011 0.009848 0.003798
0.0178
2
-
0.0008
4
2012 0.009914 0.004142
0.0181
89
-
0.0007
5
2013 0.009924 0.004091
0.0179
83
-
0.0004
8
2014 0.010022 0.003966
0.0178
98
-
0.0002
5
2015 0.010123 0.003755
0.0178
47
-5.7E-
05
2016 0.010231 0.003494
0.0179
16
8.75E-
05
2017 0.010308 0.00349
0.0180
98 -3E-05
2018 0.010408 0.003541
0.0183
71
0.0010
22
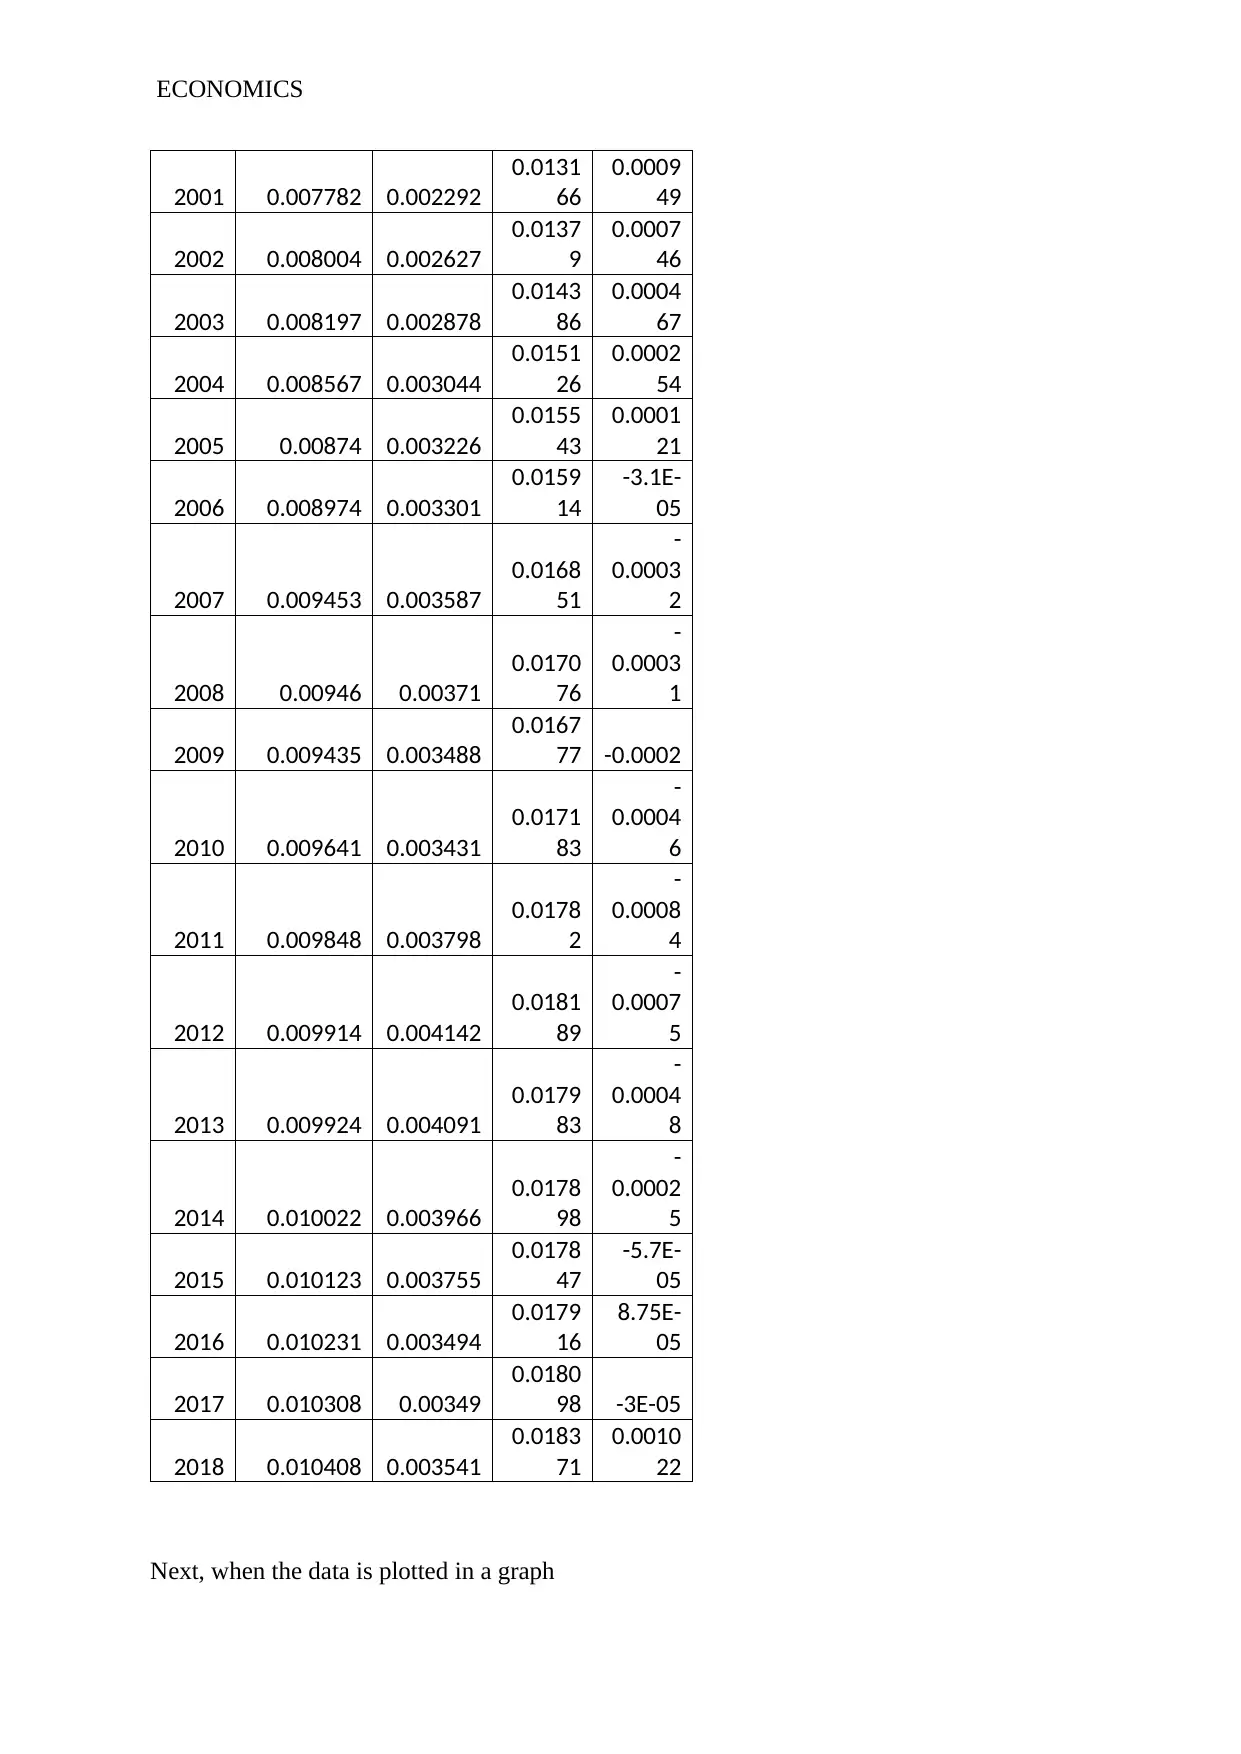
Next, when the data is plotted in a graph
2001 0.007782 0.002292
0.0131
66
0.0009
49
2002 0.008004 0.002627
0.0137
9
0.0007
46
2003 0.008197 0.002878
0.0143
86
0.0004
67
2004 0.008567 0.003044
0.0151
26
0.0002
54
2005 0.00874 0.003226
0.0155
43
0.0001
21
2006 0.008974 0.003301
0.0159
14
-3.1E-
05
2007 0.009453 0.003587
0.0168
51
-
0.0003
2
2008 0.00946 0.00371
0.0170
76
-
0.0003
1
2009 0.009435 0.003488
0.0167
77 -0.0002
2010 0.009641 0.003431
0.0171
83
-
0.0004
6
2011 0.009848 0.003798
0.0178
2
-
0.0008
4
2012 0.009914 0.004142
0.0181
89
-
0.0007
5
2013 0.009924 0.004091
0.0179
83
-
0.0004
8
2014 0.010022 0.003966
0.0178
98
-
0.0002
5
2015 0.010123 0.003755
0.0178
47
-5.7E-
05
2016 0.010231 0.003494
0.0179
16
8.75E-
05
2017 0.010308 0.00349
0.0180
98 -3E-05
2018 0.010408 0.003541
0.0183
71
0.0010
22
Next, when the data is plotted in a graph
Paraphrase This Document
Need a fresh take? Get an instant paraphrase of this document with our AI Paraphraser
ECONOMICS
1987
1989
1991
1993
1995
1997
1999
2001
2003
2005
2007
2009
2011
2013
2015
2017
-100000
0
100000
200000
300000
400000
500000
Consumption Investment Govt Exp Net Exports
Year
Vaue
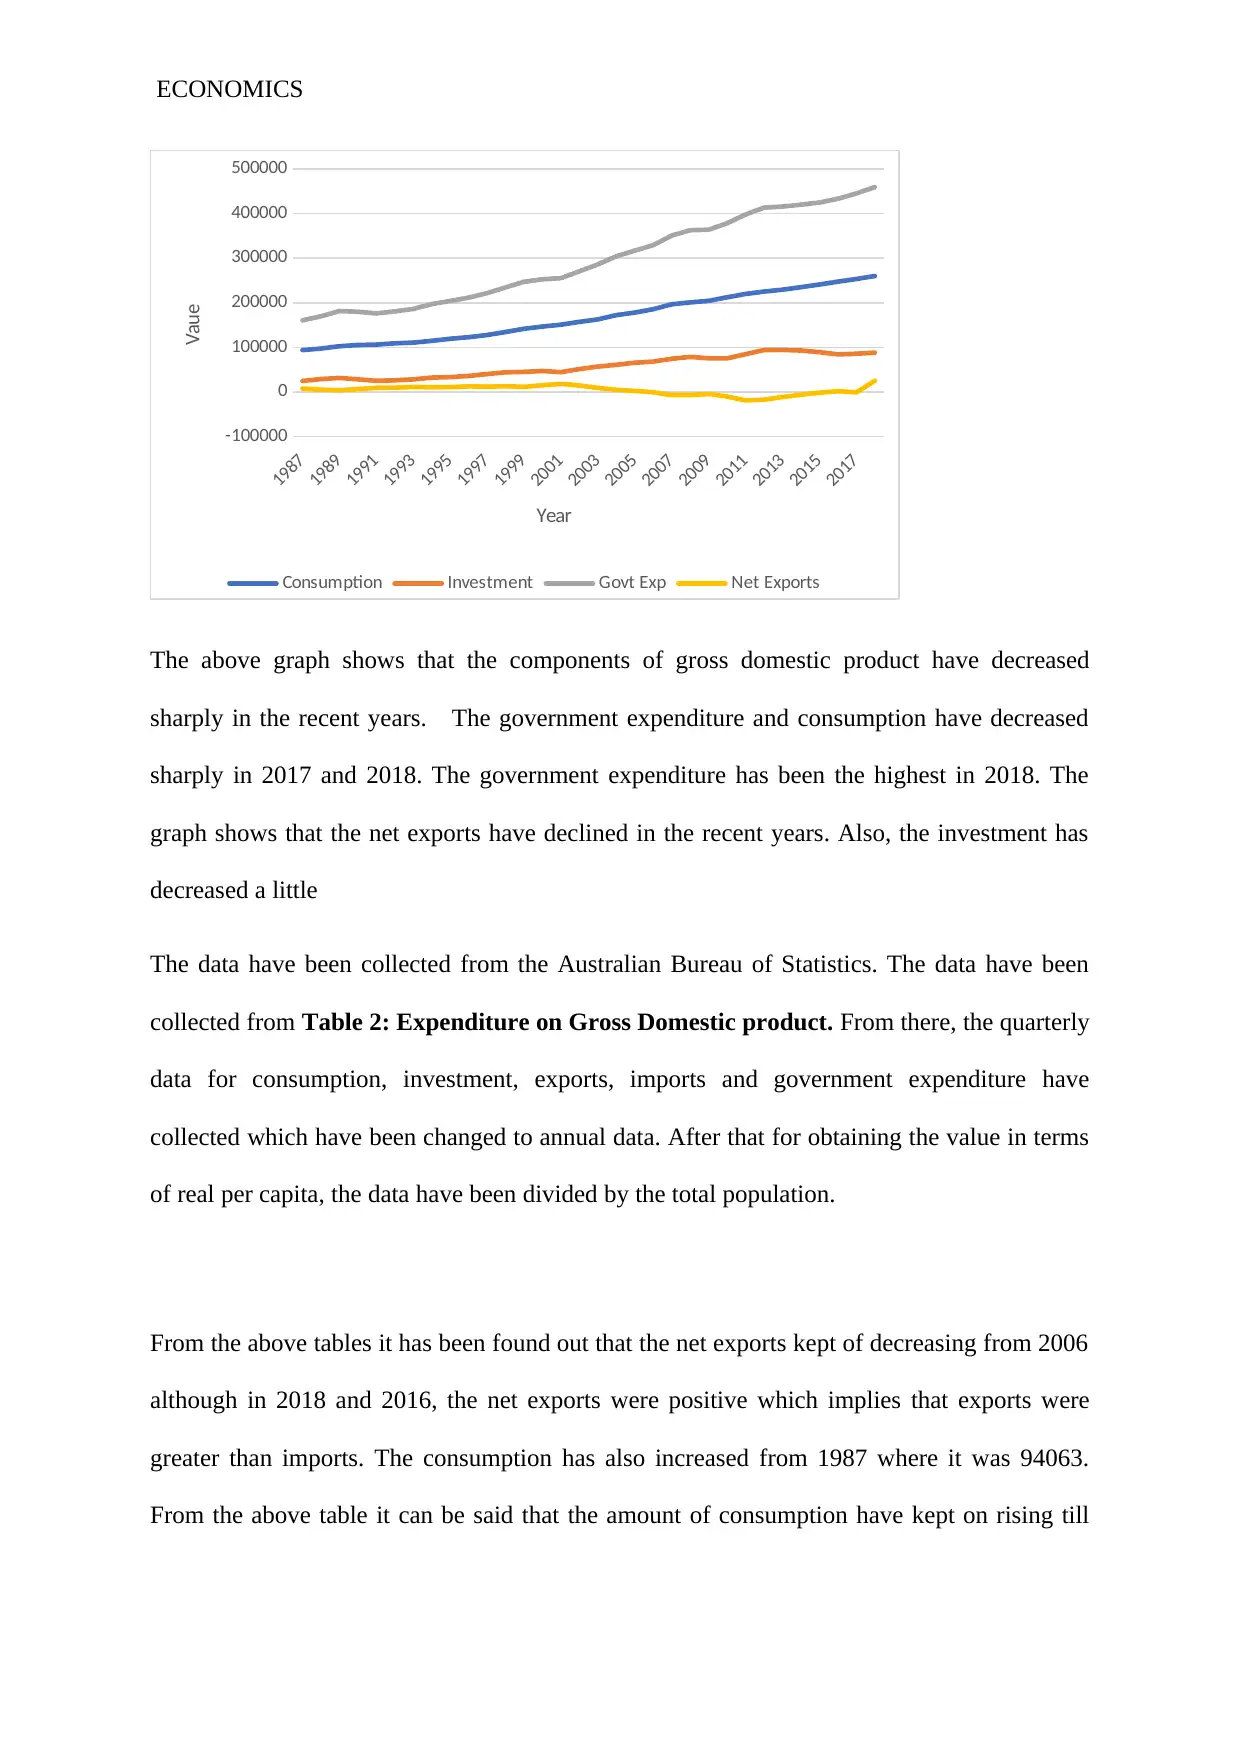
The above graph shows that the components of gross domestic product have decreased
sharply in the recent years. The government expenditure and consumption have decreased
sharply in 2017 and 2018. The government expenditure has been the highest in 2018. The
graph shows that the net exports have declined in the recent years. Also, the investment has
decreased a little
The data have been collected from the Australian Bureau of Statistics. The data have been
collected from Table 2: Expenditure on Gross Domestic product. From there, the quarterly
data for consumption, investment, exports, imports and government expenditure have
collected which have been changed to annual data. After that for obtaining the value in terms
of real per capita, the data have been divided by the total population.
From the above tables it has been found out that the net exports kept of decreasing from 2006
although in 2018 and 2016, the net exports were positive which implies that exports were
greater than imports. The consumption has also increased from 1987 where it was 94063.
From the above table it can be said that the amount of consumption have kept on rising till
1987
1989
1991
1993
1995
1997
1999
2001
2003
2005
2007
2009
2011
2013
2015
2017
-100000
0
100000
200000
300000
400000
500000
Consumption Investment Govt Exp Net Exports
Year
Vaue
The above graph shows that the components of gross domestic product have decreased
sharply in the recent years. The government expenditure and consumption have decreased
sharply in 2017 and 2018. The government expenditure has been the highest in 2018. The
graph shows that the net exports have declined in the recent years. Also, the investment has
decreased a little
The data have been collected from the Australian Bureau of Statistics. The data have been
collected from Table 2: Expenditure on Gross Domestic product. From there, the quarterly
data for consumption, investment, exports, imports and government expenditure have
collected which have been changed to annual data. After that for obtaining the value in terms
of real per capita, the data have been divided by the total population.
From the above tables it has been found out that the net exports kept of decreasing from 2006
although in 2018 and 2016, the net exports were positive which implies that exports were
greater than imports. The consumption has also increased from 1987 where it was 94063.
From the above table it can be said that the amount of consumption have kept on rising till

ECONOMICS
the present day. Coming to the investment, it have been found out that the rate decreased after
2014. The investment was highest in the year 2013, after which it decreased.
the present day. Coming to the investment, it have been found out that the rate decreased after
2014. The investment was highest in the year 2013, after which it decreased.
⊘ This is a preview!⊘
Do you want full access?
Subscribe today to unlock all pages.
Trusted by 1+ million students worldwide
ECONOMICS
Answer 2
One of the key drivers of the wage growth is the long term productivity and the
inflation expectations. The wage growth is also relative to the rise in prices of the economy.
Business cycle fluctuations although can lead to real wage growth diverging from the
productivity growth. On a variety of measures, it has been found out that the wage growth in
Australia is comparatively low. The real wage growth is the growth of wage which is relative
to the increase in prices in the economy ("Low wage growth undercuts Government's positive
economic message", 2019). The wage growth in the public sector is also found to be much
lower in nature. there are number of ways by which the wage growth can be measured. One
of the ways is by measuring the consumer price inflation. One of the biggest causes of the
low wage growth is the productivity. Banks have forecasted that the wage growth in
Australia is surprisingly low. Since wages are the largest component of the business cost, the
decline in the wage growth will lead to low inflation over the recent years.
Reasons of low wage growth
One of the reasons of the real wage growth in Australia is due to the slack in the
labour market which took place since the year 2008 where employees had to accept the low
wage growth. The lower rate of inflation and expectations in the recent years also have
affected the wage growth. The sharp fall in the terms of trade have also resulted to a
significant effect on the wage growth
The ABC news states that the wage growth have stagnated. The minimum wage has
become too low and the unions are under attack. The rise in globalization which also means
increase in competition from the low paid workers in the developing countries. This also keep
the manufacturing wages low in case of the advanced countries. The poor wage growth also
means that the rate of interest will be low for a long period of time. The low wage growth
Paraphrase This Document
Need a fresh take? Get an instant paraphrase of this document with our AI Paraphraser
ECONOMICS
also means sluggish growth in wages, low inflation for a long period of time, huge amount of
household debt along with low rate of interest ("Vital Signs: poor wage growth means interest
rates could be low for a long time", 2019). The government have also stated that the cash rate of
Australia will also not rise until the wage growth returns to the long term trend. Low wage
growth can also take place due to lack of productivity growth. Weaker growth of labour
productivity therefore is the reason
The low wage growth in Australia have hugely affected the poor corporate
performance and have also ended the commodity price boom. It have also lead to an increase
in the labour force underutilisation rate. Recent growth in wages appears to be less sensitive
for the underutilization rate which can take place due to less bargaining power. Over the past
decade, the soft wage growth had been a notable feature in the Australian economy. Most of
the Australian business had been softened up by the global financial crisis which were left
uncompetitive and vulnerable when the commodity prices have collapsed during 2013. After
the inflation took place, the Australian wages have barely changed over the last five years.
This situation has affected every state and industry.
There are basically many factors behind the low wage growth in Australia. One of the reason
is the commodity price boom which took place from 2003 to 2013. Another reason of the low
wage growth is the beginning of the global financial crisis which took place in the year 2008.
The third reason is the declining influence of the unions. For quite a long period of time, the
wage growth had been quite strong in Australia compared to the other economies in the
world. After the adjustments of inflation, the wages of Australia have barely changed to 0.1
percent a year throughout (Byrne & Zekaite, 2018). The wage growth in almost all the
industries in Australia is below the average. However, healthcare and education are leading
the way followed by retail and mining. During the period of the commodity price boom, the
wage gain were even known to proceed productivity. At that time, the wages became so high
ECONOMICS
when compared to the other economies across the world, it became for the Australian
companies to compete.
One of the striking feature noticed in the Australian labour market in the recent years is the
slow down along with low rate of growth in nominal wages. The low age growth also states
that the living standards or workers had been stalled.
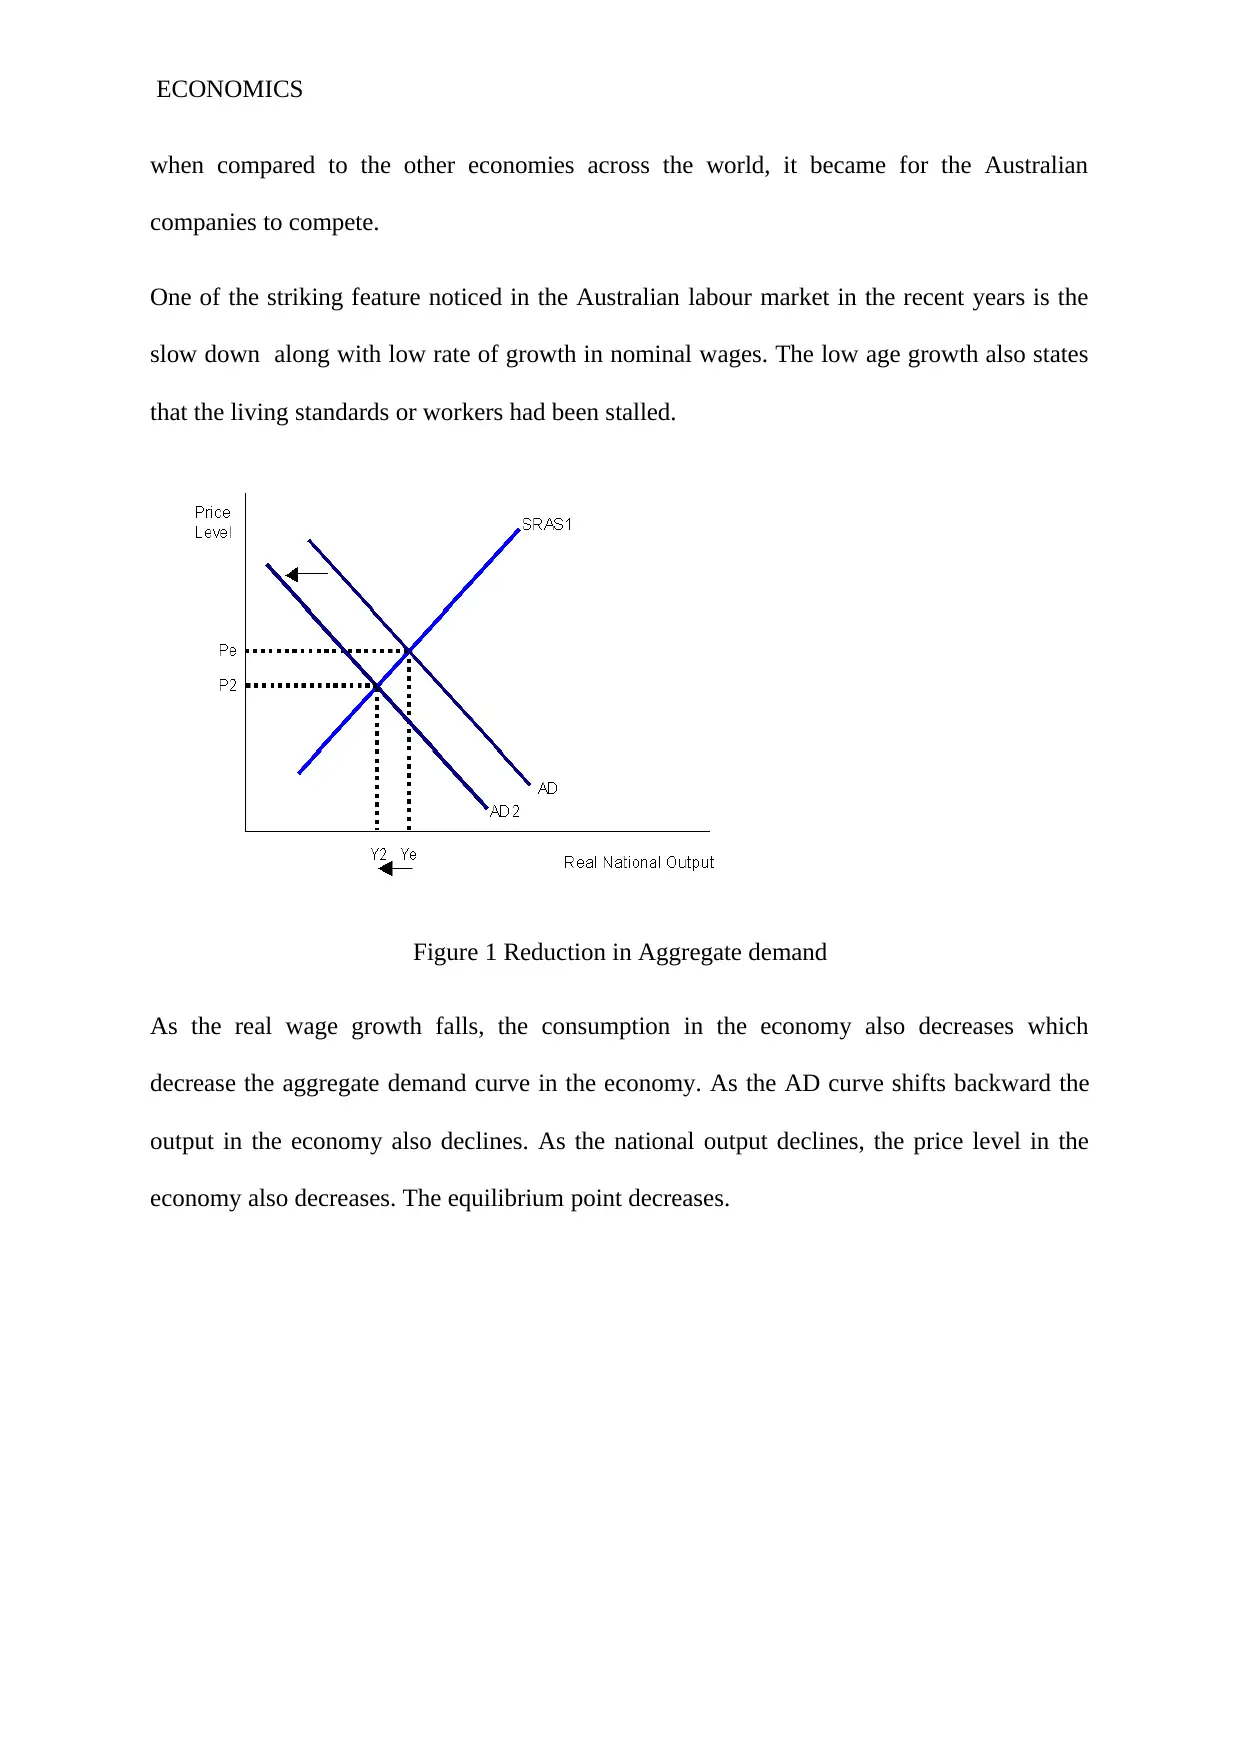
Figure 1 Reduction in Aggregate demand
As the real wage growth falls, the consumption in the economy also decreases which
decrease the aggregate demand curve in the economy. As the AD curve shifts backward the
output in the economy also declines. As the national output declines, the price level in the
economy also decreases. The equilibrium point decreases.
when compared to the other economies across the world, it became for the Australian
companies to compete.
One of the striking feature noticed in the Australian labour market in the recent years is the
slow down along with low rate of growth in nominal wages. The low age growth also states
that the living standards or workers had been stalled.
Figure 1 Reduction in Aggregate demand
As the real wage growth falls, the consumption in the economy also decreases which
decrease the aggregate demand curve in the economy. As the AD curve shifts backward the
output in the economy also declines. As the national output declines, the price level in the
economy also decreases. The equilibrium point decreases.
⊘ This is a preview!⊘
Do you want full access?
Subscribe today to unlock all pages.
Trusted by 1+ million students worldwide
ECONOMICS
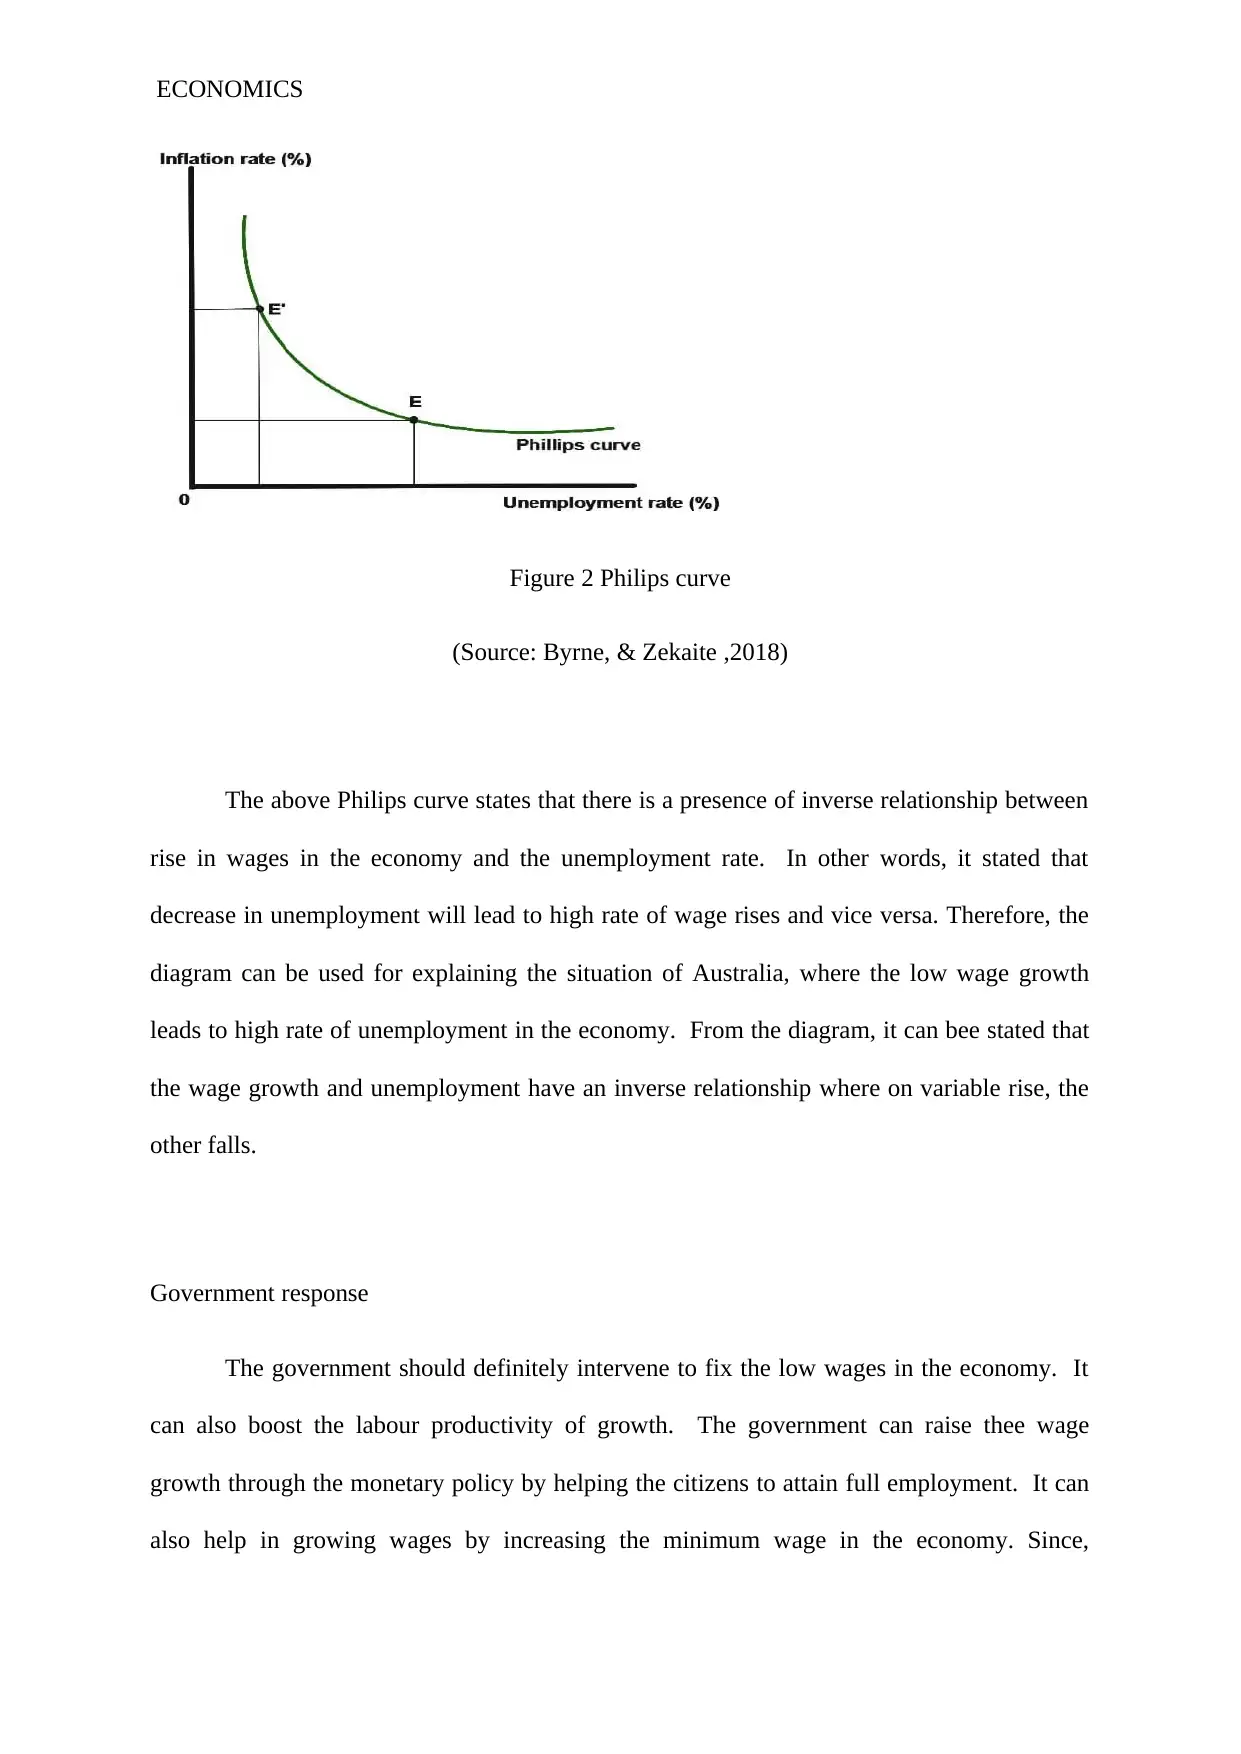
Figure 2 Philips curve
(Source: Byrne, & Zekaite ,2018)
The above Philips curve states that there is a presence of inverse relationship between
rise in wages in the economy and the unemployment rate. In other words, it stated that
decrease in unemployment will lead to high rate of wage rises and vice versa. Therefore, the
diagram can be used for explaining the situation of Australia, where the low wage growth
leads to high rate of unemployment in the economy. From the diagram, it can bee stated that
the wage growth and unemployment have an inverse relationship where on variable rise, the
other falls.
Government response
The government should definitely intervene to fix the low wages in the economy. It
can also boost the labour productivity of growth. The government can raise thee wage
growth through the monetary policy by helping the citizens to attain full employment. It can
also help in growing wages by increasing the minimum wage in the economy. Since,
Paraphrase This Document
Need a fresh take? Get an instant paraphrase of this document with our AI Paraphraser
ECONOMICS
revitalizing the wage growth is crucial for increasing the living standards. The government
should also create a large amount of jobs and should try to attain full employment in the
economy. In this case, the monetary policies will help in the creation of more jobs and will
also target full employment in the economy. Full employment in the economy can also be
achieved by reducing the trade deficit in the economy. The government should also increase
its spending to public investment and infrastructures and targeting huge amount of
employment programs. However, changing in the corporate tax or cutting down taxes will not
help inn the period of low wage growth. For obtaining full employment in the economy, the
government should take such policies which will create more jobs.
Conclusion
The first part of the section shows the tables and graphs of the component of the gross
domestic product. The second part of the paper shows the reason behind the low wage
growth and how the government should act to it. The wage growth in the public sector have
been found to be much lower in nature. There are number of ways by which the wage growth
can be measured. One of the ways is by measuring the consumer price inflation. One of the
biggest causes of the low wage growth is the productivity. The government should also create
a large amount of jobs and should try to attain full employment in the economy. In this case,
the monetary policies will help in the creation of more jobs and will also target full
employment in the economy. The soft wage growth had been a notable feature in the
Australian economy. Most of the Australian business had been softened up by the global
financial crisis which were left uncompetitive and vulnerable when the commodity prices
have collapsed. The paper shows the various reasons for the low wage growth in Australia
and its impacts. Therefore, it is advisable for the government to increase its spending for
attaining full employment and increase the wage growth.
ECONOMICS
Reference list
Arsov, I., & Evans, R. (2018). Wage growth in advanced economies. Reserve Bank of
Australia Bulletin, 132-152.
Australian Bureau of Statistics, Australian Government. (2019). Retrieved from
https://www.abs.gov.au/
Bishop, J., & Cassidy, N. (2017). Insights into low wage growth in Australia. RBA Bulletin,
March, 13-20.
Bishop, J., & Chan, I. (2019). Is Declining Union Membership Contributing to Low Wages
Growth? (No. rdp2019-02). Reserve Bank of Australia.
Brouillette, D., Ketcheson, J., Kostyshyna, O., & Lachaine, J. (2017). Wage Growth in
Canada and the United States: Factors Behind Recent Weakness. Bank of Canada.
Byrne, D., & Zekaite, Z. (2018). Missing wage growth in the euro area: is the wage Philips
curve non-linear? (No. 9/EL/18). Central Bank of Ireland.
Jacobs, D., & Rush, A. (2015). Why is wage growth so low?. RBA Bulletin, June, 9-18.
Leal, H. (2019). Firm-level Insights into Skills Shortages and Wages Growth| Bulletin–March
Quarter 2019. Bulletin, (March).
Low wage growth undercuts Government's positive economic message. (2019). Retrieved
from https://www.abc.net.au/news/2018-02-02/low-wage-growth-undercuts-
governments-message/9391778
Stanford, J. (2017). Briefing Note: Labour Share of Australian GDP Hits All-Time Record
Low. The Australia Institute: Centre for Future Work, 13.
⊘ This is a preview!⊘
Do you want full access?
Subscribe today to unlock all pages.
Trusted by 1+ million students worldwide
1 out of 13
Your All-in-One AI-Powered Toolkit for Academic Success.
+13062052269
info@desklib.com
Available 24*7 on WhatsApp / Email
![[object Object]](/_next/static/media/star-bottom.7253800d.svg)
Unlock your academic potential
Copyright © 2020–2026 A2Z Services. All Rights Reserved. Developed and managed by ZUCOL.