Economic Growth, GDP, Resource Curse, and Two-Period Model Report
VerifiedAdded on 2021/05/31
|13
|3232
|148
Report
AI Summary
This report delves into several key economic concepts, beginning with an analysis of economic growth and its relationship to GDP. It explores whether growth can lead to negative outcomes, examining the potential for marginal costs to outweigh marginal benefits and questioning the efficacy of GDP as a sole measure of economic progress. The report then investigates the resource curse phenomenon, where regions rich in natural resources paradoxically experience slower economic development, using the case of China to illustrate this. The study examines the interplay of resource abundance, institutional quality, and economic growth at the provincial level. Finally, the report touches upon the two-period model and its implications for marginal user cost trends. The analysis draws on various economic theories and models, providing a comprehensive overview of the complexities of economic development and resource management.
Contents
Question 1...................................................................................................................................................1
1) Can Growth make us poorer?..........................................................................................................1
1.2 Is it possible that the Marginal Costs Can become bigger than Marginal Benefits?..........................2
1.3 Is GDP a good measure to measure economic growth?....................................................................3
Question 2...................................................................................................................................................4
Question 3...............................................................................................................................................6
Paraphrase This Document
Need a fresh take? Get an instant paraphrase of this document with our AI Paraphraser
Question 1
Economic growth is a short term view of the physical growth of the economy of a country. It is a
pivotal part of the larger goal of the economic development of a country. Economic development
of refers to the development of a economy from various aspects and is often measured in
qualitative terms. The Gross Domestic Product of a country describes the total amount of goods
and services produced within a given country. However, this data does not directly provide an
idea of the impact on an individual and provide a limited understanding of the various aspects of
development. For example, Gross Domestic Product per capita is an indicator of an increase in
the national wealth. Higher happiness can be a result from a higher household income (GDP per
capita) as it helps wipe out the stark deprivations such as food supplies. However, a higher
income does not necessarily mean more happiness. In some cases, higher incomes can lead to
more life style related diseases such as diabetes, eating disorders. (Helliwell, Layard, & Sachs,
2012)
1) Can Growth make us poorer?
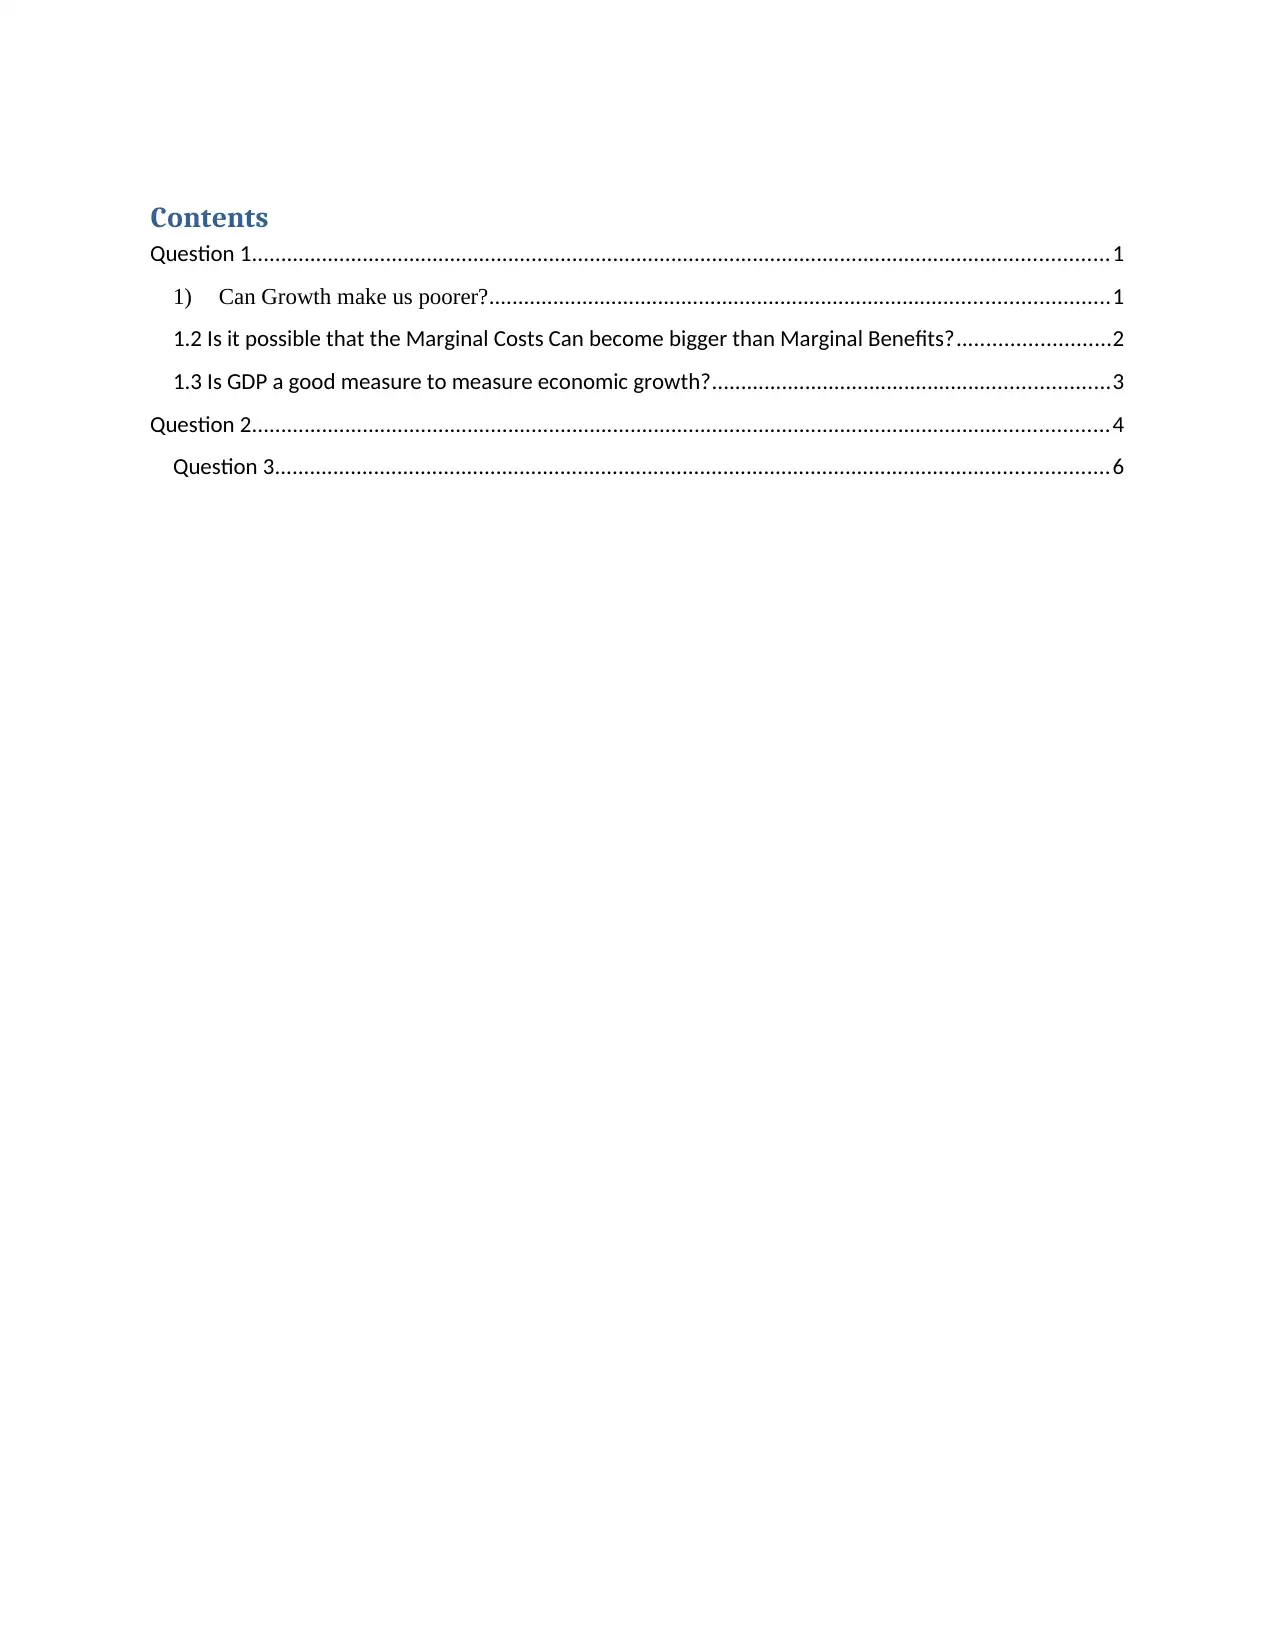
The GDP of a country is often measured , as the total value of goods and services produced
during a given year. Natural resources and human capital must be invested in order to
achieve a given GDP growth. Natural resources are often limited and the production of
natural resources , often, cannot be capped.
Figure 1 Total GDP as Aggregate of GDP of Country A and GDP of Country B
Economic growth is a short term view of the physical growth of the economy of a country. It is a
pivotal part of the larger goal of the economic development of a country. Economic development
of refers to the development of a economy from various aspects and is often measured in
qualitative terms. The Gross Domestic Product of a country describes the total amount of goods
and services produced within a given country. However, this data does not directly provide an
idea of the impact on an individual and provide a limited understanding of the various aspects of
development. For example, Gross Domestic Product per capita is an indicator of an increase in
the national wealth. Higher happiness can be a result from a higher household income (GDP per
capita) as it helps wipe out the stark deprivations such as food supplies. However, a higher
income does not necessarily mean more happiness. In some cases, higher incomes can lead to
more life style related diseases such as diabetes, eating disorders. (Helliwell, Layard, & Sachs,
2012)
1) Can Growth make us poorer?
The GDP of a country is often measured , as the total value of goods and services produced
during a given year. Natural resources and human capital must be invested in order to
achieve a given GDP growth. Natural resources are often limited and the production of
natural resources , often, cannot be capped.
Figure 1 Total GDP as Aggregate of GDP of Country A and GDP of Country B
Source: Prepared by Author
Adapted from (Samuelson & Nordhaus, 2004)
Let us take an example of two countries, Country A and Country B. Country A has a GDP of
$200 billion while country B has GDP of $150 Billion. However, in order to achieve the desired
growth, Country A had to sacrifice a large part of its large forest, in order to achieve the desired
growth. If the forest had been retained, the value of resources from the forest such as timber, silk
and other natural resources would have added $75 billion , in the next five years.
In this calculation, Country A is better off, according to GDP as a measure of wealth. However,
this measure did not put a value on the forest as an asset that has been retained. The Gross
Domestic Product of a country does not account for goods that do not have a price or are
intermediate goods. Moreover, GDP does not account for the negative externalities or net the
social costs that were possibly accrued due to the production of the various goods and services in
country i.e. it did not account for the intermediate goods that were sacrificed in order to achieve
this GDP and possibly led to environmental damage. The GDP also, did not account for the
possible social benefits or the possible positive externalities (such as better air quality) that could
be achieved from maintaining the forest or natural resources. Country A would be better off only
if the social costs of demolishing the forests would be less than the opportunity costs of the total
benefits that would have provided by the forests were not cut down. Similarly, Country B would
be better off only if the future value projected for the forests is greater than the net gains ie
$50billion. (Lipsey & Chrystal, 2011) (Arrow, et al., 2011)
1.2 Is it possible that the Marginal Costs Can become bigger than Marginal
Benefits?
According to Daly, (2013), “Even if it is theoretically possible that someday the marginal cost of
growth will become greater than the marginal benefit, there is no empirical evidence that this has
happened yet.” The concept of Marginal Costs and Benefits can be explained with the help of
the concept of negative externalities and deadweight costs.
‘Negative externalities’ are mathematically denoted as the deviation (negative) of Marginal
Private Cost or (MPC) from the Marginal Social Costs. Lipsey & Chrystal, (2011) have
explained private costs as “Private costs are those costs that are incurred by parties that are
⊘ This is a preview!⊘
Do you want full access?
Subscribe today to unlock all pages.
Trusted by 1+ million students worldwide
involved directly in the Economic activity”. Similarly, social costs have been explained
as“Social costs are those costs that are borne by the society” Lipsey & Chrystal, (2011). Hence,
Marginal Private Costs refer to the producer’ private s cost of producing the last unit produced or
providing services to the last consumer serviced. Producers price goods according to ‘willingness
to pay’ of consumers. The ‘Marginal Social Cost’ is the value of the impact that is borne by the
society due to the production of that last unit of goods or services. Negative externalities reduce
the social good i.e. they have a harmful effect or they cause inconvenience to the general public.
(Lipsey & Chrystal, 2011). The diagram given below depicts negative externalities and the ‘loss
of social good’ resulting from the producing goods and services. The Marginal Private Costs in
the diagram below depict the cost of producing the good or service. Deadweight loss is the
difference between the two. (Riley, 2005). The loss of social good is the loss of efficiency and
this loss of efficiency is calculated a ‘deadweight loss’.
Figure2 Negative Externalities: Marginal Costs becoming greater than Marginal Benfits
Source: (Riley, 2005)
1.3 Is GDP a good measure to measure economic growth?
In figure 2, The Total GDP of a the two countries is reflected as the Total GDP. Although the
GDP of the Country A is greater, it diminishes the total value of the GDP because of it’s limited
Marginal propensity to save.
Paraphrase This Document
Need a fresh take? Get an instant paraphrase of this document with our AI Paraphraser
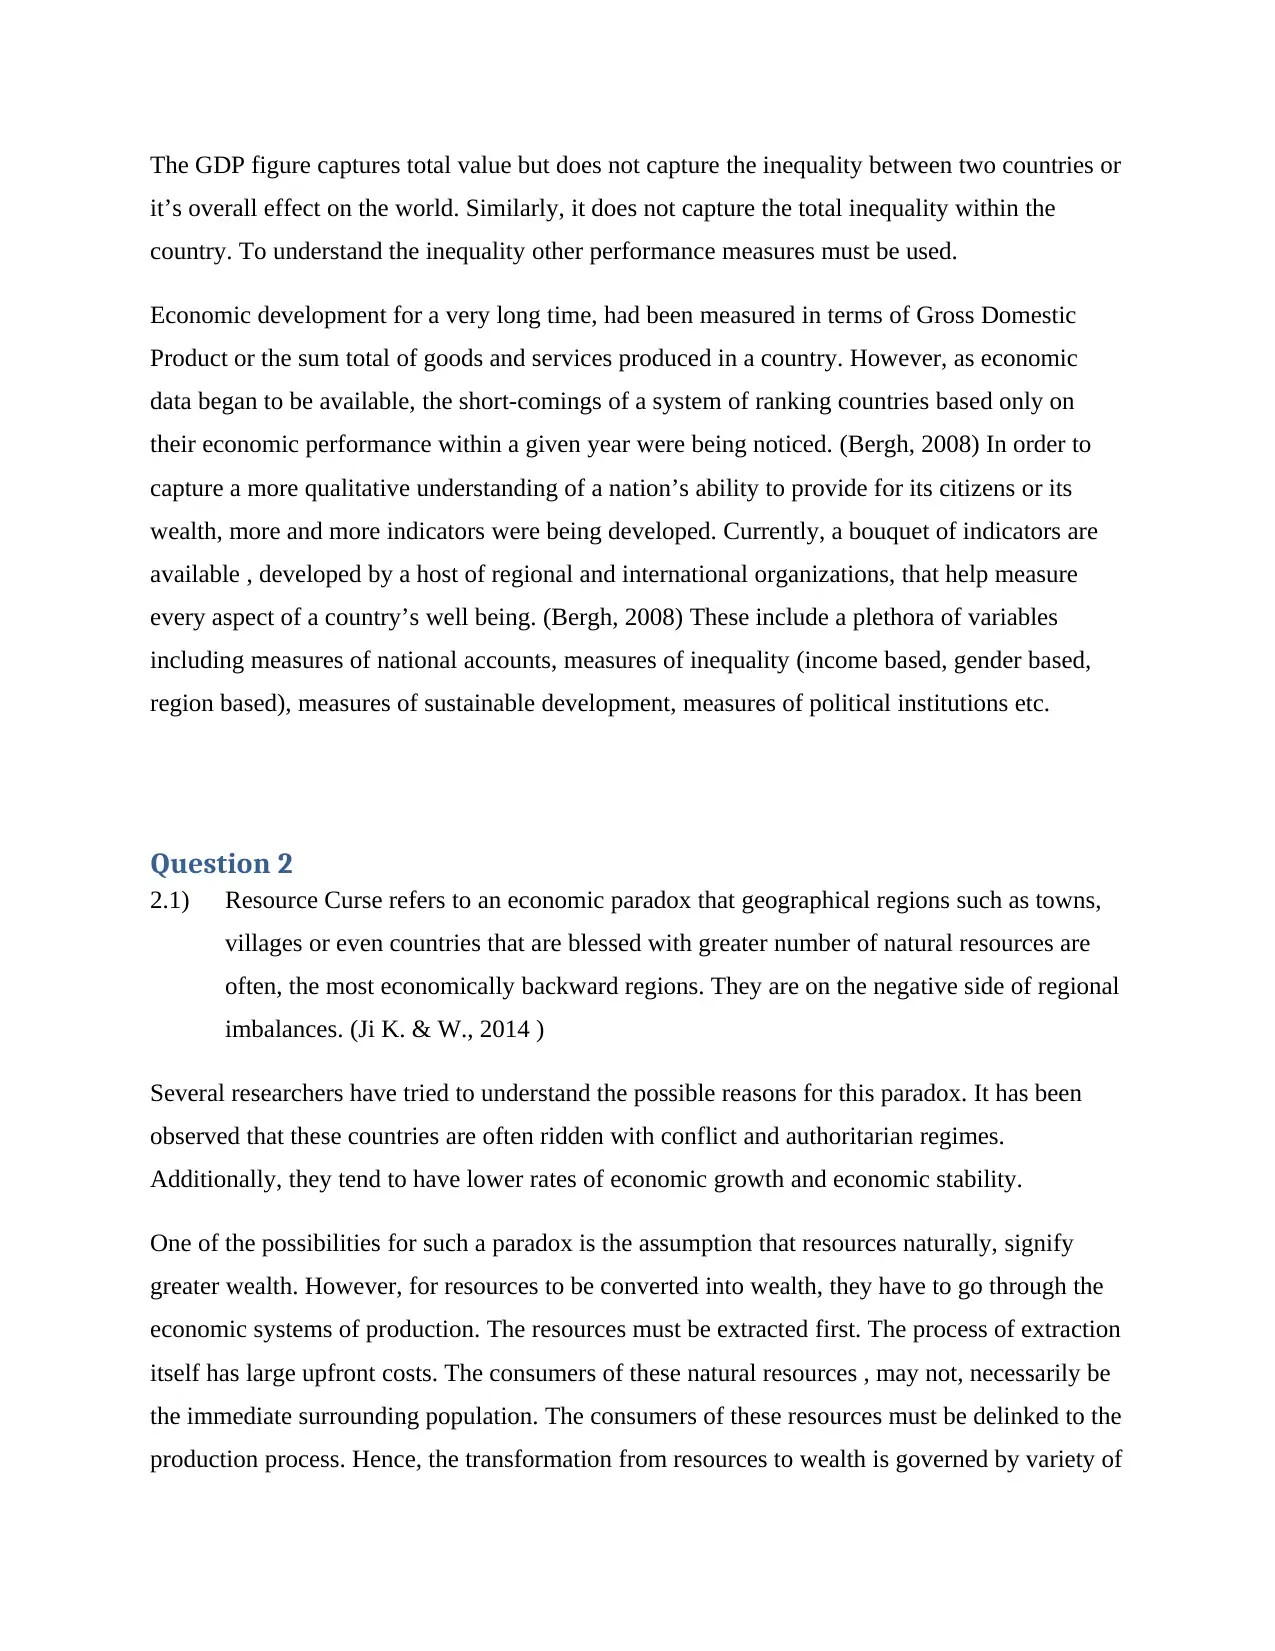
The GDP figure captures total value but does not capture the inequality between two countries or
it’s overall effect on the world. Similarly, it does not capture the total inequality within the
country. To understand the inequality other performance measures must be used.
Economic development for a very long time, had been measured in terms of Gross Domestic
Product or the sum total of goods and services produced in a country. However, as economic
data began to be available, the short-comings of a system of ranking countries based only on
their economic performance within a given year were being noticed. (Bergh, 2008) In order to
capture a more qualitative understanding of a nation’s ability to provide for its citizens or its
wealth, more and more indicators were being developed. Currently, a bouquet of indicators are
available , developed by a host of regional and international organizations, that help measure
every aspect of a country’s well being. (Bergh, 2008) These include a plethora of variables
including measures of national accounts, measures of inequality (income based, gender based,
region based), measures of sustainable development, measures of political institutions etc.
Question 2
2.1) Resource Curse refers to an economic paradox that geographical regions such as towns,
villages or even countries that are blessed with greater number of natural resources are
often, the most economically backward regions. They are on the negative side of regional
imbalances. (Ji K. & W., 2014 )
Several researchers have tried to understand the possible reasons for this paradox. It has been
observed that these countries are often ridden with conflict and authoritarian regimes.
Additionally, they tend to have lower rates of economic growth and economic stability.
One of the possibilities for such a paradox is the assumption that resources naturally, signify
greater wealth. However, for resources to be converted into wealth, they have to go through the
economic systems of production. The resources must be extracted first. The process of extraction
itself has large upfront costs. The consumers of these natural resources , may not, necessarily be
the immediate surrounding population. The consumers of these resources must be delinked to the
production process. Hence, the transformation from resources to wealth is governed by variety of
exogenous factors. The exogenous factors could be related to physical infrastructure or to non-
physical factors such as institutions and policies. Institutions may refer to political and social
institutions such as democracy, inheritances etc. while policies may refer to governmental
policies such as policies on taxation, social spending etc. (Natural Resources Governance
Institute, 2015)
2.2) The study is a very comprehensive examination od the regional imbalances in China due
to the “resource paradox”. The four main contributions of the study are as follows:
Development of a subjective measure to understand institutional quality in china.
Most studies relating to institutional qualities study the differences in political
factors such as the differences in local governance or social institutions. In China,
there is very little difference in the quality of these institutions since China has a
Communist system that stresses upon uniformity. This study, therefore, uses the
subjective, self reported, metric of quality of the judicial system. This sets the
study apart from others because it highlights the fact that imbalances can be a part
of the system , even when governance and social institutions are homogenous..
Additionally, the study measures various institutional variables such as the
ongoing research and development etc.
The study takes both a stock assessment as well as a flow assessment to measure
the wealth of resources. The stock approach describes the availability of natural
resources and is more of a comparative measure.
The study takes a time varying approach to the problem by introducing dummy
variables for policy shocks and introducing time as a variable.
The study also takes a co-efficient problem. The Co-efficient serves as a
weightage to the impact of the resource on the overall estimation. Different
resources many have different impacts on the equation. This study uses
coefficients to account for that.
2.3) The Data was considered from 28 provinces from Mainland China. The variability of
resources was drawn from the statistical handbook and considered mineral resources to
measure the resource abundance. The study took stock value as well as the flow of value
approach to analyses of data to understand the wealth of resources, although results were
presented only for the flow of revenues generated from the resources. The study
⊘ This is a preview!⊘
Do you want full access?
Subscribe today to unlock all pages.
Trusted by 1+ million students worldwide
considered various economy related variables such as economic growth, quality of
institutions, the research and development in industries, employment in private sector,
foreign investment and initial economic development.
The key differentiating factor, however, that sets this study apart from several others is
the assignment of institutional quality. The political institutions of China, being
Communist in nature, the institutional quality is uniform all over the country. Similarly,
in the absence of religion or caste based differentiation, the social institutional quality is
also, very different. Hence, the perceptions like the quality of Courts and justice system
was used as a proxy to rate the institutional quality.
2.4) The paper examines the effects of the abundance of natural resources in China on growth
at the provincial level. The study models an non-linear effct of resources on economic
growth while placing an emphasis on the availability of quality of institutions as a
determining factor. The study has found that there was a positive co-relation between
economic growth and abundance at the provincial level. The co-relation between resource
abundance and institutional quality was weak. This implies that the abundance if natural
resources This implies that there must be some partial support for the theory of resource
paradox. The findings of this study are in contrast with other cross sectional studies
conducted in other countries. However, in the short run, the correlation between natural
resources and economic growth is not stable.
Policies are shown to play an important role in the relationship between resource abundance and
economic growth as policies can act as a catalyst in ensuring that the revenues from the natural
resources translate into greater growth for the provinces.
The authors also note that linear models are not good estimators if the linkages between
economic growth and resource abundance.
Question 3
3.1) In the two period model, marginal user cost rises steadily. This trend is retained when the
two period model is extended to N number of periods. However, the consumption will be
Paraphrase This Document
Need a fresh take? Get an instant paraphrase of this document with our AI Paraphraser
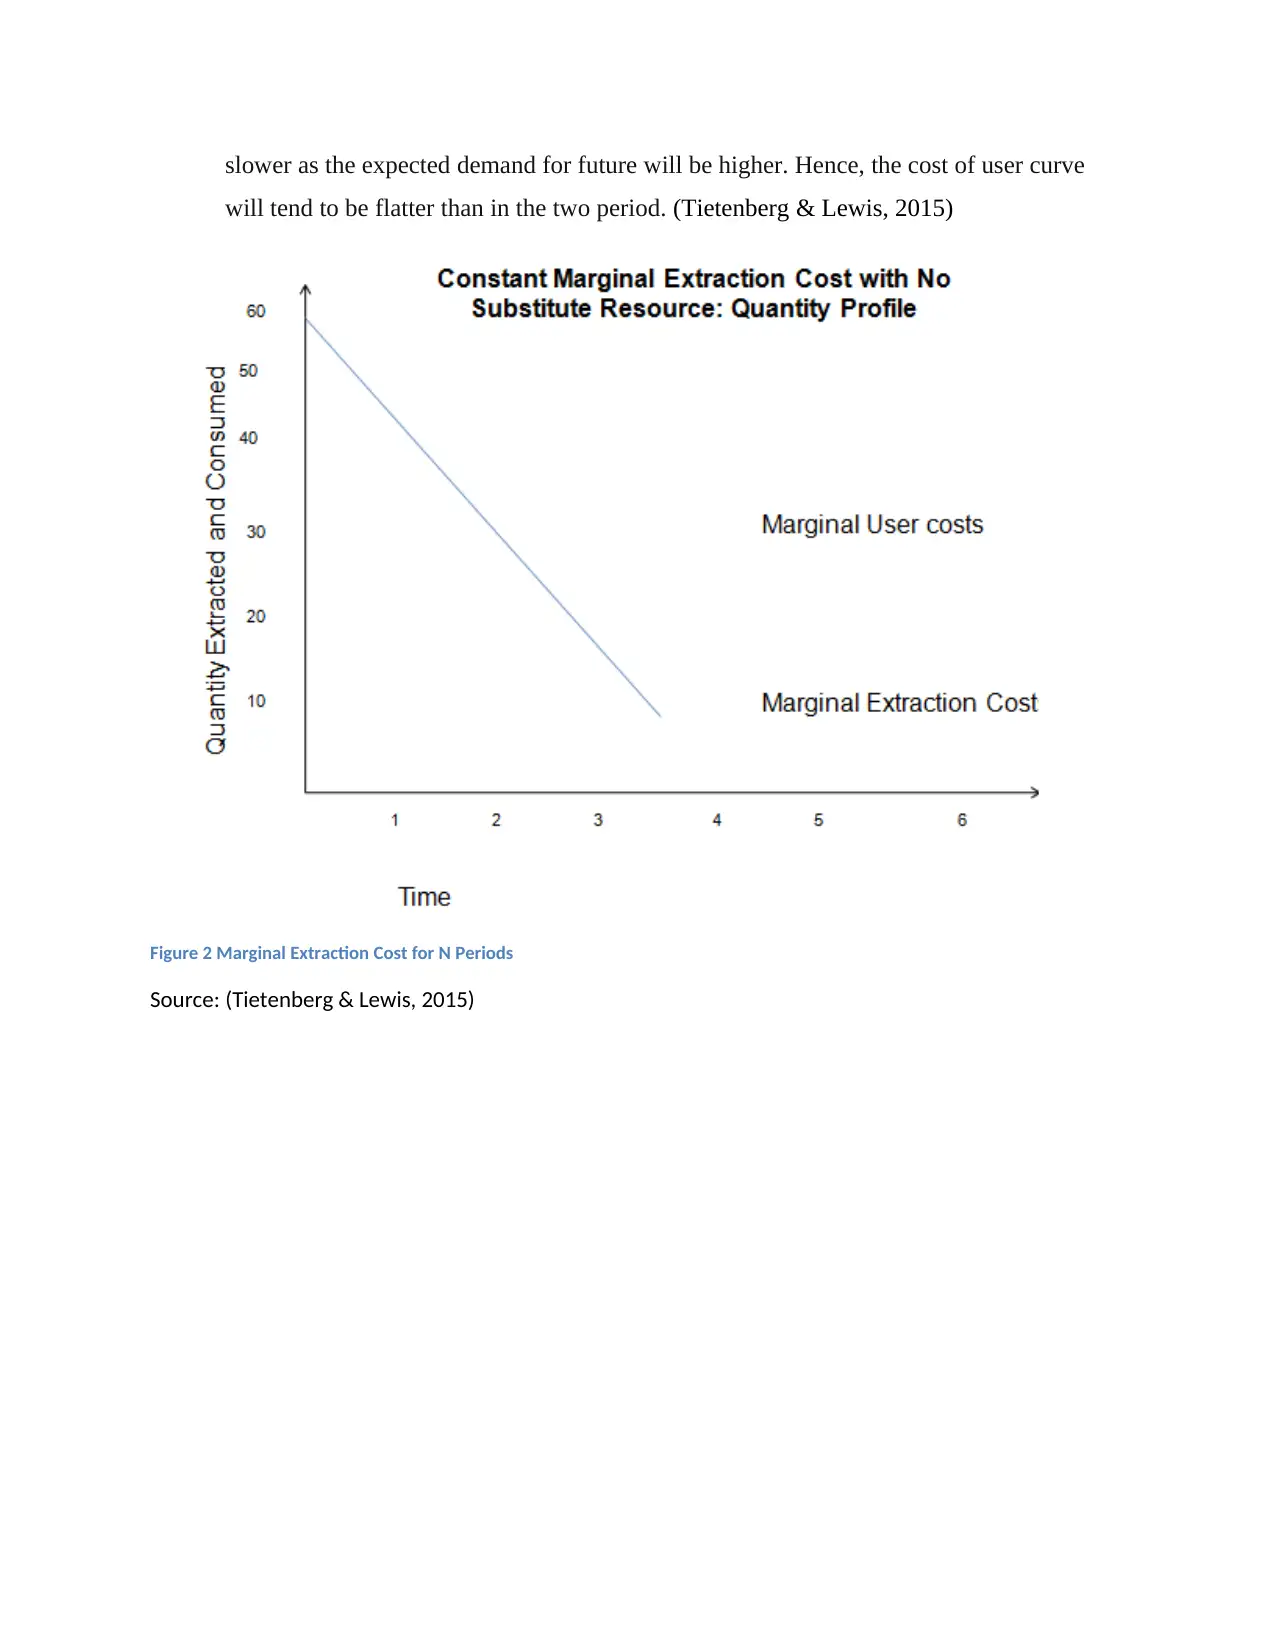
slower as the expected demand for future will be higher. Hence, the cost of user curve
will tend to be flatter than in the two period. (Tietenberg & Lewis, 2015)
Figure 2 Marginal Extraction Cost for N Periods
Source: (Tietenberg & Lewis, 2015)
will tend to be flatter than in the two period. (Tietenberg & Lewis, 2015)
Figure 2 Marginal Extraction Cost for N Periods
Source: (Tietenberg & Lewis, 2015)
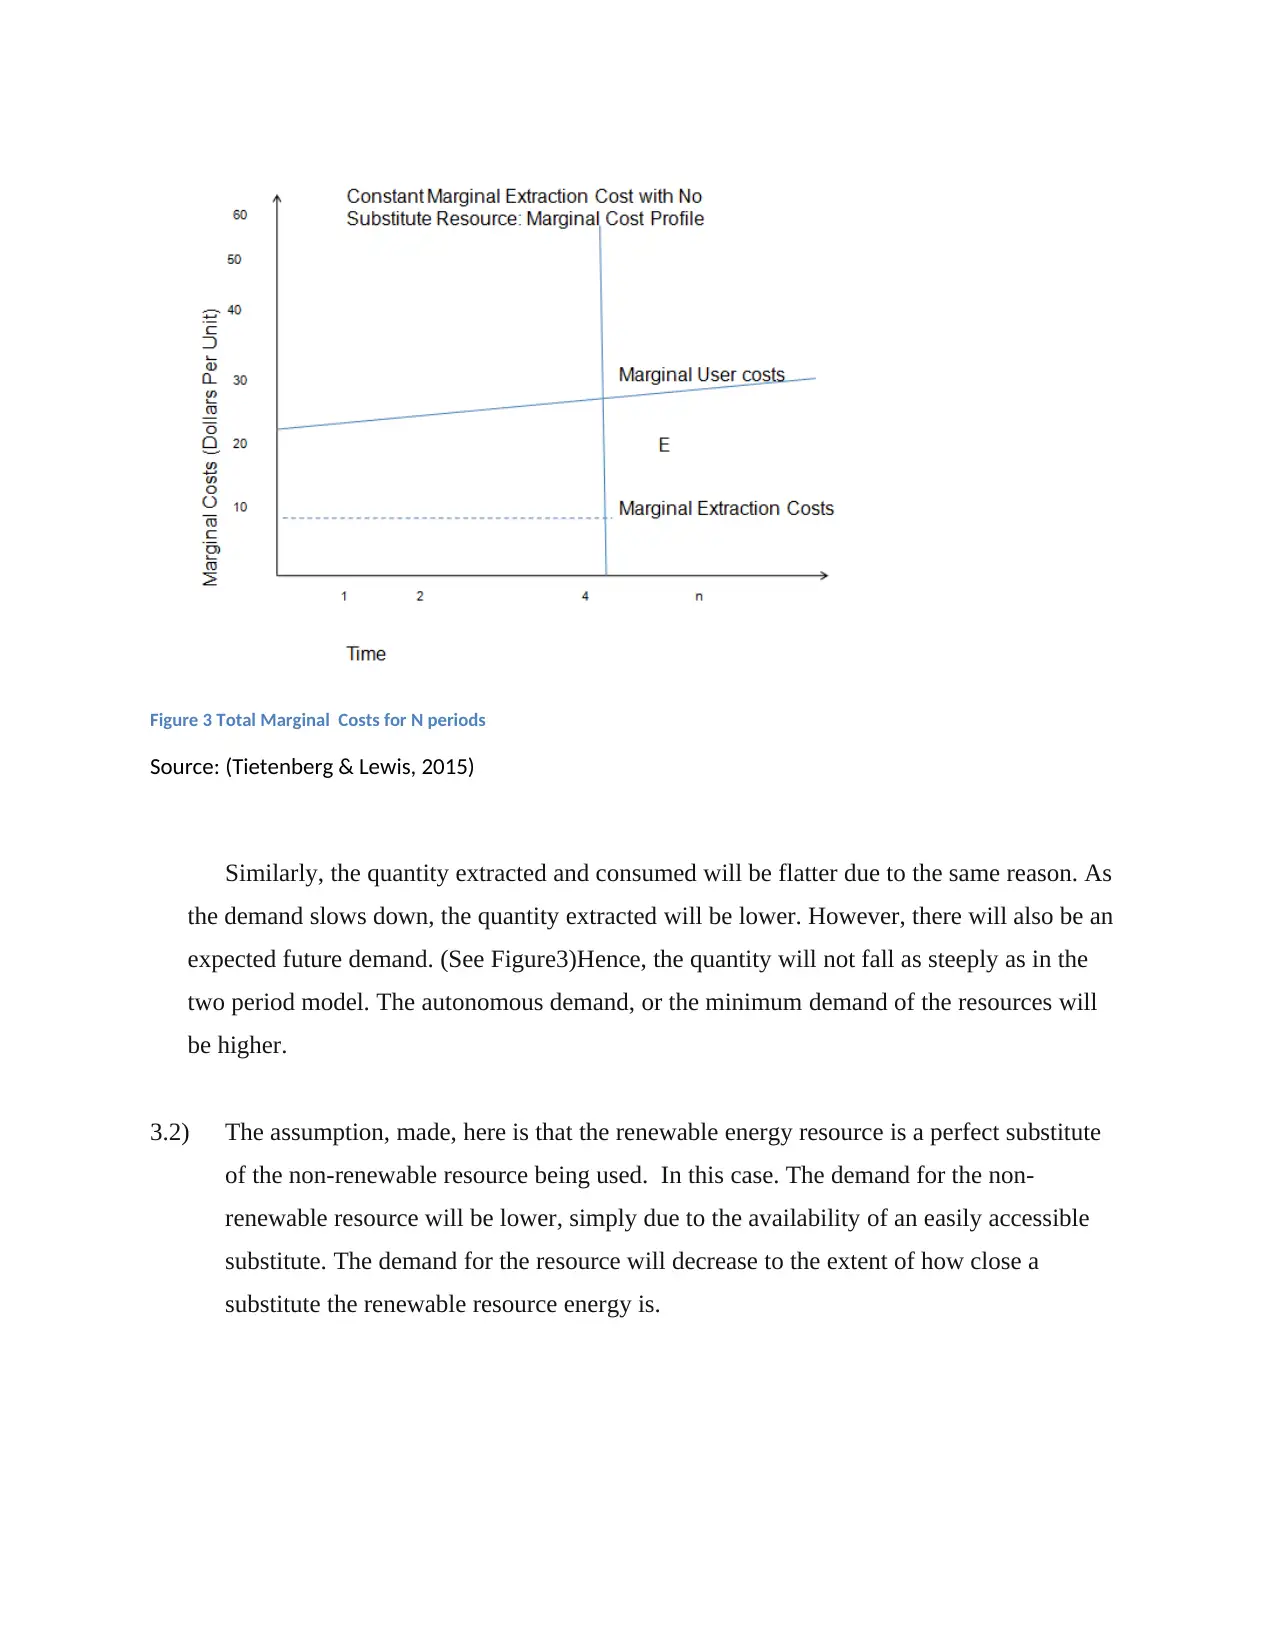
Figure 3 Total Marginal Costs for N periods
Source: (Tietenberg & Lewis, 2015)
Similarly, the quantity extracted and consumed will be flatter due to the same reason. As
the demand slows down, the quantity extracted will be lower. However, there will also be an
expected future demand. (See Figure3)Hence, the quantity will not fall as steeply as in the
two period model. The autonomous demand, or the minimum demand of the resources will
be higher.
3.2) The assumption, made, here is that the renewable energy resource is a perfect substitute
of the non-renewable resource being used. In this case. The demand for the non-
renewable resource will be lower, simply due to the availability of an easily accessible
substitute. The demand for the resource will decrease to the extent of how close a
substitute the renewable resource energy is.
⊘ This is a preview!⊘
Do you want full access?
Subscribe today to unlock all pages.
Trusted by 1+ million students worldwide
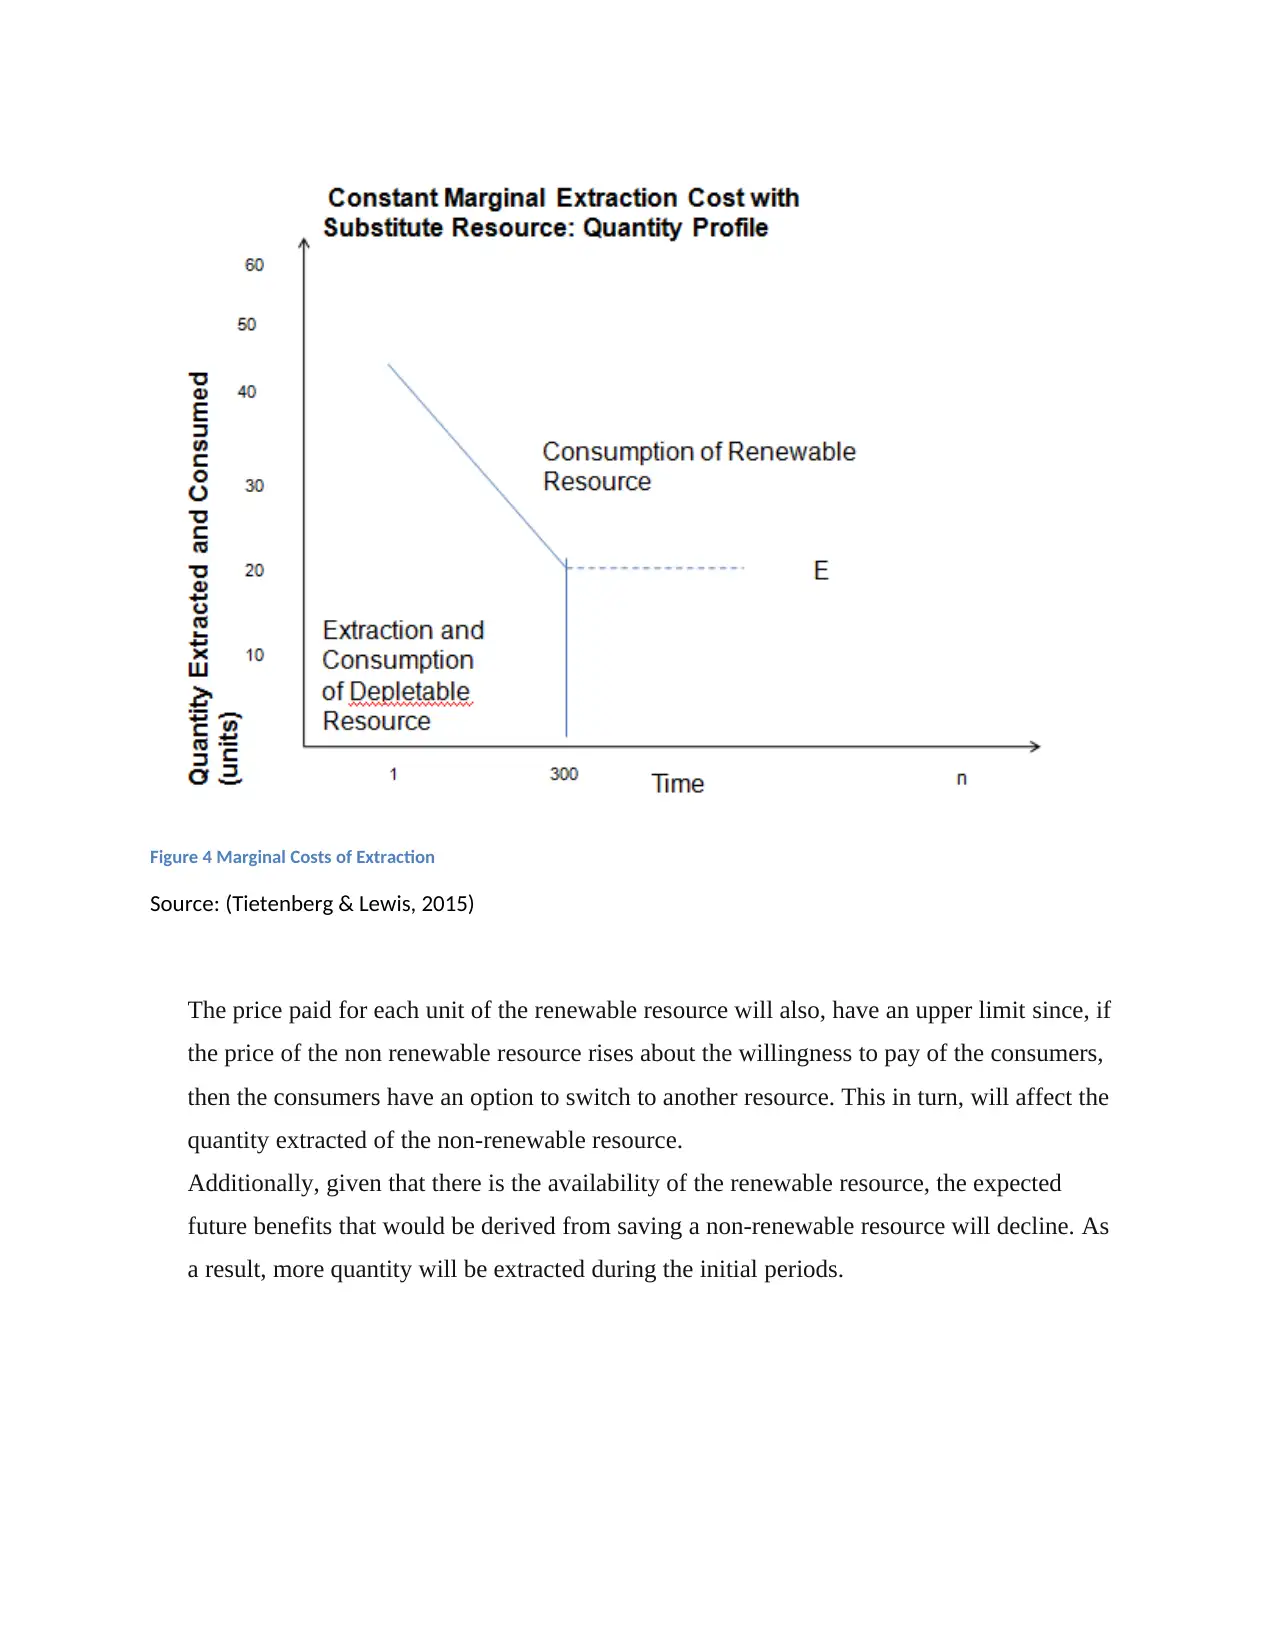
Figure 4 Marginal Costs of Extraction
Source: (Tietenberg & Lewis, 2015)
The price paid for each unit of the renewable resource will also, have an upper limit since, if
the price of the non renewable resource rises about the willingness to pay of the consumers,
then the consumers have an option to switch to another resource. This in turn, will affect the
quantity extracted of the non-renewable resource.
Additionally, given that there is the availability of the renewable resource, the expected
future benefits that would be derived from saving a non-renewable resource will decline. As
a result, more quantity will be extracted during the initial periods.
Paraphrase This Document
Need a fresh take? Get an instant paraphrase of this document with our AI Paraphraser
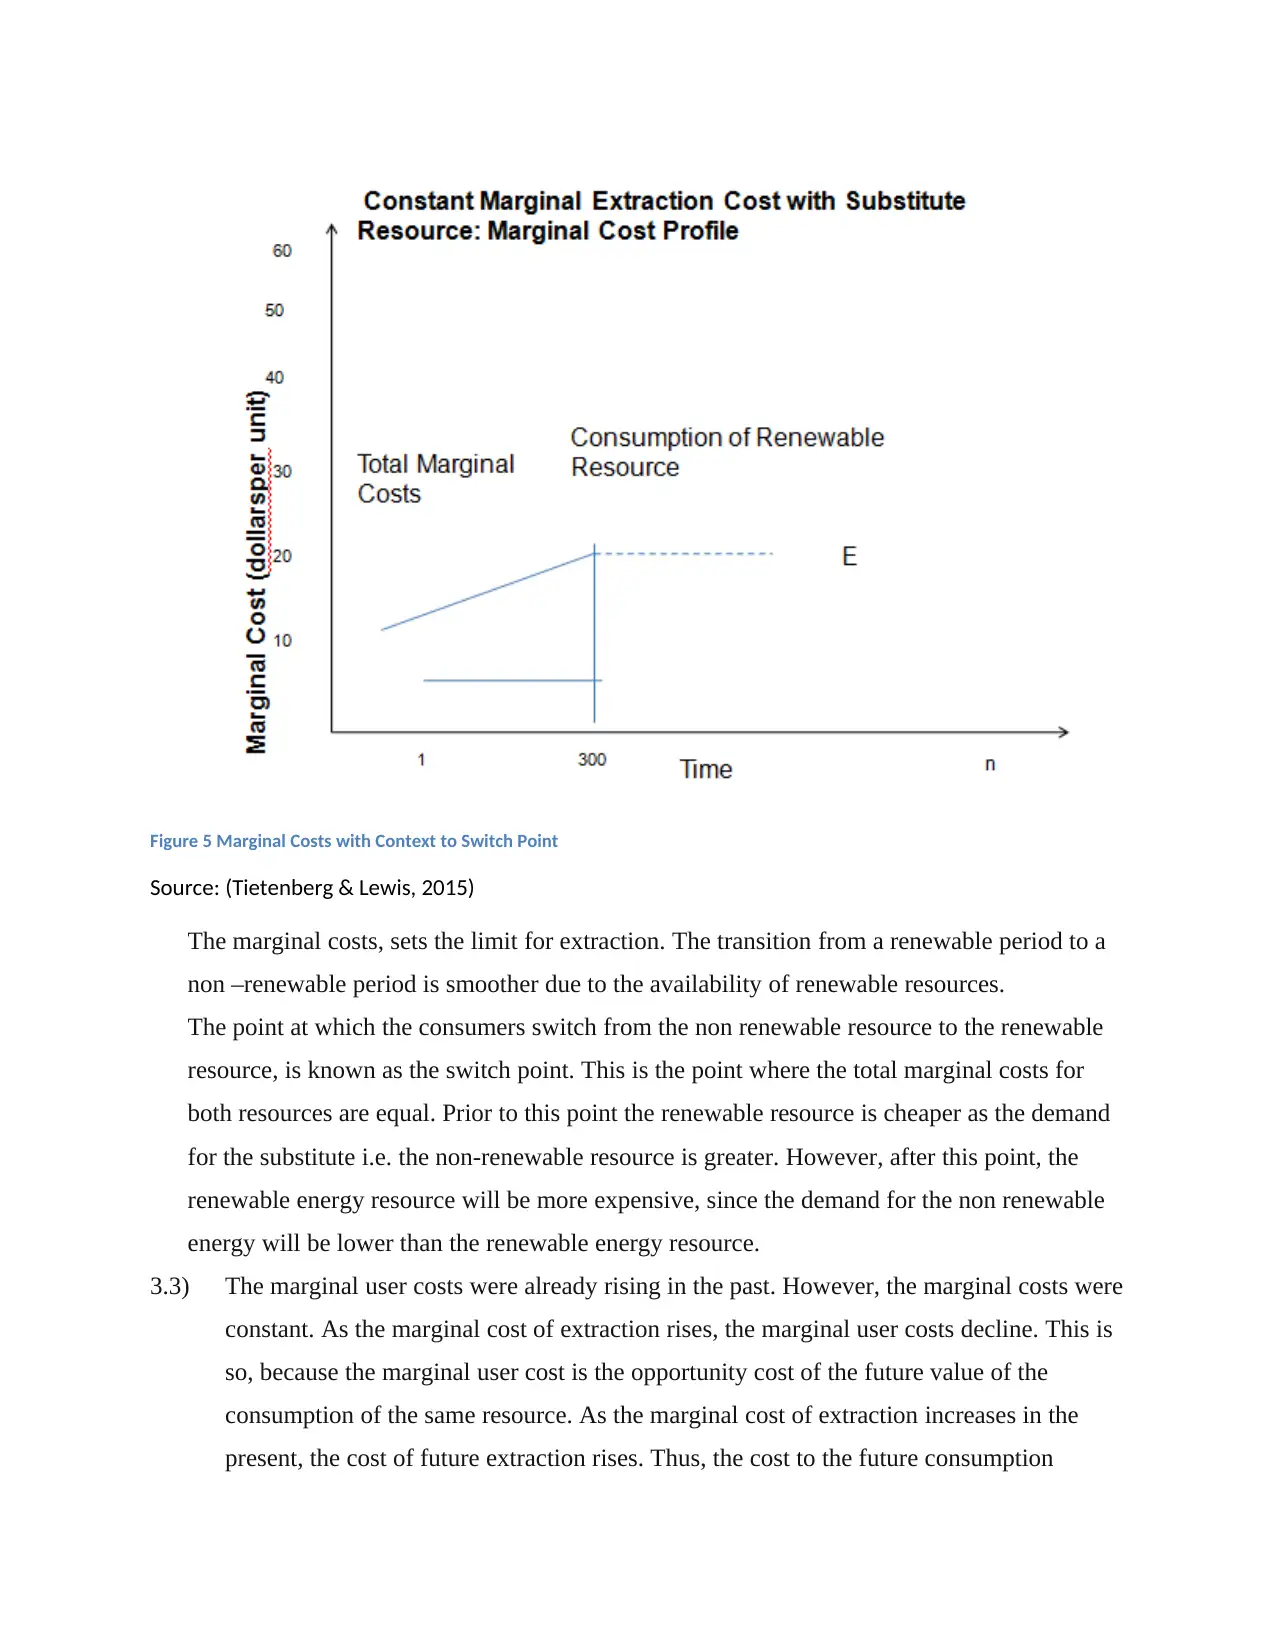
Figure 5 Marginal Costs with Context to Switch Point
Source: (Tietenberg & Lewis, 2015)
The marginal costs, sets the limit for extraction. The transition from a renewable period to a
non –renewable period is smoother due to the availability of renewable resources.
The point at which the consumers switch from the non renewable resource to the renewable
resource, is known as the switch point. This is the point where the total marginal costs for
both resources are equal. Prior to this point the renewable resource is cheaper as the demand
for the substitute i.e. the non-renewable resource is greater. However, after this point, the
renewable energy resource will be more expensive, since the demand for the non renewable
energy will be lower than the renewable energy resource.
3.3) The marginal user costs were already rising in the past. However, the marginal costs were
constant. As the marginal cost of extraction rises, the marginal user costs decline. This is
so, because the marginal user cost is the opportunity cost of the future value of the
consumption of the same resource. As the marginal cost of extraction increases in the
present, the cost of future extraction rises. Thus, the cost to the future consumption
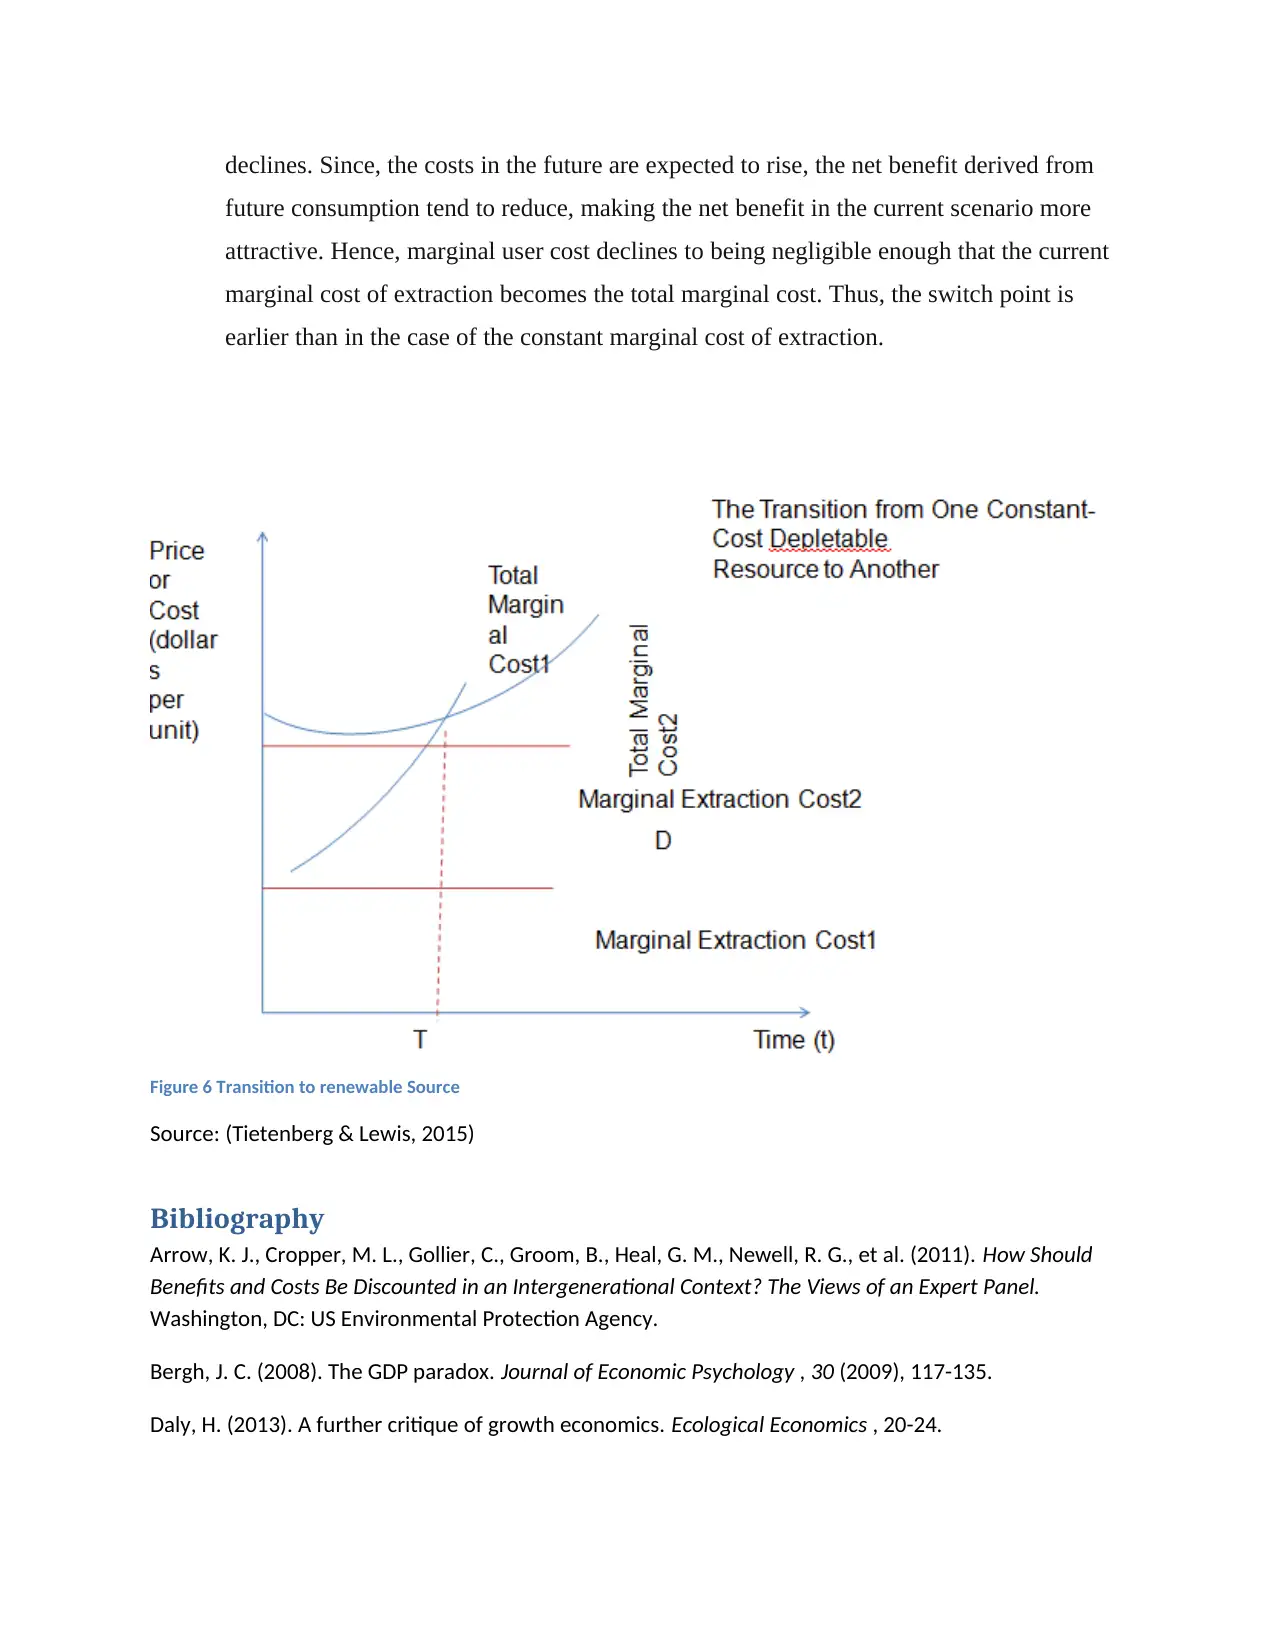
declines. Since, the costs in the future are expected to rise, the net benefit derived from
future consumption tend to reduce, making the net benefit in the current scenario more
attractive. Hence, marginal user cost declines to being negligible enough that the current
marginal cost of extraction becomes the total marginal cost. Thus, the switch point is
earlier than in the case of the constant marginal cost of extraction.
Figure 6 Transition to renewable Source
Source: (Tietenberg & Lewis, 2015)
Bibliography
Arrow, K. J., Cropper, M. L., Gollier, C., Groom, B., Heal, G. M., Newell, R. G., et al. (2011). How Should
Benefits and Costs Be Discounted in an Intergenerational Context? The Views of an Expert Panel.
Washington, DC: US Environmental Protection Agency.
Bergh, J. C. (2008). The GDP paradox. Journal of Economic Psychology , 30 (2009), 117-135.
Daly, H. (2013). A further critique of growth economics. Ecological Economics , 20-24.
⊘ This is a preview!⊘
Do you want full access?
Subscribe today to unlock all pages.
Trusted by 1+ million students worldwide
1 out of 13
Related Documents


Your All-in-One AI-Powered Toolkit for Academic Success.
+13062052269
info@desklib.com
Available 24*7 on WhatsApp / Email
![[object Object]](/_next/static/media/star-bottom.7253800d.svg)
Unlock your academic potential
Copyright © 2020–2026 A2Z Services. All Rights Reserved. Developed and managed by ZUCOL.