Microeconomics Assignment: Production, Elasticity, and Taxation

Verified

Added on  2019/11/26

|11
|1665
|122
Homework Assignment
AI Summary
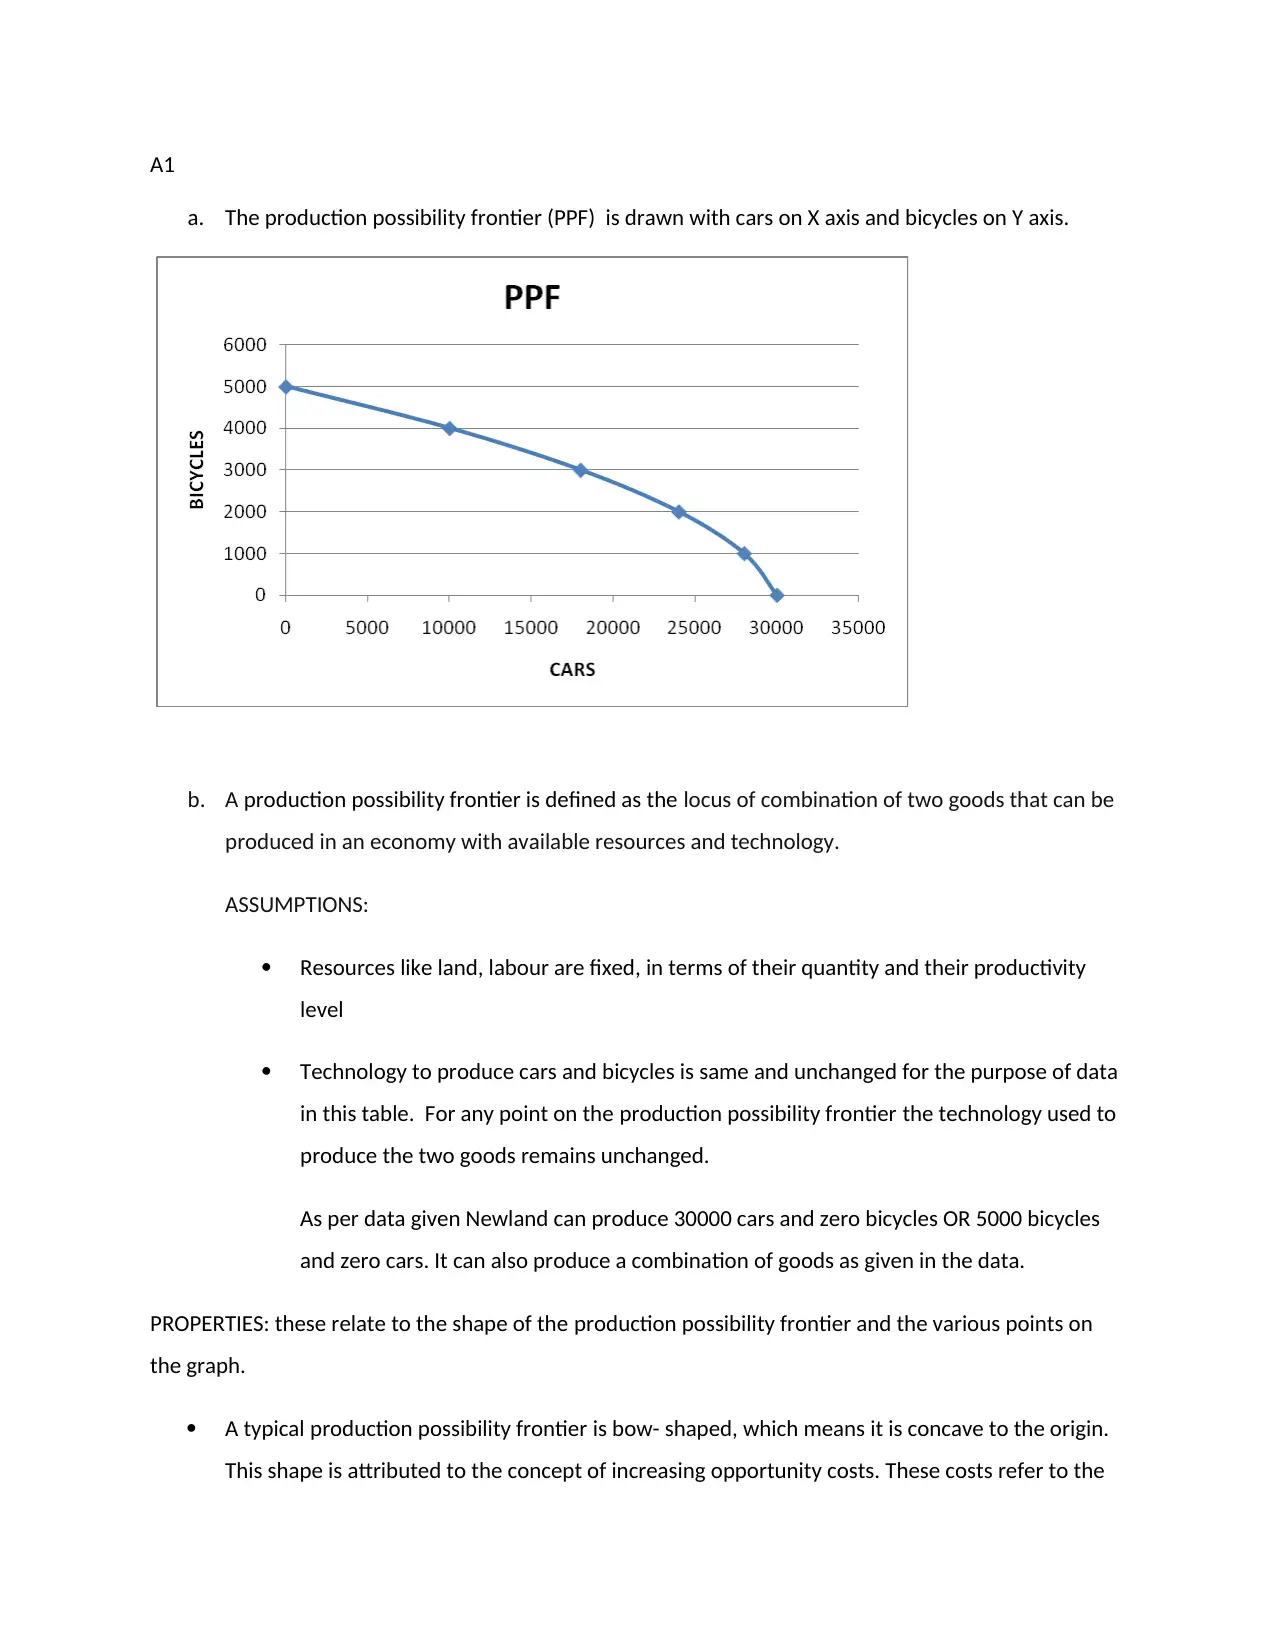
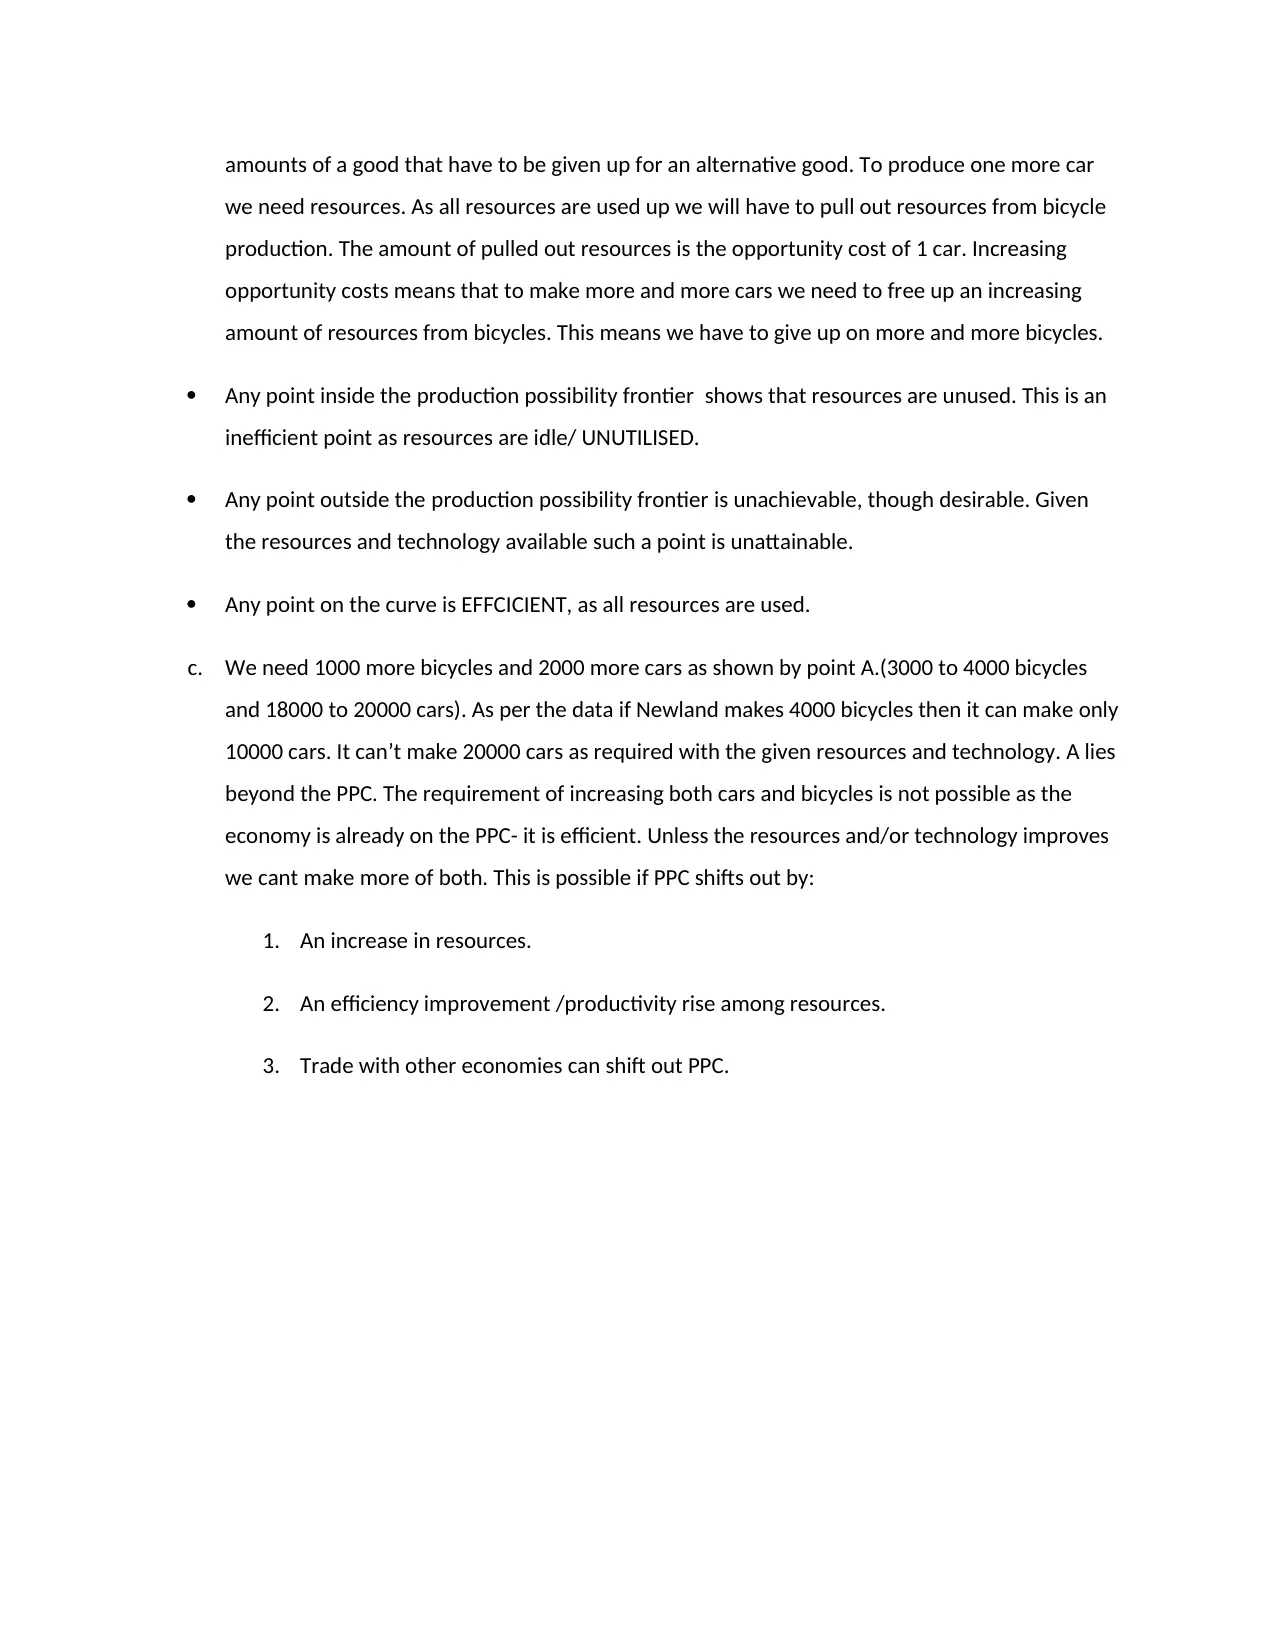
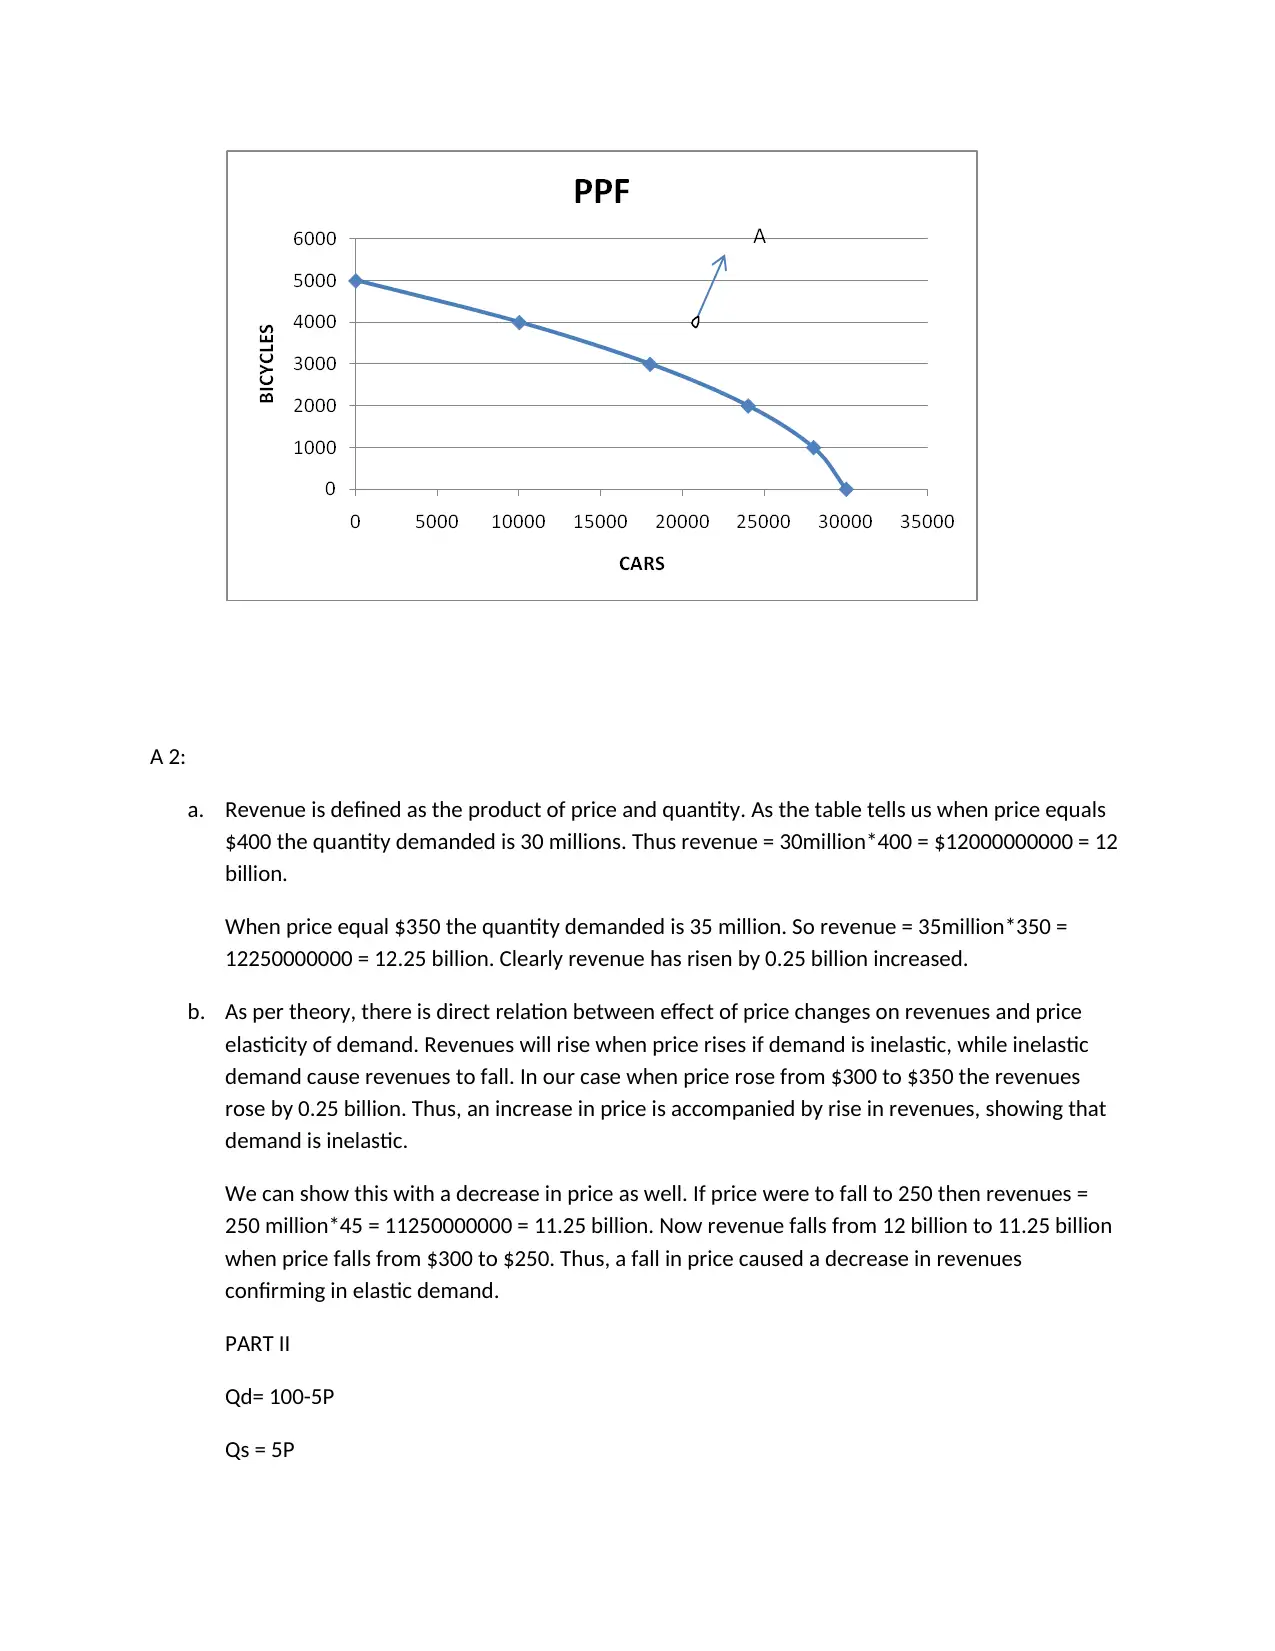
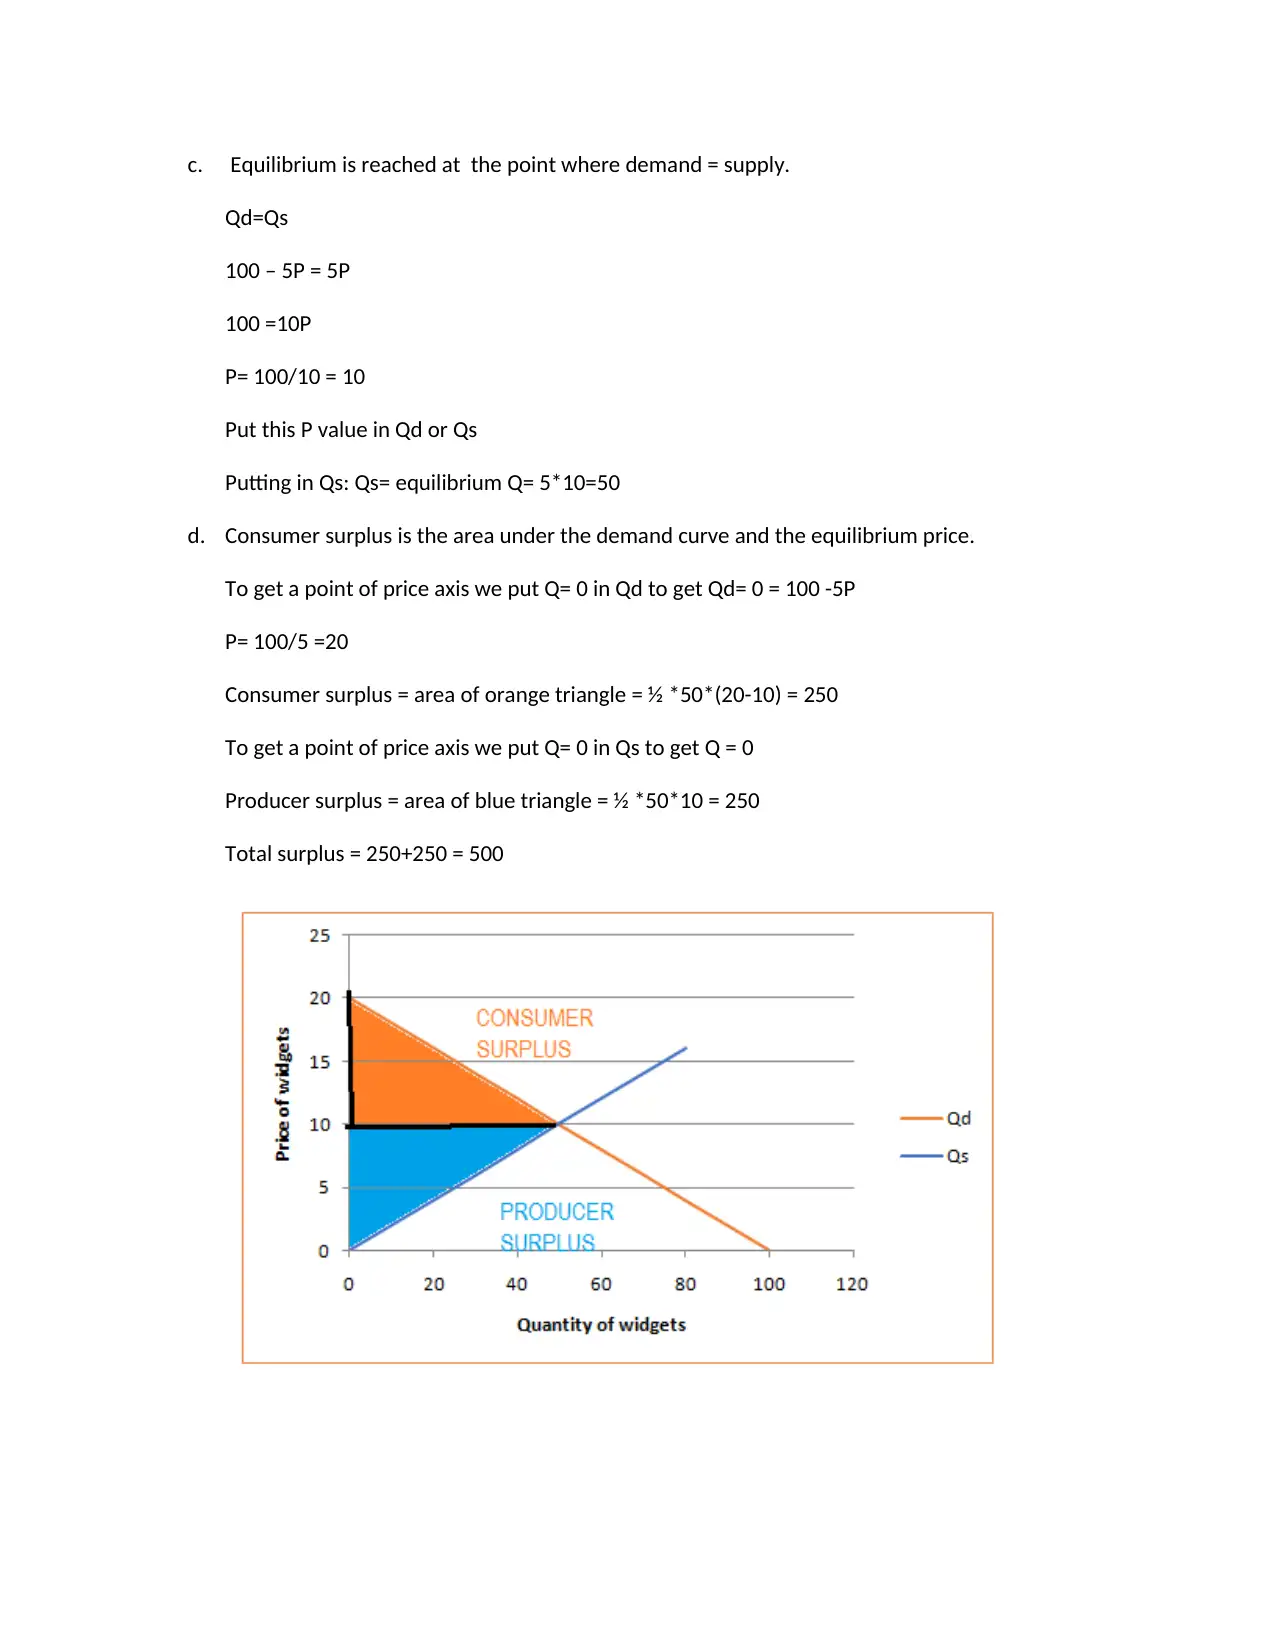
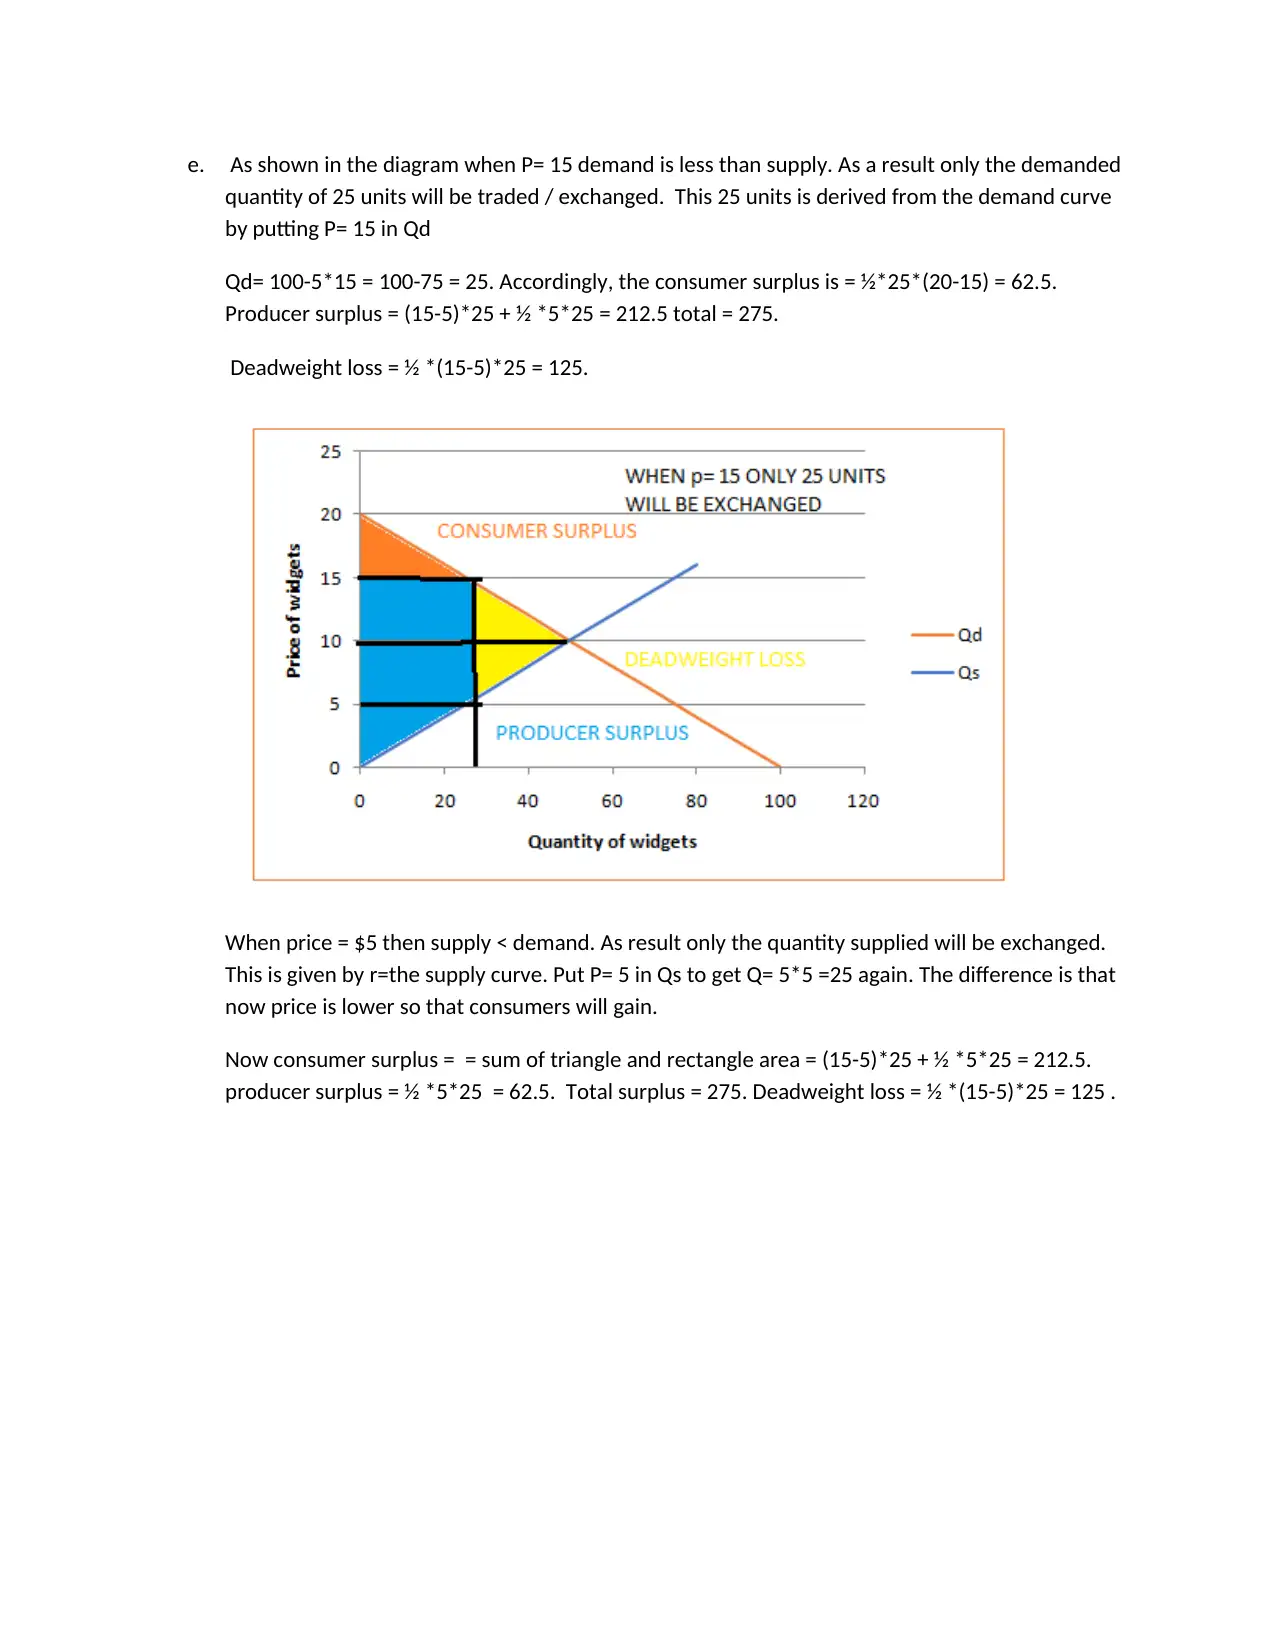
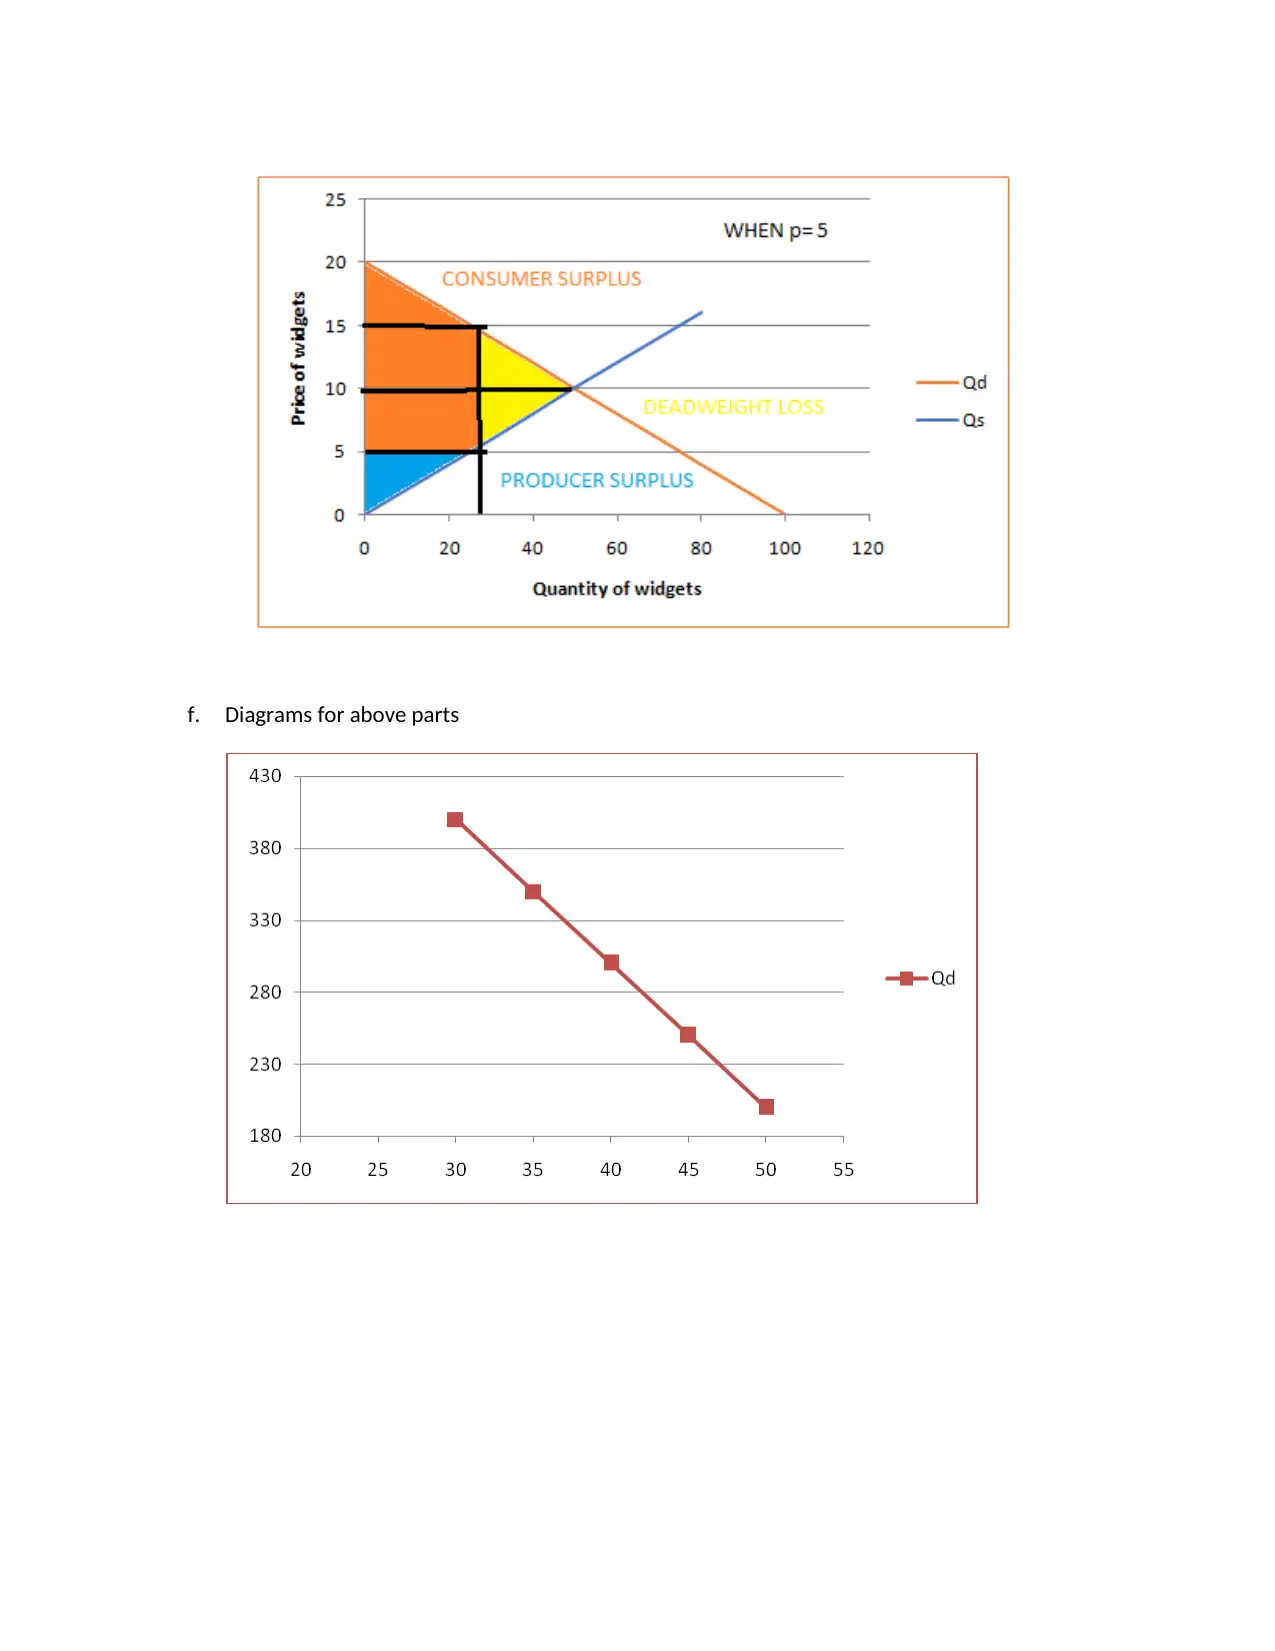
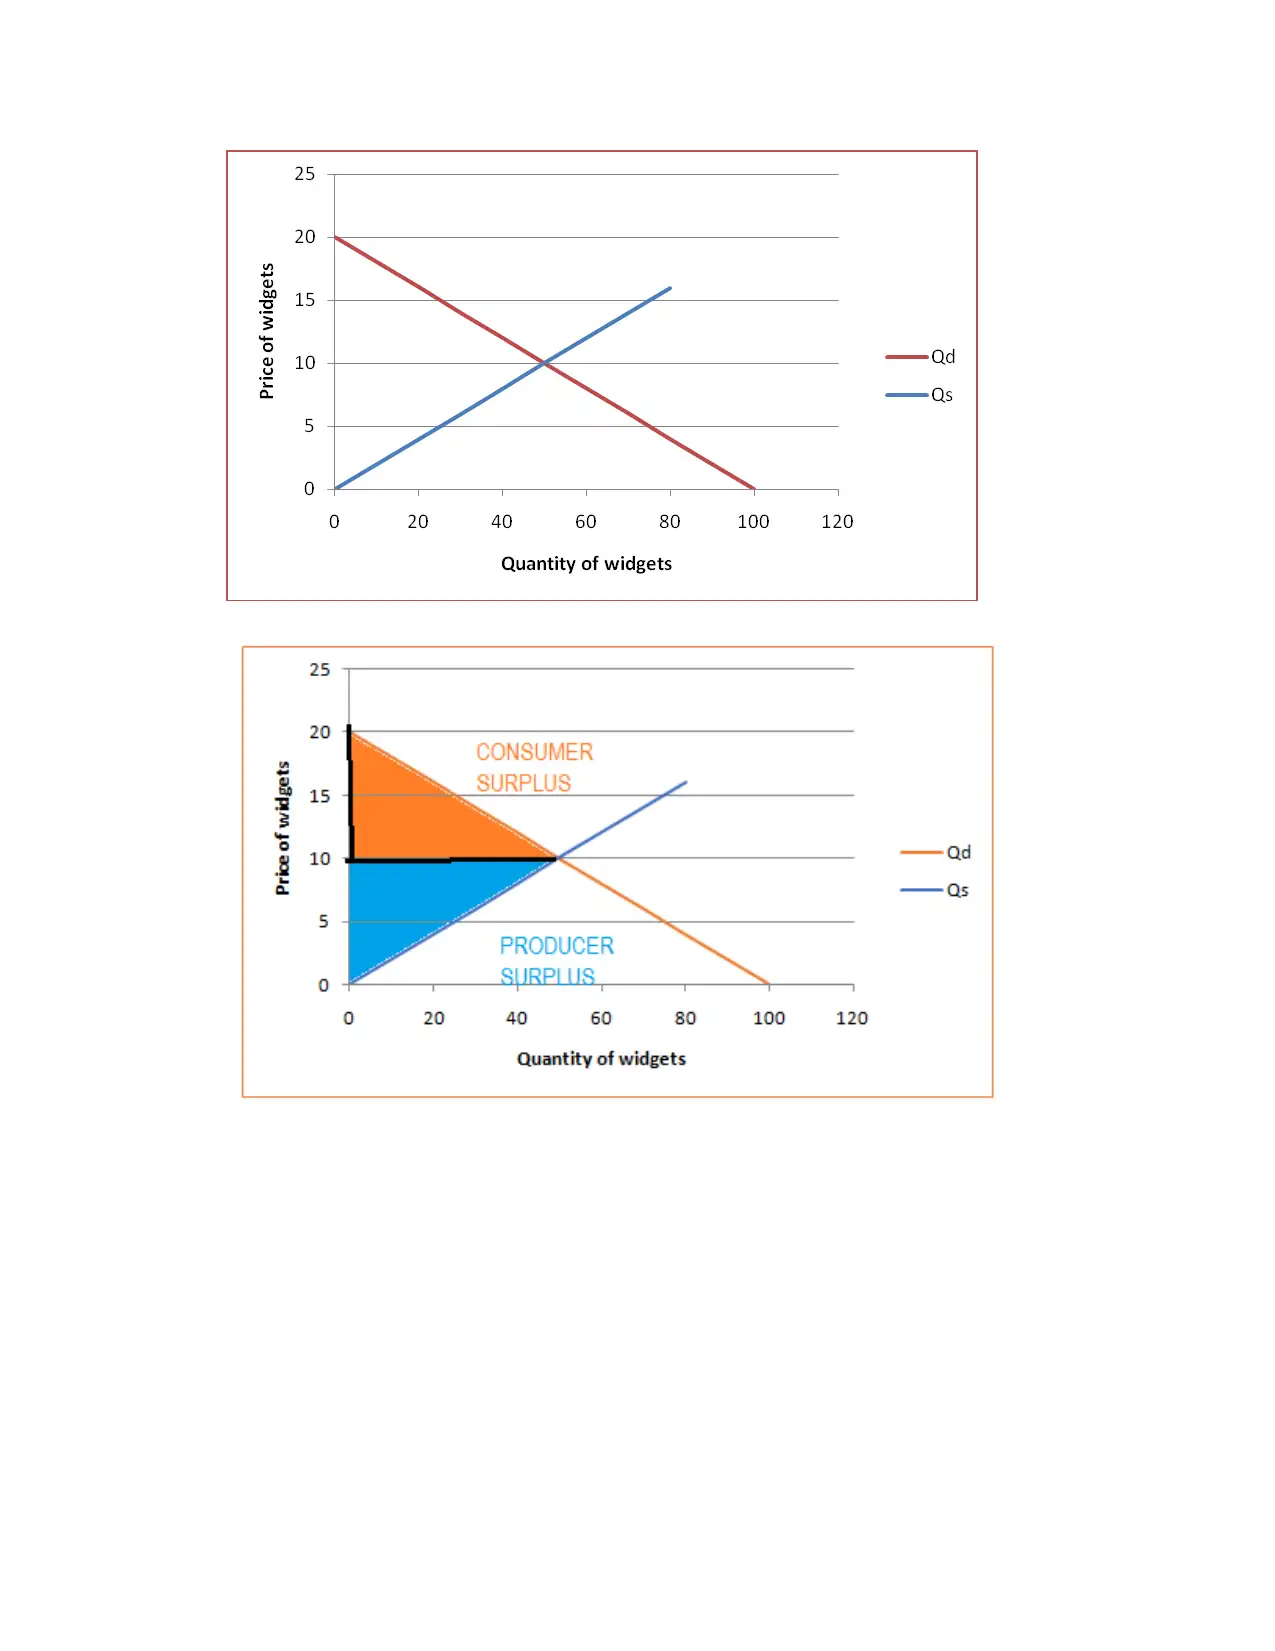
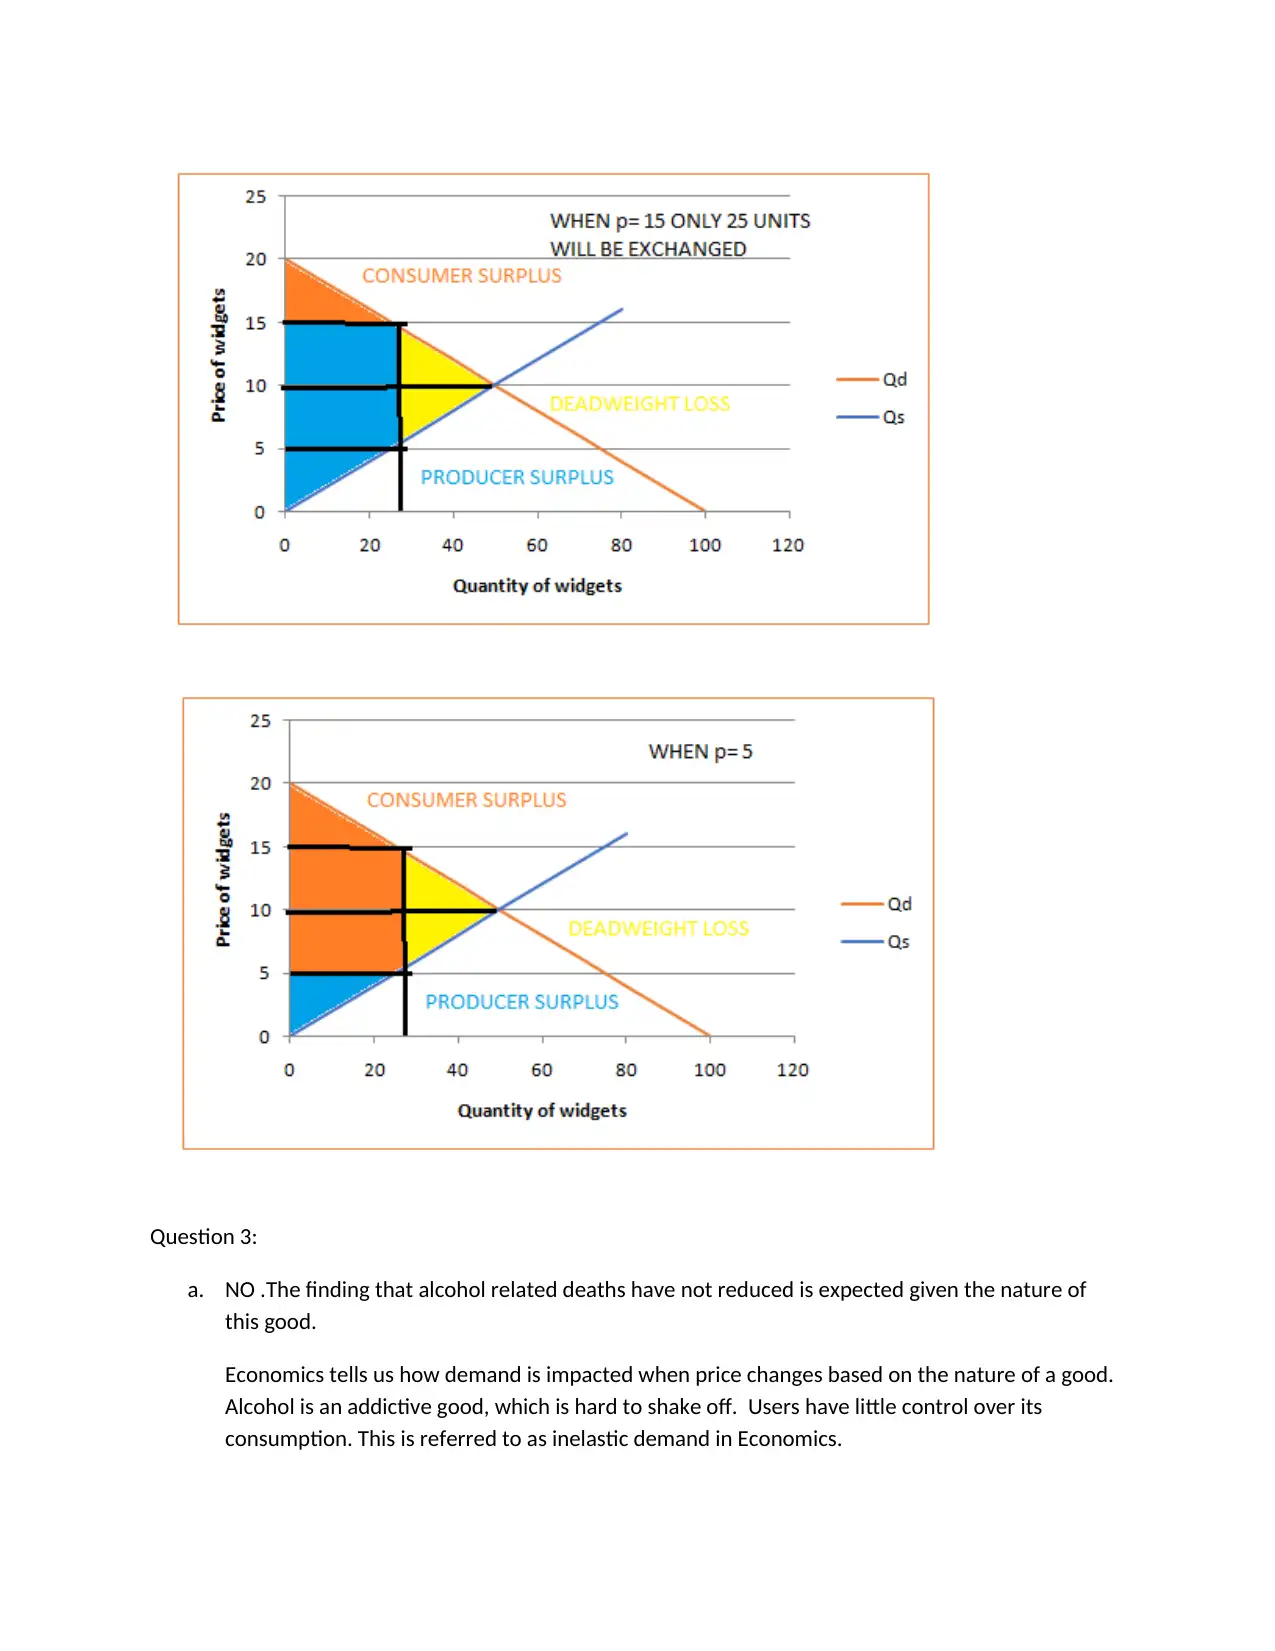
This economics assignment solution delves into several core microeconomic concepts. The first part analyzes a production possibility frontier (PPF), illustrating opportunity costs, efficiency, and the impact of resource changes. The second part explores price elasticity of demand, calculating revenue changes and demonstrating inelastic demand. It then proceeds to a market equilibrium analysis, determining consumer and producer surplus, and illustrating deadweight loss under price controls. The final section examines the effects of taxation on an addictive good, explaining why price-based interventions are ineffective due to inelastic demand and discussing the incidence of tax. It concludes by suggesting non-price interventions for reducing consumption.
Document Page
A1
a. The production possibility frontier (PPF) is drawn with cars on X axis and bicycles on Y axis.
b. A production possibility frontier is defined as the locus of combination of two goods that can be
produced in an economy with available resources and technology.
ASSUMPTIONS:
Resources like land, labour are fixed, in terms of their quantity and their productivity
level
Technology to produce cars and bicycles is same and unchanged for the purpose of data
in this table. For any point on the production possibility frontier the technology used to
produce the two goods remains unchanged.
As per data given Newland can produce 30000 cars and zero bicycles OR 5000 bicycles
and zero cars. It can also produce a combination of goods as given in the data.
PROPERTIES: these relate to the shape of the production possibility frontier and the various points on
the graph.
A typical production possibility frontier is bow- shaped, which means it is concave to the origin.
This shape is attributed to the concept of increasing opportunity costs. These costs refer to the
tabler-icon-diamond-filled.svg

Paraphrase This Document

Need a fresh take? Get an instant paraphrase of this document with our AI Paraphraser
Document Page
amounts of a good that have to be given up for an alternative good. To produce one more car
we need resources. As all resources are used up we will have to pull out resources from bicycle
production. The amount of pulled out resources is the opportunity cost of 1 car. Increasing
opportunity costs means that to make more and more cars we need to free up an increasing
amount of resources from bicycles. This means we have to give up on more and more bicycles.
Any point inside the production possibility frontier shows that resources are unused. This is an
inefficient point as resources are idle/ UNUTILISED.
Any point outside the production possibility frontier is unachievable, though desirable. Given
the resources and technology available such a point is unattainable.
Any point on the curve is EFFCICIENT, as all resources are used.
c. We need 1000 more bicycles and 2000 more cars as shown by point A.(3000 to 4000 bicycles
and 18000 to 20000 cars). As per the data if Newland makes 4000 bicycles then it can make only
10000 cars. It can’t make 20000 cars as required with the given resources and technology. A lies
beyond the PPC. The requirement of increasing both cars and bicycles is not possible as the
economy is already on the PPC- it is efficient. Unless the resources and/or technology improves
we cant make more of both. This is possible if PPC shifts out by:
1. An increase in resources.
2. An efficiency improvement /productivity rise among resources.
3. Trade with other economies can shift out PPC.
Document Page
A 2:
a. Revenue is defined as the product of price and quantity. As the table tells us when price equals
$400 the quantity demanded is 30 millions. Thus revenue = 30million*400 = $12000000000 = 12
billion.
When price equal $350 the quantity demanded is 35 million. So revenue = 35million*350 =
12250000000 = 12.25 billion. Clearly revenue has risen by 0.25 billion increased.
b. As per theory, there is direct relation between effect of price changes on revenues and price
elasticity of demand. Revenues will rise when price rises if demand is inelastic, while inelastic
demand cause revenues to fall. In our case when price rose from $300 to $350 the revenues
rose by 0.25 billion. Thus, an increase in price is accompanied by rise in revenues, showing that
demand is inelastic.
We can show this with a decrease in price as well. If price were to fall to 250 then revenues =
250 million*45 = 11250000000 = 11.25 billion. Now revenue falls from 12 billion to 11.25 billion
when price falls from $300 to $250. Thus, a fall in price caused a decrease in revenues
confirming in elastic demand.
PART II
Qd= 100-5P
Qs = 5P
Document Page
c. Equilibrium is reached at the point where demand = supply.
Qd=Qs
100 – 5P = 5P
100 =10P
P= 100/10 = 10
Put this P value in Qd or Qs
Putting in Qs: Qs= equilibrium Q= 5*10=50
d. Consumer surplus is the area under the demand curve and the equilibrium price.
To get a point of price axis we put Q= 0 in Qd to get Qd= 0 = 100 -5P
P= 100/5 =20
Consumer surplus = area of orange triangle = ½ *50*(20-10) = 250
To get a point of price axis we put Q= 0 in Qs to get Q = 0
Producer surplus = area of blue triangle = ½ *50*10 = 250
Total surplus = 250+250 = 500
tabler-icon-diamond-filled.svg

Paraphrase This Document

Need a fresh take? Get an instant paraphrase of this document with our AI Paraphraser
Document Page
e. As shown in the diagram when P= 15 demand is less than supply. As a result only the demanded
quantity of 25 units will be traded / exchanged. This 25 units is derived from the demand curve
by putting P= 15 in Qd
Qd= 100-5*15 = 100-75 = 25. Accordingly, the consumer surplus is = ½*25*(20-15) = 62.5.
Producer surplus = (15-5)*25 + ½ *5*25 = 212.5 total = 275.
Deadweight loss = ½ *(15-5)*25 = 125.
When price = $5 then supply < demand. As result only the quantity supplied will be exchanged.
This is given by r=the supply curve. Put P= 5 in Qs to get Q= 5*5 =25 again. The difference is that
now price is lower so that consumers will gain.
Now consumer surplus = = sum of triangle and rectangle area = (15-5)*25 + ½ *5*25 = 212.5.
producer surplus = ½ *5*25 = 62.5. Total surplus = 275. Deadweight loss = ½ *(15-5)*25 = 125 .
Document Page
f. Diagrams for above parts
Document Page
tabler-icon-diamond-filled.svg

Paraphrase This Document

Need a fresh take? Get an instant paraphrase of this document with our AI Paraphraser
Document Page
Question 3:
a. NO .The finding that alcohol related deaths have not reduced is expected given the nature of
this good.
Economics tells us how demand is impacted when price changes based on the nature of a good.
Alcohol is an addictive good, which is hard to shake off. Users have little control over its
consumption. This is referred to as inelastic demand in Economics.
Document Page
With an inelastic demand any tax imposition does not reduce consumption considerably as
demand is inflexible and refuses to change. Consider the diagram below where a black line
shows an inelastic demand as the line is drawn steep. When a tax is imposed, it is shown as an
upward shift of supply curve shown in red. The new equilibrium is at a higher price and lower
consumption.
If demand was elastic as shown in blue curve, elastic D then the fall in quantity with same tax
would be much larger as shown, and the rise in price would be lower. This can be seen from the
smaller blue arrow as compared to the taller black arrow for the price axis. The absence of
reduction in consumption of drinks and alcohol related harm is indicative of inelastic demand.
As per theory, when demand is inelastic, revenues also rise with a rise in price. The revenue
gains further confirm the nature of demand as being inelastic.
b. The incidence of tax refers to the final payer of the tax. It is shared between the consumer and
producer. It is based on the relative strength of price elasticity of demand and supply. The ratio
of consumer burden to producer burden, is directly related to the ratio of price elasticity of
supply to price elasticity of demand.
If demand elasticity is lower than supply elasticity then the incidence falls more on the
consumer. Using the same diagram as above , but removing the elastic demand curve in blue we
can see that consumer burden is more than producer burden. As our demand is inelastic, the
green vertical line shows the price rise that consumer bears. The producer faces a small rise in
price as shown by the vertical line in blue.
Document Page
The imposition of tax is thus ineffective as it did not lead to lower consumption. Lower revenues
are another cause of ineffectiveness. It is also inefficient as it causes a deadweight loss as well as
puts the burden of tax on consumer.
c. The government must not use price based intervention in the market to reduce consumption. It
needs to use non price incentives like making alcohol look unfashionable- the use of movie stars
to push this message can be done. A public awareness campaign across schools can also spread
the message of ill effects of alcohol. Rehabilitation programs for those already consuming
alcohol can be run to reduce their consumption specifically. High achievers - sports persons are
an effective brand ambassador of anti alcohol programs.
tabler-icon-diamond-filled.svg

Paraphrase This Document

Need a fresh take? Get an instant paraphrase of this document with our AI Paraphraser
Document Page
References
Econ.ohio-state.edu, n.d. Elasticity. [Online] Available at:
http://www.econ.ohio-state.edu/jpeck/H200/EconH200L5.pdf [Accessed 30 May 2017].
Krpton.mnsu.edu, n.d. Production Possibility curves. [Online] Available at:
http://krypton.mnsu.edu/~cu7296vs/ppc.htm [Accessed 15 Auguat 2017].
chevron_up_icon
1 out of 11
circle_padding
hide_on_mobile
zoom_out_icon
[object Object]