Economics Assignment for Bachelor of Applied Management: March 2019
VerifiedAdded on 2022/11/26
|18
|3180
|196
Homework Assignment
AI Summary
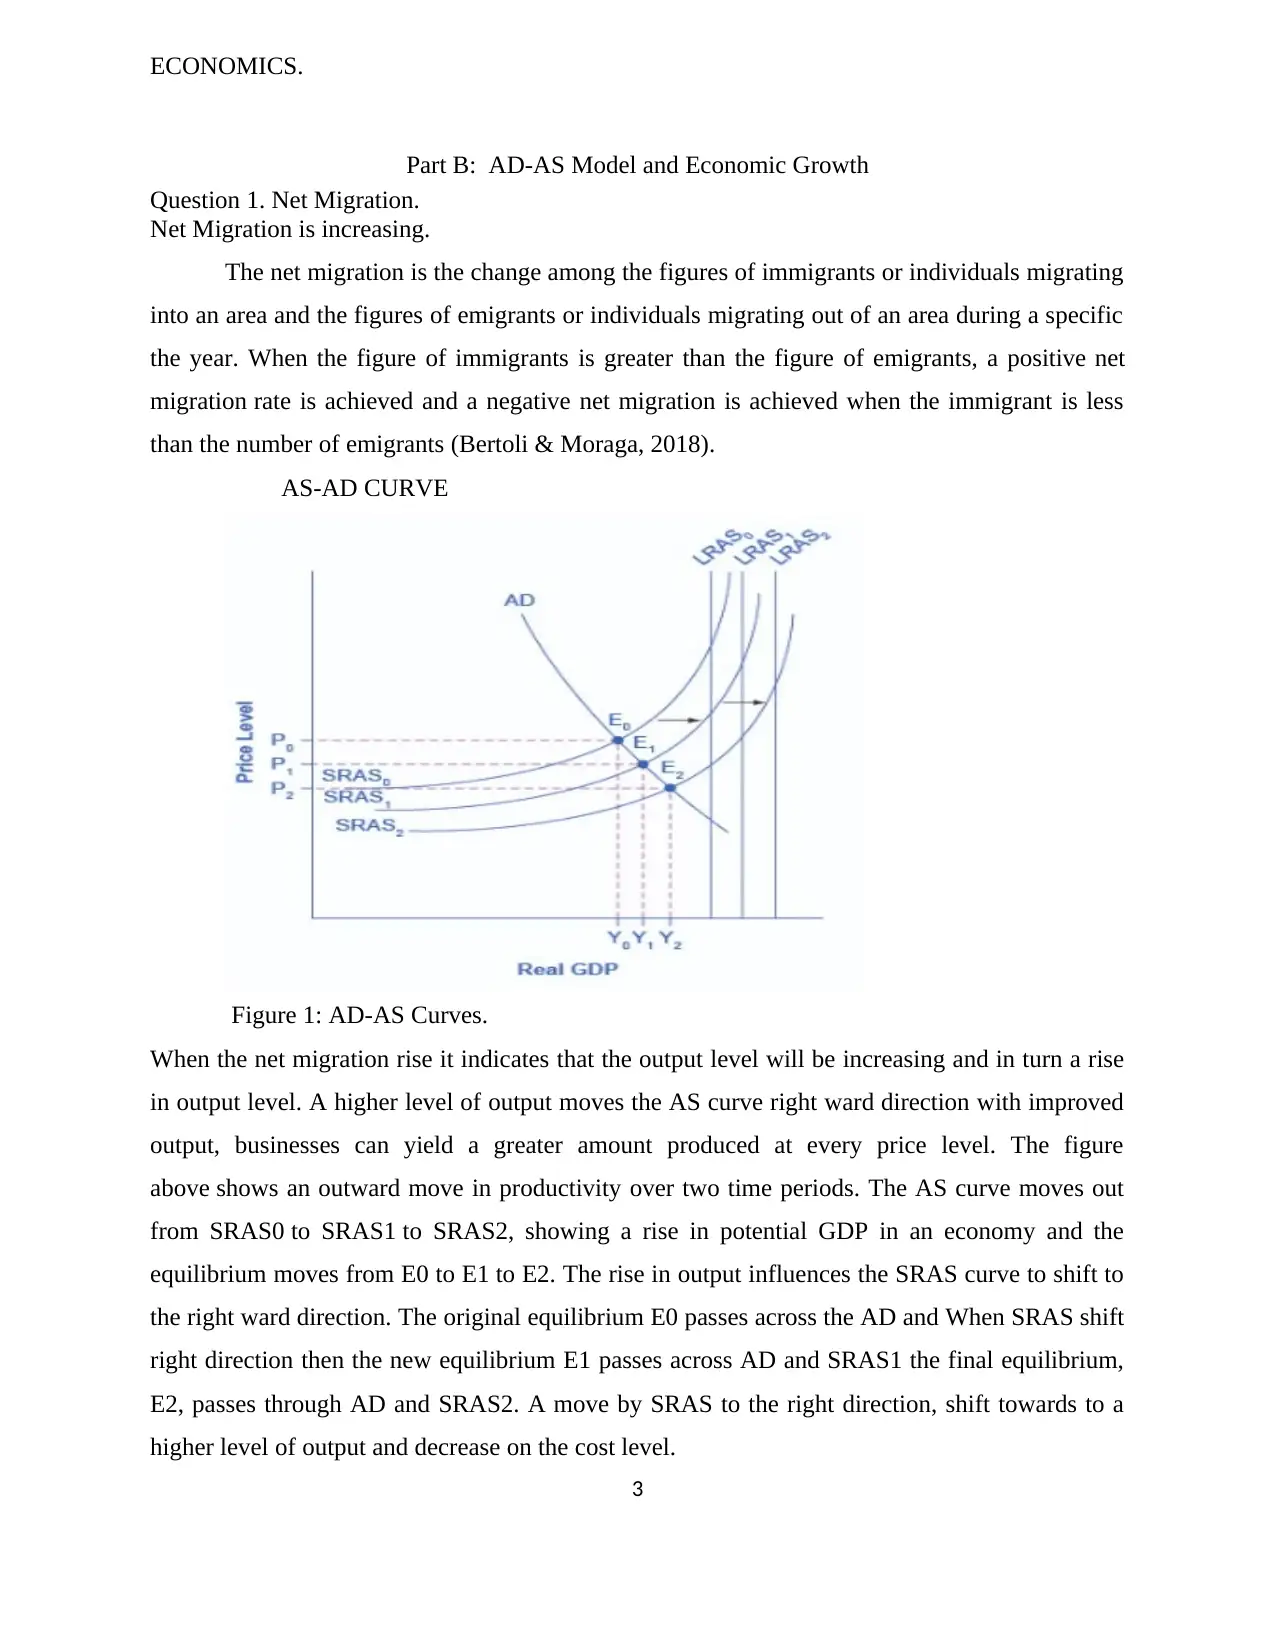
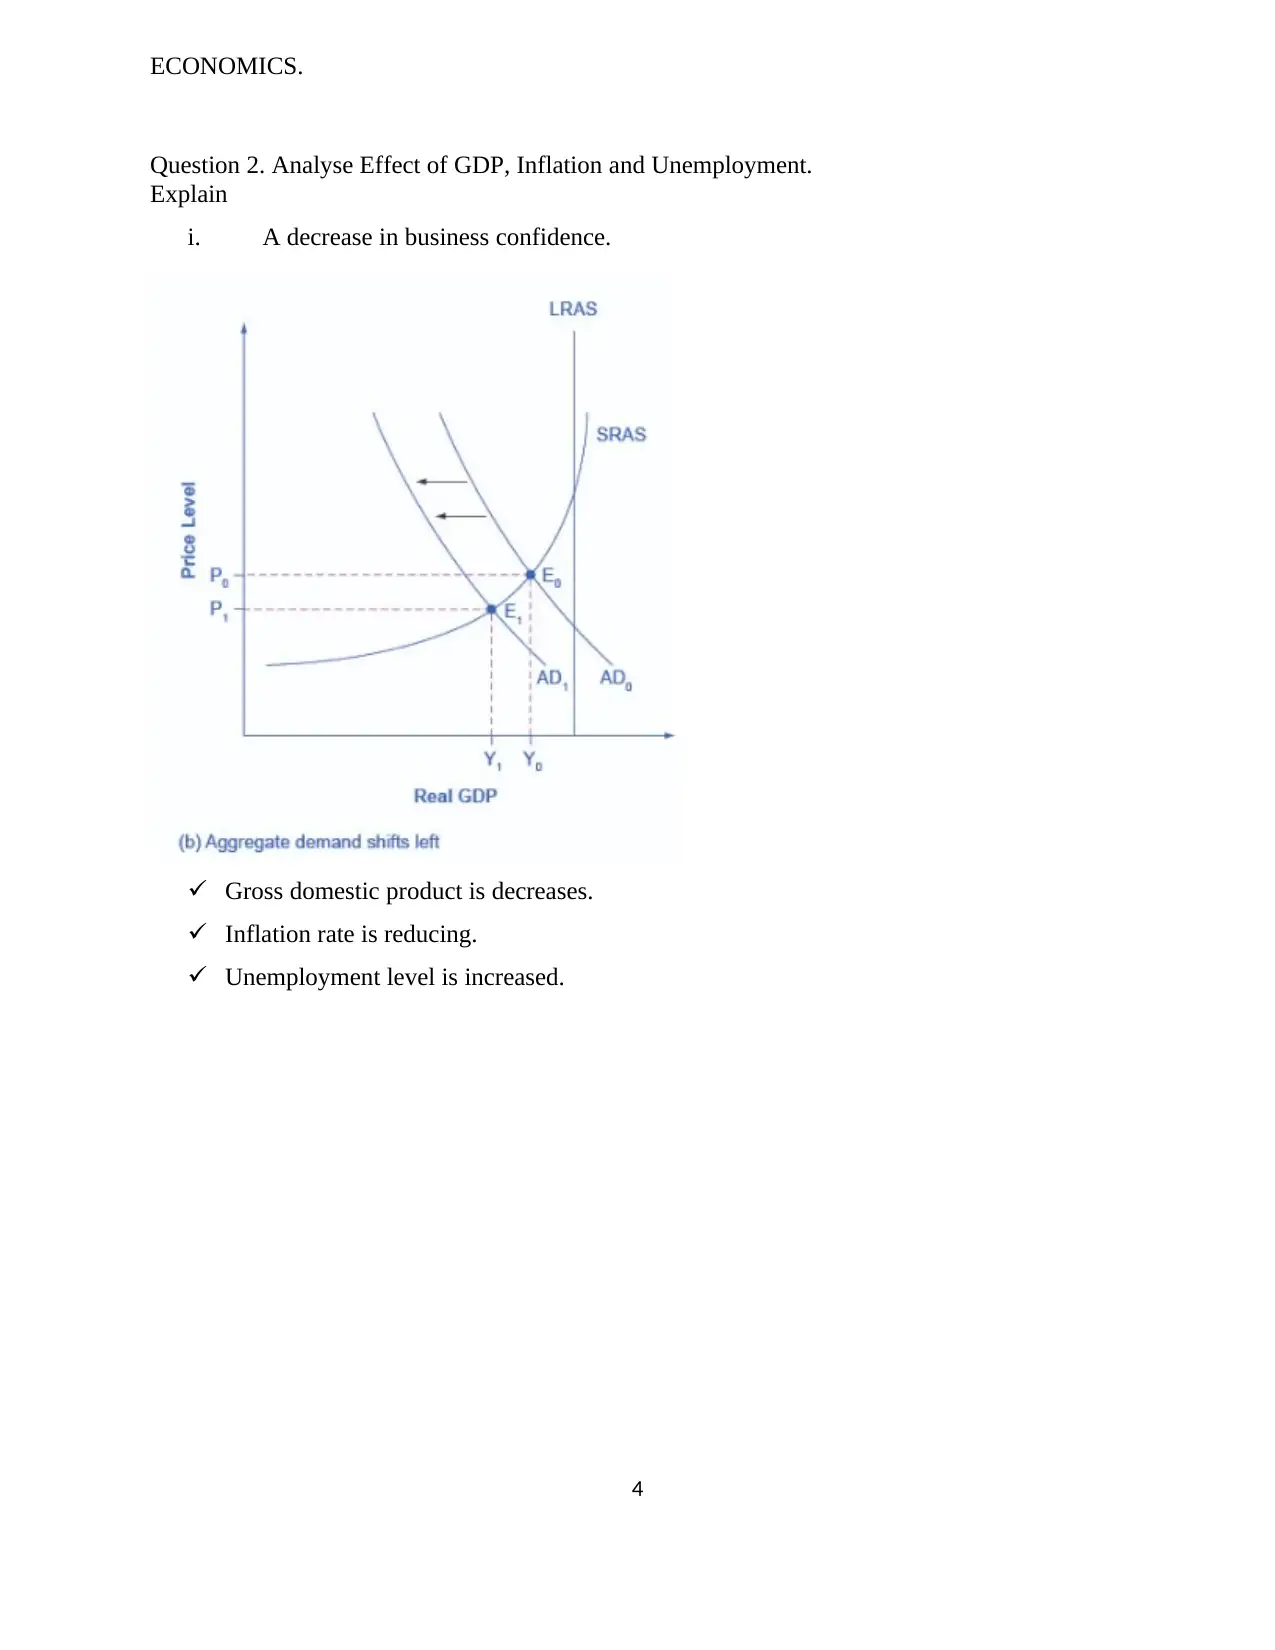
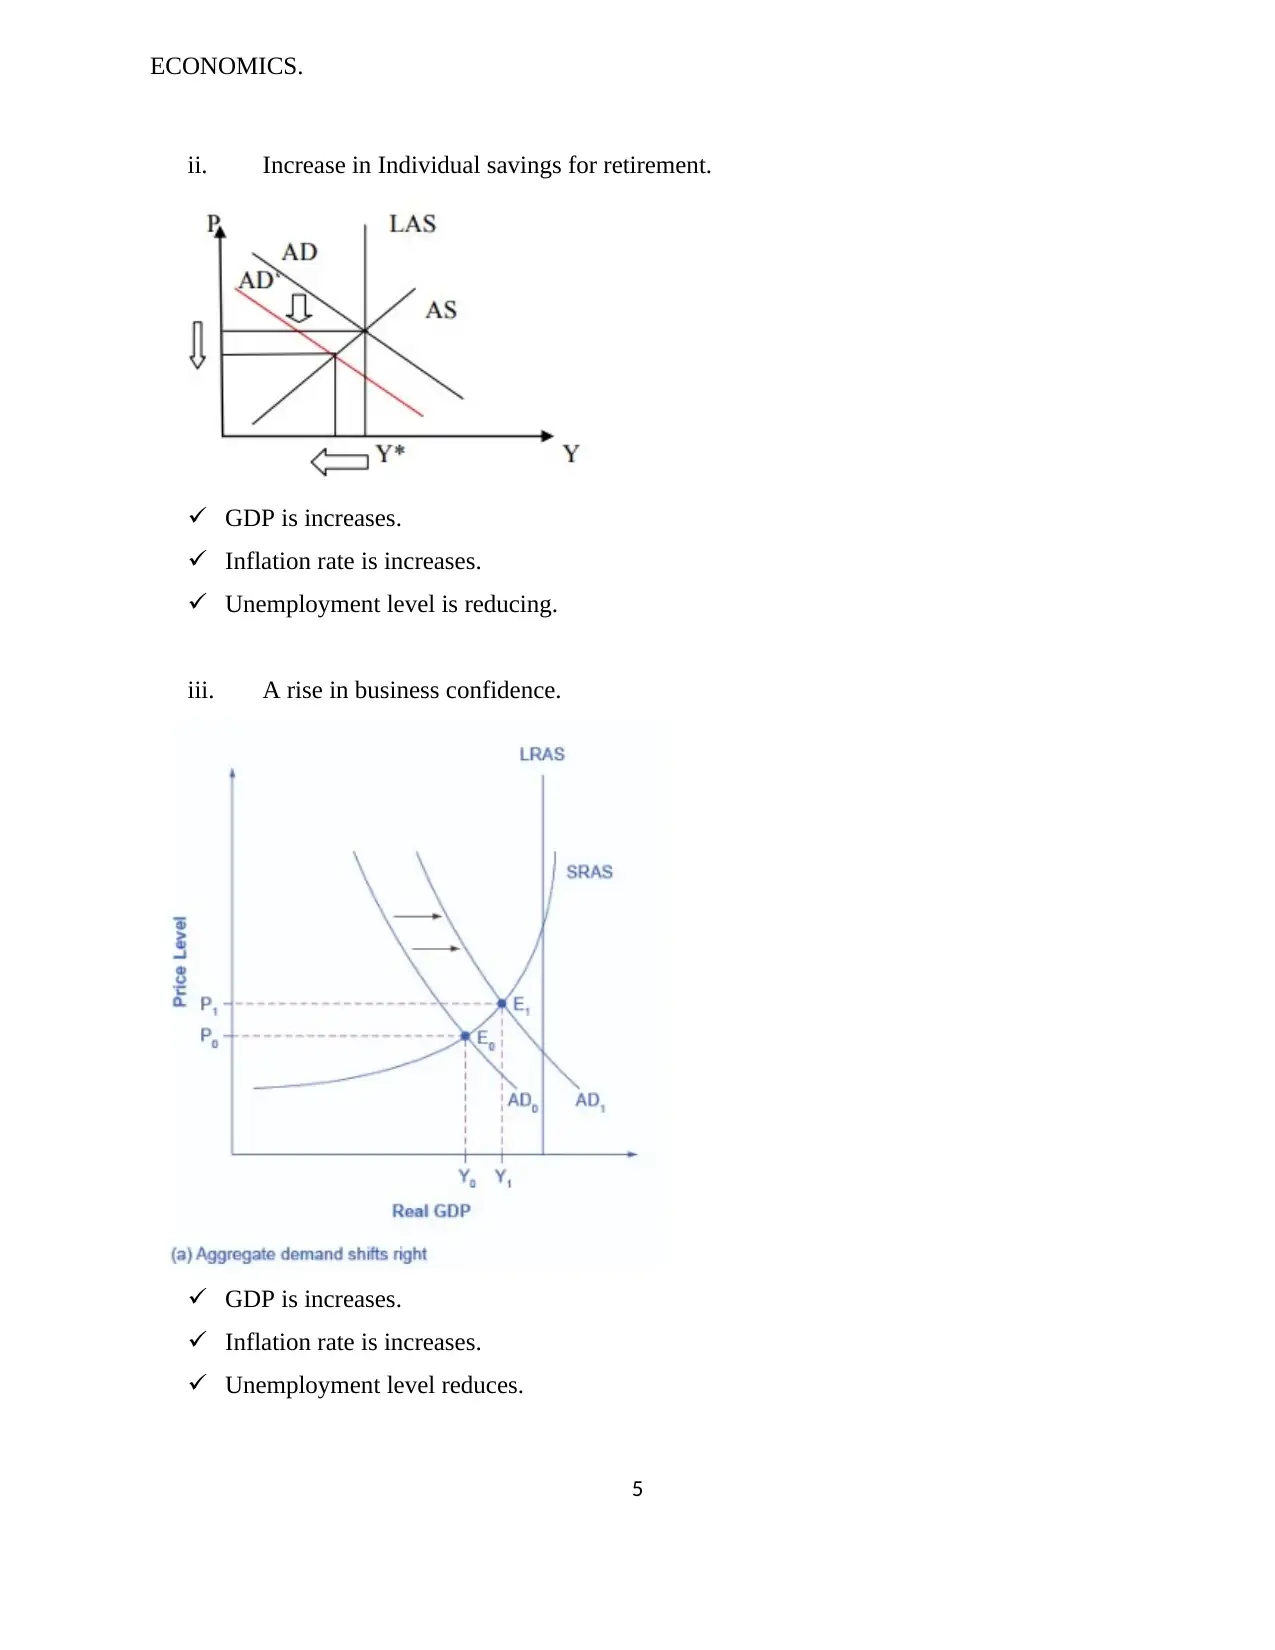
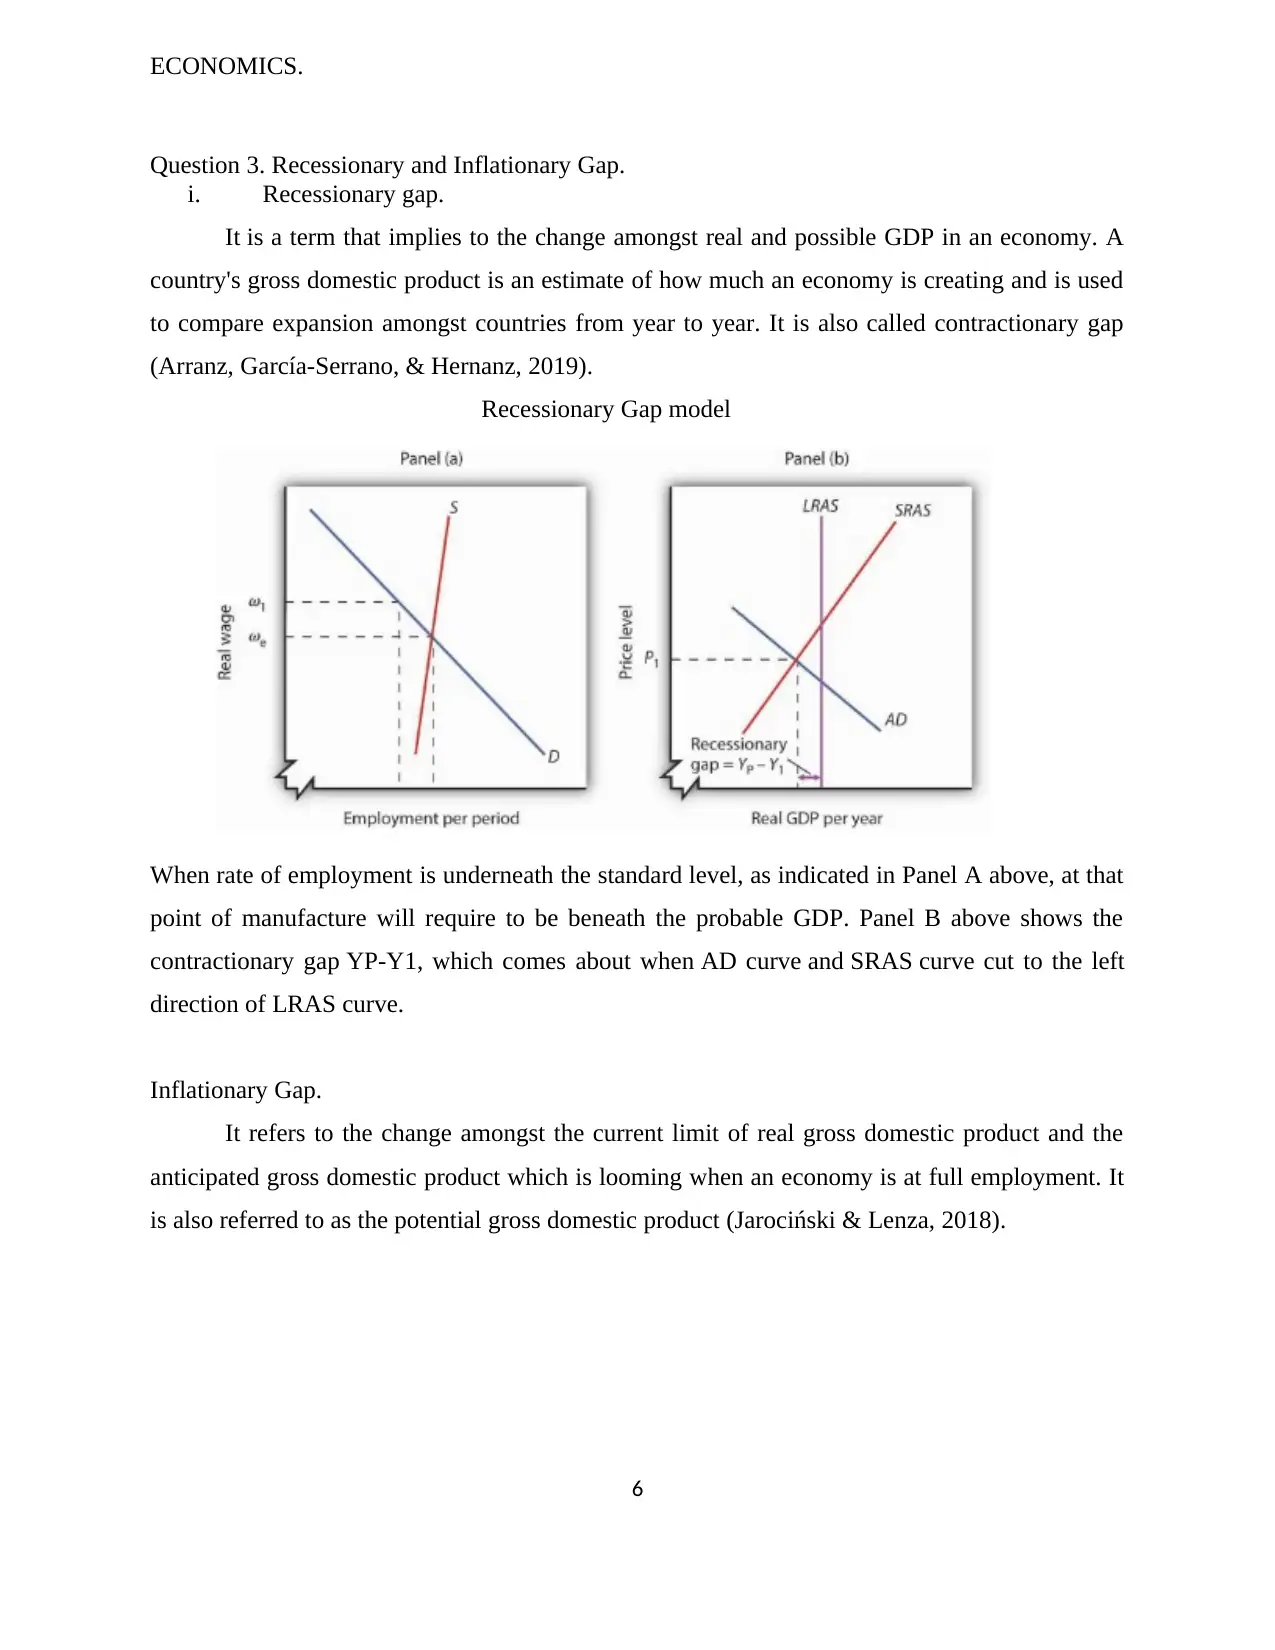
This economics assignment, completed for a Bachelor of Applied Management course, delves into various macroeconomic concepts and their applications. Part A focuses on macroeconomic concepts and models, specifically examining the Consumer Price Index (CPI) and Gross Domestic Product (GDP). Part B analyzes the AD-AS model, exploring the effects of net migration, GDP, inflation, and unemployment, along with recessionary and inflationary gaps. Part C investigates the impact of government on macroeconomic objectives, including monetary and fiscal policies. Finally, Part D explores international trade and the global economy, covering topics such as comparative advantage, balance of payments, and foreign exchange. The assignment utilizes models, graphs, and real-world examples to illustrate key economic principles and their practical implications within the New Zealand context.

Running Head: ECONOMICS
ECONOMICS ASSIGNMENT
Name:
Institution:
Date:
ECONOMICS ASSIGNMENT
Name:
Institution:
Date:
Paraphrase This Document
Need a fresh take? Get an instant paraphrase of this document with our AI Paraphraser

ECONOMICS.
Table of Contents
Part A: LO5 - Macroeconomic Concepts and Models.....................................................................1
Question 1: Consumer Price Index..............................................................................................1
Question 2: Gross Domestic Product...........................................................................................1
Part B: AD-AS Model and Economic Growth...............................................................................3
Question 1. Net Migration...........................................................................................................3
Question 2. Analyse Effect of GDP, Inflation and Unemployment.............................................4
Question 3. Recessionary and Inflationary Gap...........................................................................6
Part C: LO6 – Impact of Government on the Macroeconomic Objectives.....................................9
Question 1: Macroeconomic Objectives......................................................................................9
Question 2 Monetary Policy........................................................................................................9
Question 3. Fiscal Policy...........................................................................................................10
Part D: LO7 – International Trade and Global Economy..............................................................12
Question 1: International Trade.................................................................................................12
Question 2: Balance of Payment................................................................................................13
Question 3: Foreign Exchange...................................................................................................13
Question 4: Application Foreign Exchange...............................................................................14
References......................................................................................................................................16
ii

ECONOMICS.
Part A: LO5 - Macroeconomic Concepts and Models.
Question 1: Consumer Price Index.
It is a complete estimate used for measuring of cost variations in a basket of products and
services illustrative of consumption spending in an economy (Tang, et al., 2018).
The estimation of CPI comprises several classifications which have been made for
categorising consumption objects and on the source of consumer groups like urban and rural.
Established on these guides and sub-guides achieved, the ultimate general index of cost is
estimated frequently by national statistical organisations. It is one of the essential measurements
for an economy which is usually founded upon the weighted average of the cost of products. The
CPI provides a knowledge on the cost of living for individuals (Kim, Ha, & Kim, 2017).
Question 2: Gross Domestic Product.
It is one of the main pointers used to estimate the health of a nation's economy. It
signifies the whole money worth of all products and services manufactured over a particular time
period regularly referred to as the magnitude of the economy (Sayari, Sari, & Hammoudeh,
2018).
a. Calculate the value of Gross domestic product
Y =C + I +G+ ( X−M )
Y is the total output.
C is the individual expenditure
G is the Government expenditure
X are the Exports
M are the Imports
Y =23 , 100+6 , 200+ ( 13 , 300−15 , 100 )
=29 , 300+ ( −1800 )
=27 , 500
b. Why is the Gross Domestic Product understating the figure of economy.
Lack of sufficient information to be included when estimating the GDP.
A sizable underground economy. There is a great value of the economy that is not
accounted for in the calculation of economy.
1
⊘ This is a preview!⊘
Do you want full access?
Subscribe today to unlock all pages.

Trusted by 1+ million students worldwide

ECONOMICS.
c. Gross domestic product is measured in both real and nominal terms so that we can have
some signal of progression if cost increase and also if cost falls. Nominal GDP is the
precise financial unit and a complete GDP in that specific year and Real GDP is a
technique of inflation variable GDP for comparison of years in terms of purchasing
power and not only entire money in an economy (Pan, Wang, Wang, & Yang, 2018).
d. It is an estimation of the complete economic productivity of a nation divided by the
number of individual and regulated for inflation. It is used to collate the standard of living
among nations and over time (Huq & Tribe, 2018).
e. Alternative measure for GDP.
Green GDP
The green gross domestic product is an index of economic progression with the
environmental concerns of that progression catered for. It expresses the GDP in monetary terms
and losses of biodiversity and accounts for prices as a result of climate variation. Most
environmental specialists prefer physical pointers like waste per capita and carbon dioxide
emissions per year, which may be gathered as Sustainable Development Index (Luukkanen, et
al., 2019).
Green GDP = GDP - Natural Resources depletion - Cost of Pollution
Index of Sustainable Economic Welfare.
This provides a complete illustration of economic welfare ever since this index adjust the
GDP figures to allow for activities ignored when estimating the Gross domestic product (Hussen,
2018).
2
Paraphrase This Document
Need a fresh take? Get an instant paraphrase of this document with our AI Paraphraser

ECONOMICS.
Part B: AD-AS Model and Economic Growth
Question 1. Net Migration.
Net Migration is increasing.
The net migration is the change among the figures of immigrants or individuals migrating
into an area and the figures of emigrants or individuals migrating out of an area during a specific
the year. When the figure of immigrants is greater than the figure of emigrants, a positive net
migration rate is achieved and a negative net migration is achieved when the immigrant is less
than the number of emigrants (Bertoli & Moraga, 2018).
AS-AD CURVE
Figure 1: AD-AS Curves.
When the net migration rise it indicates that the output level will be increasing and in turn a rise
in output level. A higher level of output moves the AS curve right ward direction with improved
output, businesses can yield a greater amount produced at every price level. The figure
above shows an outward move in productivity over two time periods. The AS curve moves out
from SRAS0 to SRAS1 to SRAS2, showing a rise in potential GDP in an economy and the
equilibrium moves from E0 to E1 to E2. The rise in output influences the SRAS curve to shift to
the right ward direction. The original equilibrium E0 passes across the AD and When SRAS shift
right direction then the new equilibrium E1 passes across AD and SRAS1 the final equilibrium,
E2, passes through AD and SRAS2. A move by SRAS to the right direction, shift towards to a
higher level of output and decrease on the cost level.
3

ECONOMICS.
Question 2. Analyse Effect of GDP, Inflation and Unemployment.
Explain
i. A decrease in business confidence.
Gross domestic product is decreases.
Inflation rate is reducing.
Unemployment level is increased.
4
Question 2. Analyse Effect of GDP, Inflation and Unemployment.
Explain
i. A decrease in business confidence.
Gross domestic product is decreases.
Inflation rate is reducing.
Unemployment level is increased.
4
⊘ This is a preview!⊘
Do you want full access?
Subscribe today to unlock all pages.

Trusted by 1+ million students worldwide

ECONOMICS.
ii. Increase in Individual savings for retirement.
GDP is increases.
Inflation rate is increases.
Unemployment level is reducing.
iii. A rise in business confidence.
GDP is increases.
Inflation rate is increases.
Unemployment level reduces.
5
ii. Increase in Individual savings for retirement.
GDP is increases.
Inflation rate is increases.
Unemployment level is reducing.
iii. A rise in business confidence.
GDP is increases.
Inflation rate is increases.
Unemployment level reduces.
5
Paraphrase This Document
Need a fresh take? Get an instant paraphrase of this document with our AI Paraphraser

ECONOMICS.
Question 3. Recessionary and Inflationary Gap.
i. Recessionary gap.
It is a term that implies to the change amongst real and possible GDP in an economy. A
country's gross domestic product is an estimate of how much an economy is creating and is used
to compare expansion amongst countries from year to year. It is also called contractionary gap
(Arranz, García-Serrano, & Hernanz, 2019).
Recessionary Gap model
When rate of employment is underneath the standard level, as indicated in Panel A above, at that
point of manufacture will require to be beneath the probable GDP. Panel B above shows the
contractionary gap YP-Y1, which comes about when AD curve and SRAS curve cut to the left
direction of LRAS curve.
Inflationary Gap.
It refers to the change amongst the current limit of real gross domestic product and the
anticipated gross domestic product which is looming when an economy is at full employment. It
is also referred to as the potential gross domestic product (Jarociński & Lenza, 2018).
6

ECONOMICS.
Inflationary Gap Model
Panel A above shows that labour resources are above standard level, then the output level needs
to be above potential GDP. The expansionary gap, shown in Panel B above is equals to Y1-YP.
The AD curve and the SRAS curve correspond to the right direction of the LRAS curve.
7
Inflationary Gap Model
Panel A above shows that labour resources are above standard level, then the output level needs
to be above potential GDP. The expansionary gap, shown in Panel B above is equals to Y1-YP.
The AD curve and the SRAS curve correspond to the right direction of the LRAS curve.
7
⊘ This is a preview!⊘
Do you want full access?
Subscribe today to unlock all pages.

Trusted by 1+ million students worldwide

ECONOMICS.
ii. Effect of increase in transfer payment.
8
ii. Effect of increase in transfer payment.
8
Paraphrase This Document
Need a fresh take? Get an instant paraphrase of this document with our AI Paraphraser

ECONOMICS.
Part C: LO6 – Impact of Government on the Macroeconomic Objectives.
Question 1: Macroeconomic Objectives.
Advantage.
Improved net migration rises the output level and progression in a nation. The immigrants
bring new skills to the country and they purchase properties such as houses and cars hence
injecting money into an economy.
Disadvantages.
The New Zealand country has never planned for housing for the past ten years therefore,
a rise in net migration has caused lack of housing units for the rising population. The increase in
number of cars purchased has caused to resident spending additional time on roads while going
to work and back home owing to traffic jams.
Question 2 Monetary Policy.
Monetary policy.
It is a regulation restricted by the central bank. It includes of regulating the money supply
and interest rates. It is an economic regulation used by the government of a country to achieve
broader economic purposes which includes inflation, consumption, expansion and liquidity
(Drechsler, Savov, & Schnabl, 2018).
Intention of monetary policy.
Monetary policy, adjust credit and check inflation prices and alleviate the exchange rate
so that it can achieve balance of payments equilibrium and encourage economic expansion.
9

ECONOMICS.
Official cash rate, is the interest rate set by the Reserve Bank of New Zealand. It influences the
other interest rates and allows the Reserve Bank of New Zealand to attain its goal of ensuring the
prices are constant and stable.
Type of monetary policy indicated above.
Its Expansionary monetary policy.
The concept of expansionary monetary policy is anticipated to result in high economic expansion
and reduced unemployment rate. It will also result in increased prices of goods and services.
Impact of the policy on the New Zealand Economy.
Increases prices in New Zealand.
Reduce unemployment level in New Zealand.
There is increased rate of economic expansion.
Question 3. Fiscal Policy.
It is the procedure by which a government controls their spending culture and tax rates to
monitor and influence a nation's economy. Under the policy, the Reserve bank impacts a nation's
quantity of money in supply (Desai, 2019).
Intention of fiscal policy.
10
⊘ This is a preview!⊘
Do you want full access?
Subscribe today to unlock all pages.

Trusted by 1+ million students worldwide
1 out of 18