ECON101: Linear Regression Report on Online College Performance
VerifiedAdded on 2023/04/21
|12
|1935
|500
Report
AI Summary
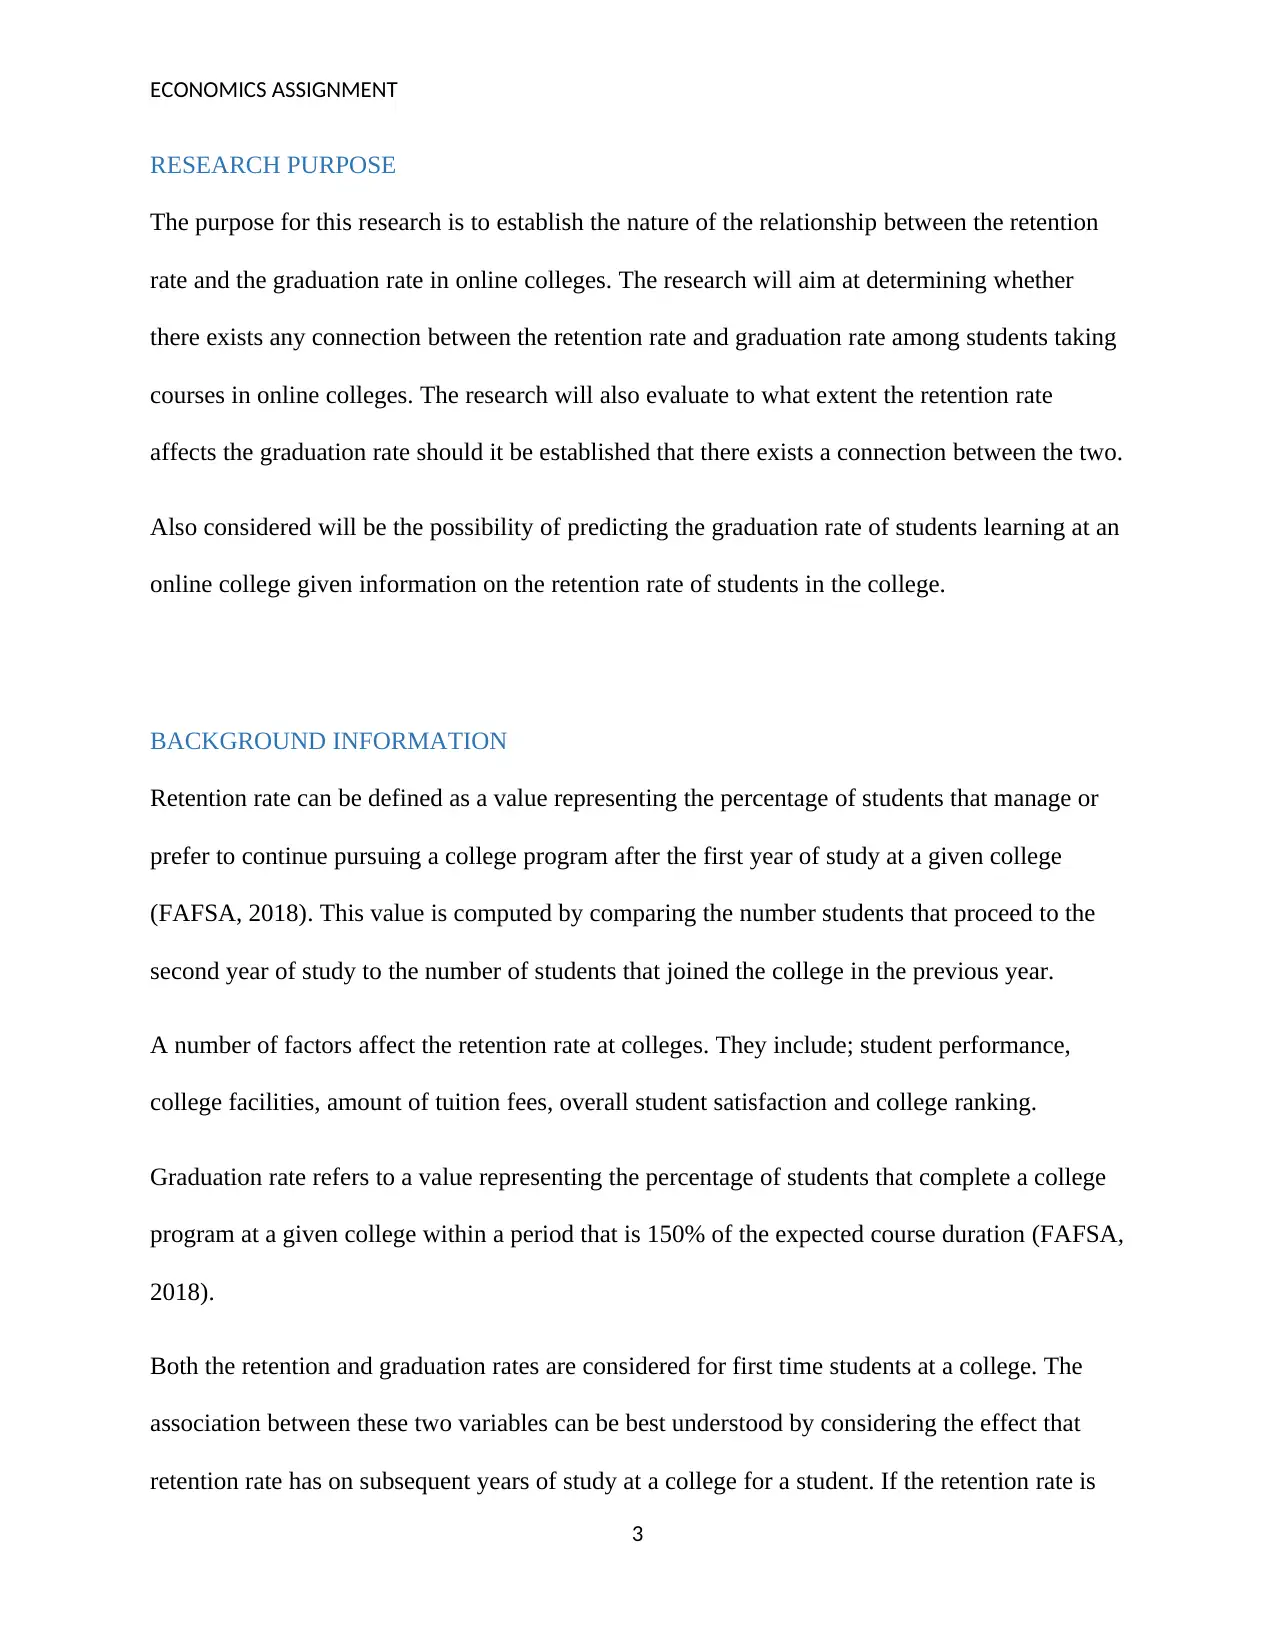
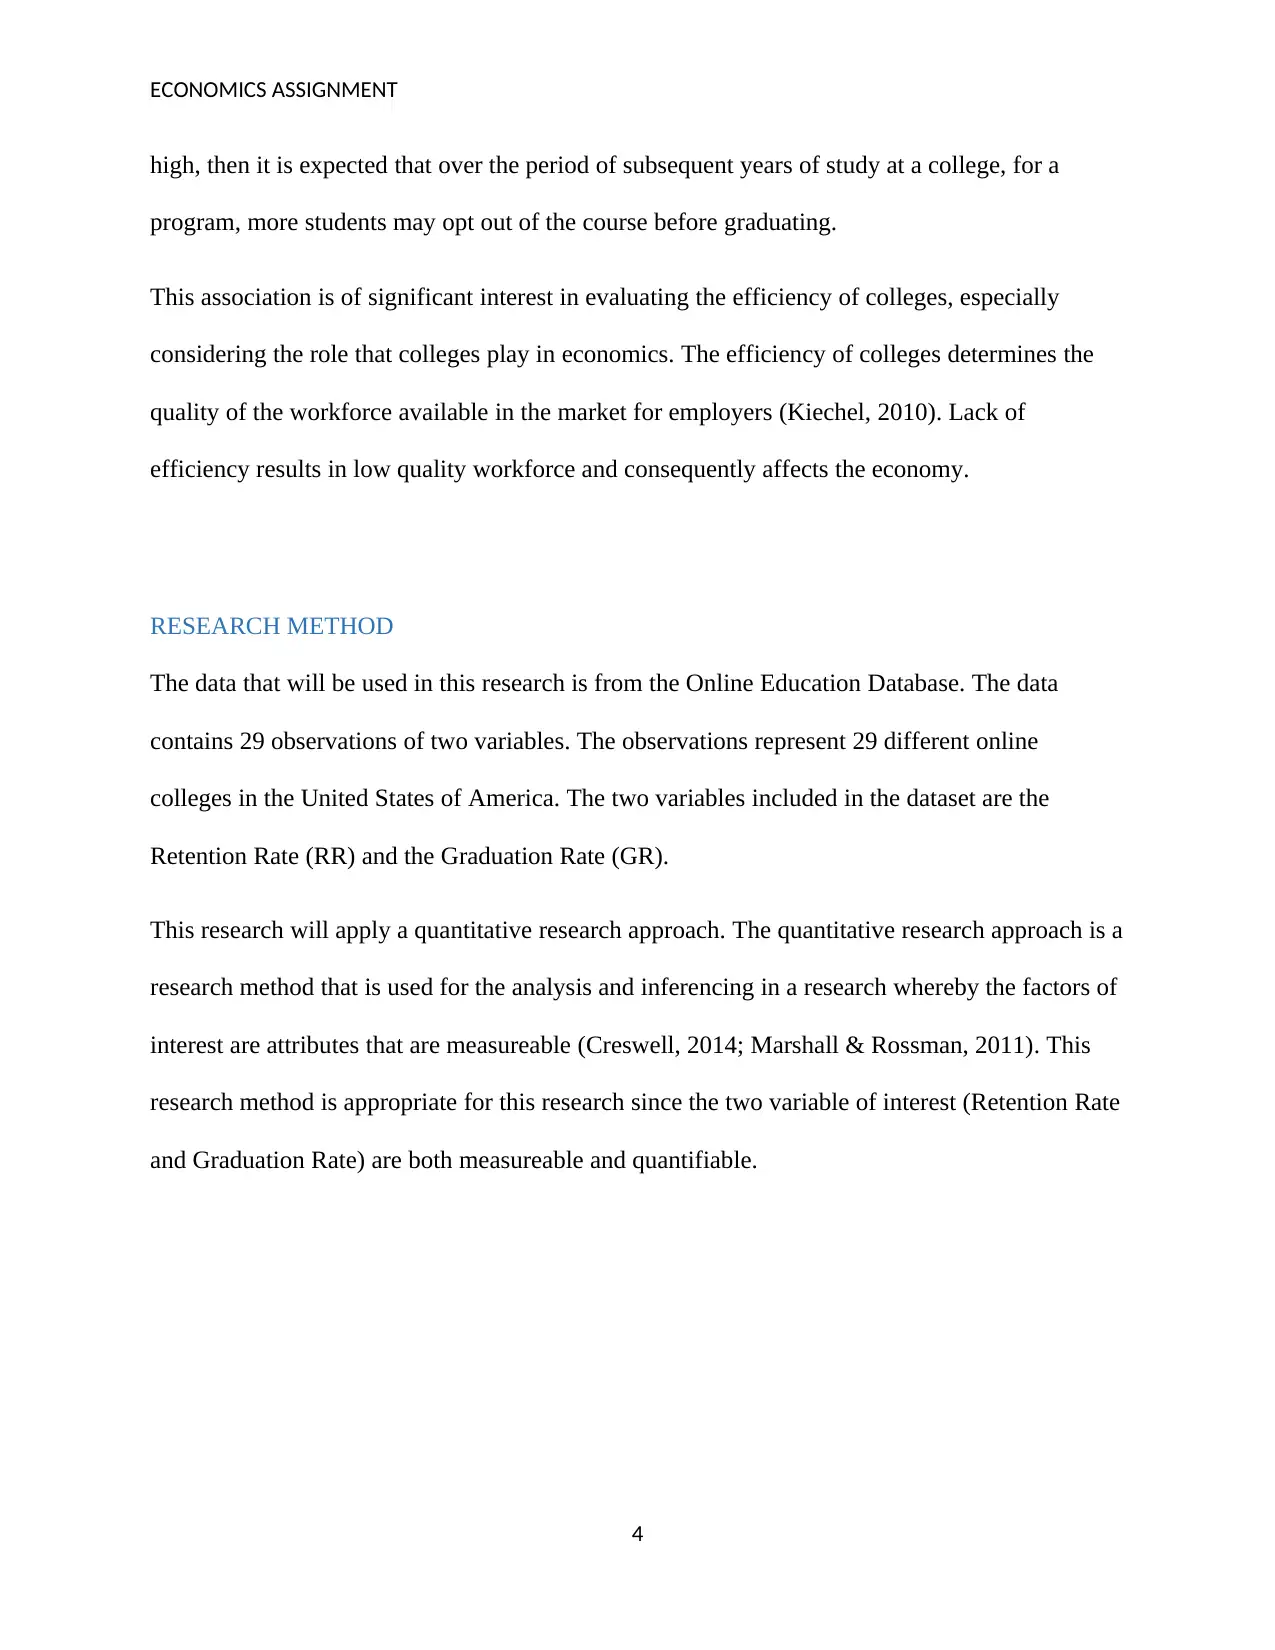
This economics report investigates the relationship between retention rates and graduation rates in online colleges. The research aims to determine the extent to which retention rates affect graduation rates and if it is possible to predict graduation rates based on retention data. The report uses data from the Online Education Database, encompassing 29 online colleges in the United States, employing a quantitative research approach and a correlation research design, specifically using simple linear regression to analyze the association between retention rate (independent variable) and graduation rate (dependent variable). The results reveal a statistically significant, though weak, positive linear relationship between the two variables. The regression equation, while statistically significant, fails the goodness-of-fit test. The report also includes recommendations for colleges to improve student success, such as incorporating audio-visual teaching techniques and improving online platform user interfaces. The report concludes with a discussion of the findings and their limitations, offering insights into the challenges and opportunities within the online education sector, and highlights the importance of graduation rates for colleges.
Contribute Materials
Your contribution can guide someone’s learning journey. Share your
documents today.

ECONOMICS ASSIGNMENT
Secure Best Marks with AI Grader
Need help grading? Try our AI Grader for instant feedback on your assignments.

ECONOMICS ASSIGNMENT
Contents
RESEARCH PURPOSE..............................................................................................................................3
BACKGROUND INFORMATION............................................................................................................3
RESEARCH METHOD..............................................................................................................................4
CORRELATION RESEARCH DESIGN................................................................................................5
RESEARCH RESULTS..............................................................................................................................6
DISCUSSION.............................................................................................................................................9
RECOMMENDATIONS...........................................................................................................................10
REFERENCES..........................................................................................................................................11
2

ECONOMICS ASSIGNMENT
RESEARCH PURPOSE
The purpose for this research is to establish the nature of the relationship between the retention
rate and the graduation rate in online colleges. The research will aim at determining whether
there exists any connection between the retention rate and graduation rate among students taking
courses in online colleges. The research will also evaluate to what extent the retention rate
affects the graduation rate should it be established that there exists a connection between the two.
Also considered will be the possibility of predicting the graduation rate of students learning at an
online college given information on the retention rate of students in the college.
BACKGROUND INFORMATION
Retention rate can be defined as a value representing the percentage of students that manage or
prefer to continue pursuing a college program after the first year of study at a given college
(FAFSA, 2018). This value is computed by comparing the number students that proceed to the
second year of study to the number of students that joined the college in the previous year.
A number of factors affect the retention rate at colleges. They include; student performance,
college facilities, amount of tuition fees, overall student satisfaction and college ranking.
Graduation rate refers to a value representing the percentage of students that complete a college
program at a given college within a period that is 150% of the expected course duration (FAFSA,
2018).
Both the retention and graduation rates are considered for first time students at a college. The
association between these two variables can be best understood by considering the effect that
retention rate has on subsequent years of study at a college for a student. If the retention rate is
3

ECONOMICS ASSIGNMENT
high, then it is expected that over the period of subsequent years of study at a college, for a
program, more students may opt out of the course before graduating.
This association is of significant interest in evaluating the efficiency of colleges, especially
considering the role that colleges play in economics. The efficiency of colleges determines the
quality of the workforce available in the market for employers (Kiechel, 2010). Lack of
efficiency results in low quality workforce and consequently affects the economy.
RESEARCH METHOD
The data that will be used in this research is from the Online Education Database. The data
contains 29 observations of two variables. The observations represent 29 different online
colleges in the United States of America. The two variables included in the dataset are the
Retention Rate (RR) and the Graduation Rate (GR).
This research will apply a quantitative research approach. The quantitative research approach is a
research method that is used for the analysis and inferencing in a research whereby the factors of
interest are attributes that are measureable (Creswell, 2014; Marshall & Rossman, 2011). This
research method is appropriate for this research since the two variable of interest (Retention Rate
and Graduation Rate) are both measureable and quantifiable.
4
Secure Best Marks with AI Grader
Need help grading? Try our AI Grader for instant feedback on your assignments.

ECONOMICS ASSIGNMENT
CORRELATION RESEARCH DESIGN
Under the quantitative research approach, this research will apply the correlation research design.
Correlation research design is a quantitative research approach that is used when the interest in a
study is to explain the nature of the association that exists between the variables of interest
(Brians, 2011).
This research aims at evaluating the nature of the relationship between the Retention Rate and
the Graduation Rate. Therefore, the correlation research design will be the best quantitative
research approach for this study.
Simple linear regression will be used in the evaluation of the relationship between the retention
rate and the graduation rate. Linear regression can be referred to as a correlation study design
technique that presents the association between variables in the form of an equation (Jaulin,
2010; Tri & Jugal, 2015). The simple linear regression is a linear regression in which the
association evaluated is strictly between two variables (the independent and dependent variables)
(Cortes & Mohri, 2014; Jorge, et al., 2013). In this study, the Retention Rate will be the
independent variable while the Graduation Rate will be the dependent variable.
5

ECONOMICS ASSIGNMENT
RESEARCH RESULTS
The descriptive statistics for the Retention Rate and Graduation Rate variables are as given in
Table 1: Descriptive Statistics Table below:
Table 1: Descriptive Statistics Table
Descriptive Statistics
RR(%) GR(%)
Mean 57.41379 41.75862
Minimum 4 25
Maximum 100 61
From the table above Table 1: Descriptive Statistics Table, we observe that the average
Retention Rate in the 29 online colleges was 57.41379% while the average Graduation Rate was
41.75862%. The minimum Retention Rate was 4% with the maximum being 100%. The
minimum for the Graduation Rate was 25% with the maximum being 61%.
The scatterplot chart for the Retention Rate against the Graduation Rate is as given in Figure 1:
Scatterplot of Retention Rate against Graduation Rate below:
6

ECONOMICS ASSIGNMENT
0 20 40 60 80 100 120
0
10
20
30
40
50
60
70
Chart of RR(%) against GR(%)
RR(%)
GR(%)
Figure 1: Scatterplot of Retention Rate against Graduation Rate
From Figure 1: Scatterplot of Retention Rate against Graduation Rate above we observe that to a
very limited extent, the data points can be said to be following to generally linear trend. This
implies that to some extent, there exist a positive linear relationship between the Retention Rate
and the Graduation Rate (Increase in Retention Rate results in increase in the Graduation Rate
and vice versa).
The output of the simple linear regression for the two variables: Retention Rate (Independent
Variable) and the Graduation Rate (Dependent Variable) is as given in Table 2: Regression
Summary Output below:
7
Paraphrase This Document
Need a fresh take? Get an instant paraphrase of this document with our AI Paraphraser

ECONOMICS ASSIGNMENT
Table 2: Regression Summary Output
From the Table 2: Regression Summary Output above, the regression equation for the Retention
Rate and the Graduation Rate can be estimated as:
Graduation Rate ( % ) =25.4229+ 0.284526∗Retention Rate (%)
The value of the slope coefficient from Table 2: Regression Summary Output is equal to
0.284526. This value is interpreted as; if the value of the Retention Rate changes by a single unit
(in this case by 1%), the value of the Graduation Rate will change by 0.284526.
Considering α-level of significance = 0.05, then p-value (Significant F) < α. This is since 6.95E-
05 < 0.05. This implies that there exist a statistically significant association between the
Retention Rate and the Graduation Rate.
From Table 2: Regression Summary Output, the value of the adjusted R Squared = 0.428829.
This implies that the regression equation explains up to 42.8829% of the association between the
8

ECONOMICS ASSIGNMENT
Retention Rate and the Graduation Rate. This percentage is too small and thus the regression fit
cannot be considered as a good fit.
As the president of South University, I would be more concern about the Graduation Rate than
the Retention Rate. The Retention Rate for South University is 51%, which is slightly below the
average. Its Graduation Rate however, is the lowest among all the universities. Hence I would be
concerned about the performance of the university with respect to the Graduation Rate.
As the president of the University of Phoenix, I would be concerned about both the Retention
Rate and the Graduation Rate. The university’s Retention Rate is the lowest among all the
universities with the Graduation Rate slightly above the lowest value. Hence I would be
concerned about the performance of the university with respect to both the Retention Rate and
the Graduation Rate.
DISCUSSION
Although the regression equation is statistically significant in describing the association between
the two variables, it fails the goodness of fit test and hence cannot be considered efficient in
giving this description. This failure in goodness of fit presents the main limitation to the
application of the regression equation estimated in the research for all other cases.
The results from this research are consistent with other studies. The Retention and Graduation
Rates cannot be considered necessarily as measures of performance but rather as measures of the
stability of the institution (Boden, 2011). Similar to our case, Boden (2011) also finds limited
association between the two variables. The findings therefore do not have any clear policy
implications.
9

ECONOMICS ASSIGNMENT
RECOMMENDATIONS
1. The colleges can incorporate the use of audio and visual teaching techniques such as
podcasts and video classes. This would improve the student-lecturer interaction.
2. The colleges may improve the user interface of their online platforms. Improving the
navigability of the platforms will make the students more comfortable with accessing and
interacting with the platforms.
3. The colleges can also ensure that they have the most qualified teaching staffs. This will
guarantee the students quality education from the colleges’ online platforms.
10
Secure Best Marks with AI Grader
Need help grading? Try our AI Grader for instant feedback on your assignments.

ECONOMICS ASSIGNMENT
REFERENCES
Boden, GT 2011, 'Retention and Graduation Rates: Insights from an Extended Longitudinal
View', Journal of College Student Retention: Research. Theory and Practice, vol.3. no.4, pp. 15-
19.
Brians, CL 2011, Empirical Political Analysis: Quantitative and Qualitative Methods, Longman,
Boston, MA.
Cortes, C & Mohri, M 2014, 'Domain Adaptation and Sample Bias Correction Theory and
Algorithm for Regression', Theoretical Computer Science , vol.2, no.5, pp. 103-126.
Creswell, JW 2014, Research Design: Qualitative, Quantitative and Mixed Approaches, 4th edn,
SAGE Publications, Inc, Michigan.
FAFSA 2018, viewed 7 February 2019
<fafsa.ed.gov/help/fotw91n.htm>
Jaulin, L 2010, 'Probabilistic set-membership approach for robust regression', Journal of
Statistical Theory and Practice, vol.5, no.1, pp. 1-14.
Jorge, AA, Angela, A & Edson, ZM 2013, 'Robust Linear Regression Models: Use of Stable
Distribution for the Response Data', Open Journal of Statistics, vol.3, no.1, pp. 3-5.
Kiechel, W 2010, The Lords of Strategy, 2nd edn, Havard Business Press, New York
Marshall, C & Rossman, GB 2011, Designing Qualitative Research, 5th edn. SAGE
Publications, Los Angels.
Tri, D & Jugal, K 2015, Select Machine Learning Algorithms Using Regression Models, s.l.:
2015 IEEE Conference.
11

ECONOMICS ASSIGNMENT
12
12
1 out of 12
Related Documents

Your All-in-One AI-Powered Toolkit for Academic Success.
+13062052269
info@desklib.com
Available 24*7 on WhatsApp / Email
Unlock your academic potential
© 2024 | Zucol Services PVT LTD | All rights reserved.