Economics for Management: Australian Economic Situation & Forecast
VerifiedAdded on 2023/05/28
|6
|1013
|423
Report
AI Summary
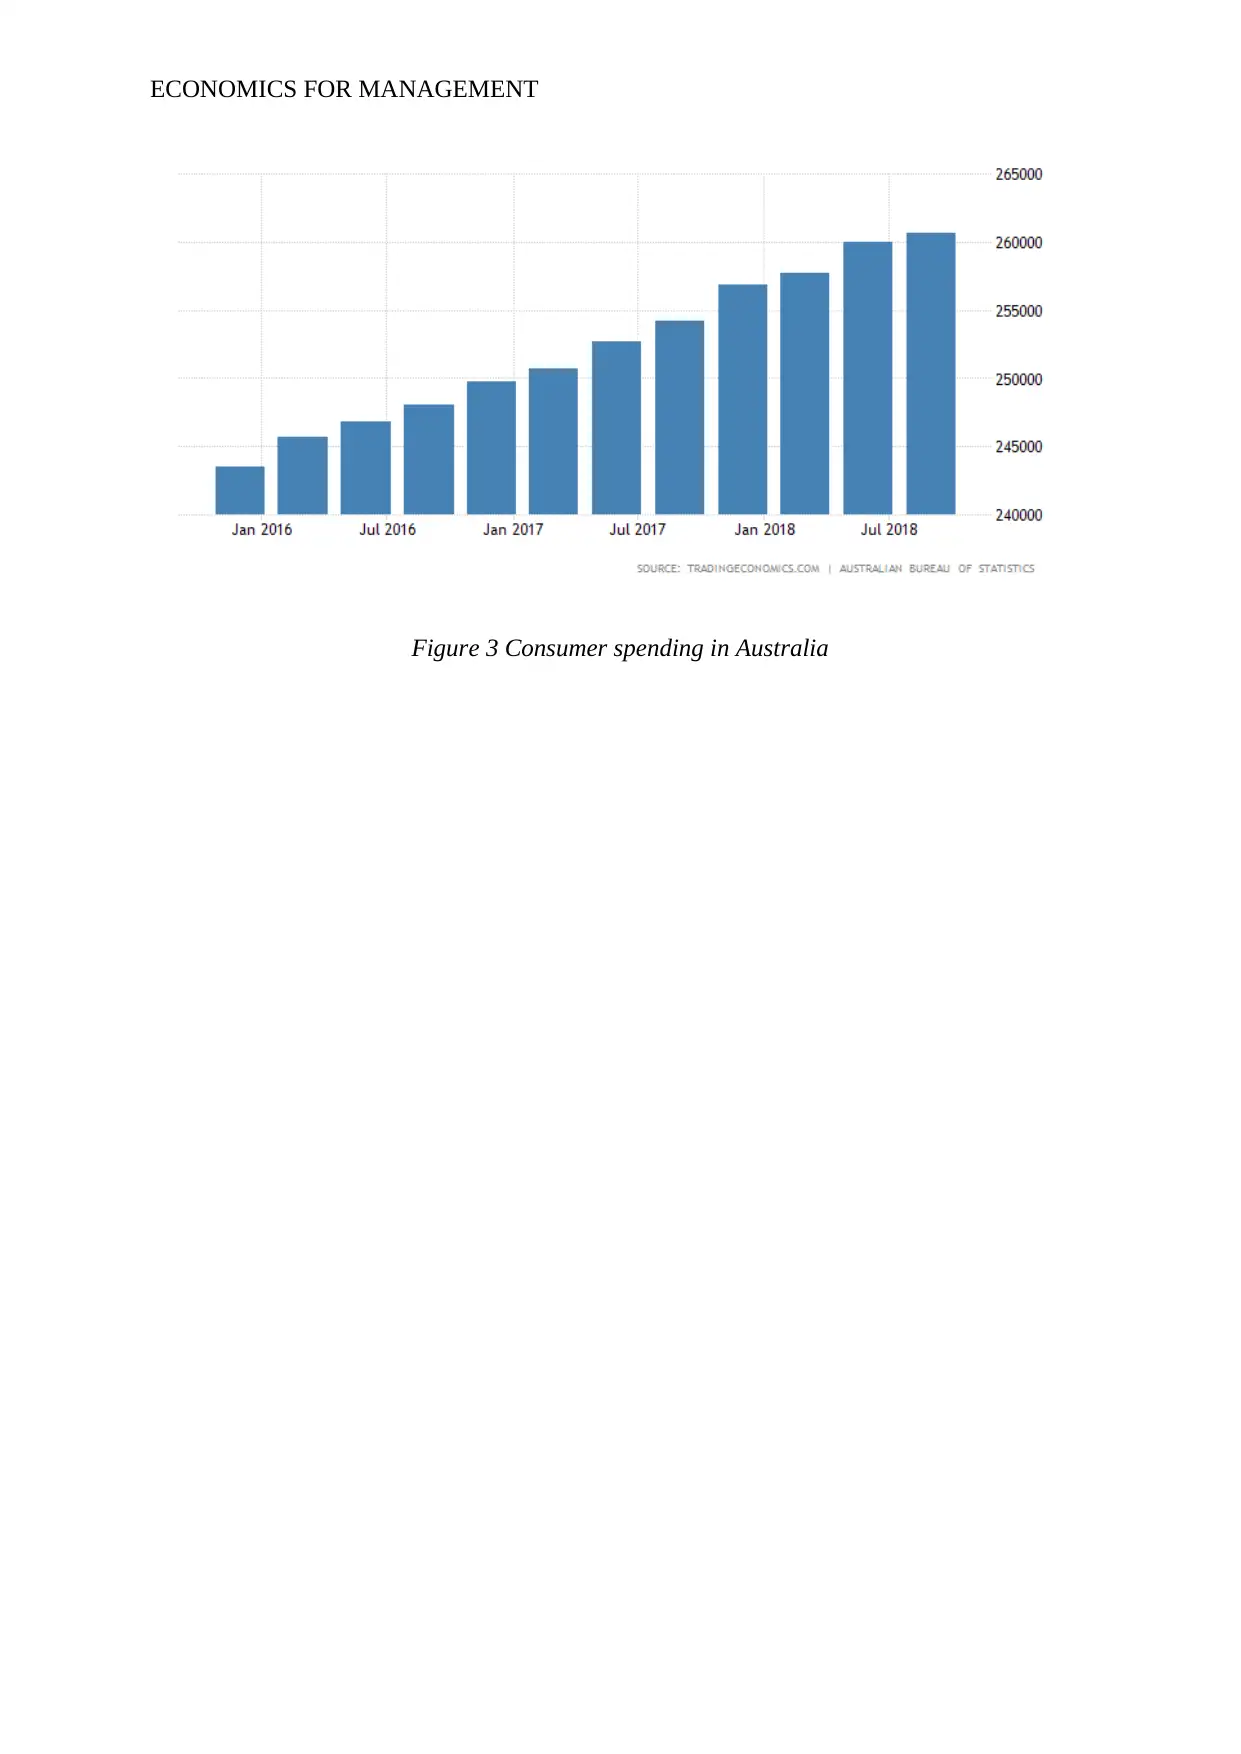
This report provides an analysis of the Australian economy, focusing on key macroeconomic indicators such as consumption expenditure, investment, government expenditure, and net exports. It examines the impact of the US-China trade war on Australia's economic performance and forecasts its economic trajectory for the next 6 months, considering the Reserve Bank of Australia's potential cash rate movements. The report uses macroeconomic models to analyze the drivers of the Australian economy and offers insights into the current economic situation and future outlook. Desklib offers a variety of solved assignments and past papers for students.

Running head: ECONOMICS FOR MANAGEMENT
Economics for management
Name of the student
Name of the university
Author note
Economics for management
Name of the student
Name of the university
Author note
Paraphrase This Document
Need a fresh take? Get an instant paraphrase of this document with our AI Paraphraser

ECONOMICS FOR MANAGEMENT
Introduction
The trade war takes place when the nation imposes a tariff or quota over the imports
and the foreign nations will also hit back on the trade protectionism. Thee trade war imposed
by Trump would cost the Australian economy at least $36 billion. At the time when the US
China trade war will be persistent, the rate of development of the Australian economy will be
at risk. The economic development of Australia could experience a hindrance as the exporters
will be captured in the mounting trade war among the China and United States (Bodirsky and
Popp 2015). The economy of Australia is at high risk which can take place as a result of US
China trade war. It can therefore be said that the economic growth of Australia will be
suffering serious setback as the exporter of the country was captured in mounting the trade
war between the United States and China. The factor behind this is that Australia’s biggest
export market is known to be China.
Analysis of Australian economies
The economy of Australian is known to be one of the largest mixed market economies
having a gross domestic product of A$1.69 trillion in the year 2017 (Abs.gov.au. 2018).
Australia is also known to be the second wealthiest country in accordance to wealth per adult.
The Australian economy is generally dominated by the service sector comprising of 61.1% of
the gross domestic product. The two major tools which is used by the Government for
stabilizing the economy are the fiscal and the monetary policies. The Reserve Bank of
Australia usually designs the monetary policy by using the instrument of the cash rate. The
service sector is known to be the largest part of the economy of Australian which accounts for
about seventy percent of the gross domestic product. The global financial issue although
have not affected Australia , since the banking system was quite strong which kept inflation
under control.(Marchant and Wang 2018).

ECONOMICS FOR MANAGEMENT
4-Feb-15
1-Apr-15
27-May-15
22-Jul-15
16-Sep-15
11-Nov-15
6-Jan-16
2-Mar-16
27-Apr-16
22-Jun-16
17-Aug-16
12-Oct-16
7-Dec-16
1-Feb-17
29-Mar-17
24-May-17
19-Jul-17
13-Sep-17
8-Nov-17
3-Jan-18
28-Feb-18
25-Apr-18
20-Jun-18
15-Aug-18
10-Oct-18
5-Dec-18
30-Jan-19
27-Mar-19
22-May-19
0
0.5
1
1.5
2
2.5
Chart Title
ORDER
Figure 1 Forecasted cash rate for next 6 months
Consumption expenditure
In the model of aggregate expenditure, the consumption expenditure will indicate
consumption of household (Yueh 2018). The factors which will be influencing the
consumption expenditure comprises of income tax, interest rate, wealth level and debit level
(Miura and Higashi 2017). The Reserve Bank of Australia have controlled the rate of interest
which remained for quite a long time. The value of the consumption expenditure for the
household in Australia was known to be 3.21 in the year of 2016 (Data.worldbank.org. 2018)
⊘ This is a preview!⊘
Do you want full access?
Subscribe today to unlock all pages.

Trusted by 1+ million students worldwide

ECONOMICS FOR MANAGEMENT
Figure 2 Consumption Expenditure
The consumer spending of Australia have increased to 260656AUD Million in 2018
(Tradingeconomics.com. 2018). The household final consumption expenditure is known as
the market value of the goods and services which are purchased by the households (Yueh
2018). The graph below shows the increase in the consumption spending of Australia from
the year 2016 to2018. Consumption expenditure is spending by households on the services
and goods. In case of developed countries it have become the largest component of the gross
domestic product (Oecd.org. 2018).
Paraphrase This Document
Need a fresh take? Get an instant paraphrase of this document with our AI Paraphraser

ECONOMICS FOR MANAGEMENT
Figure 3 Consumer spending in Australia

ECONOMICS FOR MANAGEMENT
Reference list
Abs.gov.au. 2018 Browse Statistics. [online] Available at: http://www.abs.gov.au/browse?
opendocument&ref=topBar [Accessed 17 Dec. 2018].
Bodirsky, B.L. and Popp, A., 2015. Sustainability: Australia at the crossroads. Nature,
527(7576), p.40.
Data.worldbank.org. 2018. Final consumption expenditure (current US$) | Data. [online]
Available at: https://data.worldbank.org/indicator/NE.CON.TOTL.CD [Accessed 17 Dec.
2018].
Lanteigne, M., 2015. Chinese foreign policy: an introduction. Routledge.
Marchant, M.A. and Wang, H.H., 2018. Theme Overview: US–China Trade Dispute and
Potential Impacts on Agriculture. Choices, 33(2), pp.1-3.
Miura, K. and Higashi, M., 2017. The Recent Increase in Dual-Income Households and Its
Impact on Consumption Expenditure (No. 17-E-7). Bank of Japan.
Oecd.org. 2018. [online] Available at: https://www.oecd.org/sdd/prices-ppp/5-
3012041ec007.pdf [Accessed 17 Dec. 2018].
Tradingeconomics.com. 2018. Australia Consumer Spending | 2018 | Data | Chart |
Calendar | Forecast. [online] Available at: https://tradingeconomics.com/australia/consumer-
spending [Accessed 17 Dec. 2018].
Yueh, L. 2018 How a US-China trade war would hurt us all | Linda Yueh. [online] the
Guardian. Available at: https://www.theguardian.com/commentisfree/2018/apr/05/us-china-
trade-war-supply-chains-consumers [Accessed 11 Dec. 2018].
⊘ This is a preview!⊘
Do you want full access?
Subscribe today to unlock all pages.

Trusted by 1+ million students worldwide
1 out of 6
Related Documents
Your All-in-One AI-Powered Toolkit for Academic Success.
+13062052269
info@desklib.com
Available 24*7 on WhatsApp / Email
Unlock your academic potential
Copyright © 2020–2026 A2Z Services. All Rights Reserved. Developed and managed by ZUCOL.


