Analysis of Economics for Business and Management in EU-15
VerifiedAdded on 2021/12/20
|13
|2997
|22
Report
AI Summary
This report provides an in-depth analysis of the economics of the EU-15, examining key macroeconomic indicators and their trends from 1982 to 2018. It begins by defining real GDP and business cycles, then analyzes the fluctuation of real GDP in the EU-15, identifying expansion and recession periods and the impact of the 2007 financial crisis. The report further investigates employment rates and industrial production, highlighting their influence on the economic conditions of the EU-15. The study also discusses the importance of manufacturing and infrastructure, especially in the context of developing electric vehicles. It concludes by assessing the potential for investment in communication and infrastructure based on macroeconomic factors like GDP, private consumption, and government expenditure. The report uses various figures to illustrate trends and provides insights into the EU-15's economic performance and future prospects.
Running head: ECONOMICS FOR BUSINESS AND MANAGEMENT
Economics for Business and Management
Name of the Student
Name of the University
Author Note
Economics for Business and Management
Name of the Student
Name of the University
Author Note
Paraphrase This Document
Need a fresh take? Get an instant paraphrase of this document with our AI Paraphraser
1ECONOMICS FOR BUSINESS AND MANAGEMENT
Table of Contents
Introduction:...............................................................................................................................2
Task a:........................................................................................................................................2
Task b:........................................................................................................................................4
Task c.........................................................................................................................................7
Conclusion:..............................................................................................................................10
References:...............................................................................................................................11
2ECONOMICS FOR BUSINESS AND MANAGEMENT
Introduction:
Real gross domestic product (GDP) represents an inflation-adjusted gross production
of the country for a particular time. To measure real GDP, value of all production in present
year is expressed in terms of a base year (Feldstein 2017). On the other side, business cycle is
a macroeconomic condition where economic growth increases or decreases over time. Hence,
this cycle indicates health of a country and this in turn helps the government to make
financial decisions. Based on the fluctuation of real GDP, it can be said that whether the
economy is experiencing recession or expansion. In general, business cycle has four phases,
which are contraction, trough, expansion and peak (Schumpeter 2017). Full employment
represents the situation when an economy uses its available labour force in an efficient way
(Schumpeter 2017). In this situation, both skilled and unskilled labourers receive job at
existing market wages. This in turn increases standard of living and per capital income of
people (McCombie and Thirlwall 2016).
Task a:
The following trend has represented fluctuation of real GDP for 18982 to 2018 for the
EU-15. These countries are Australia, Belgium, Finland, France, Denmark, Greece, Germany,
Italy, Ireland, the Netherlands, Luxembourg, Spain, Portugal and Sweden and the United
Kingdom.
⊘ This is a preview!⊘
Do you want full access?
Subscribe today to unlock all pages.
Trusted by 1+ million students worldwide
3ECONOMICS FOR BUSINESS AND MANAGEMENT
1982
1984
1986
1988
1990
1992
1994
1996
1998
2000
2002
2004
2006
2008
2010
2012
2014
2016
2018
-5
-4
-3
-2
-1
0
1
2
3
4
5
ealR GDP
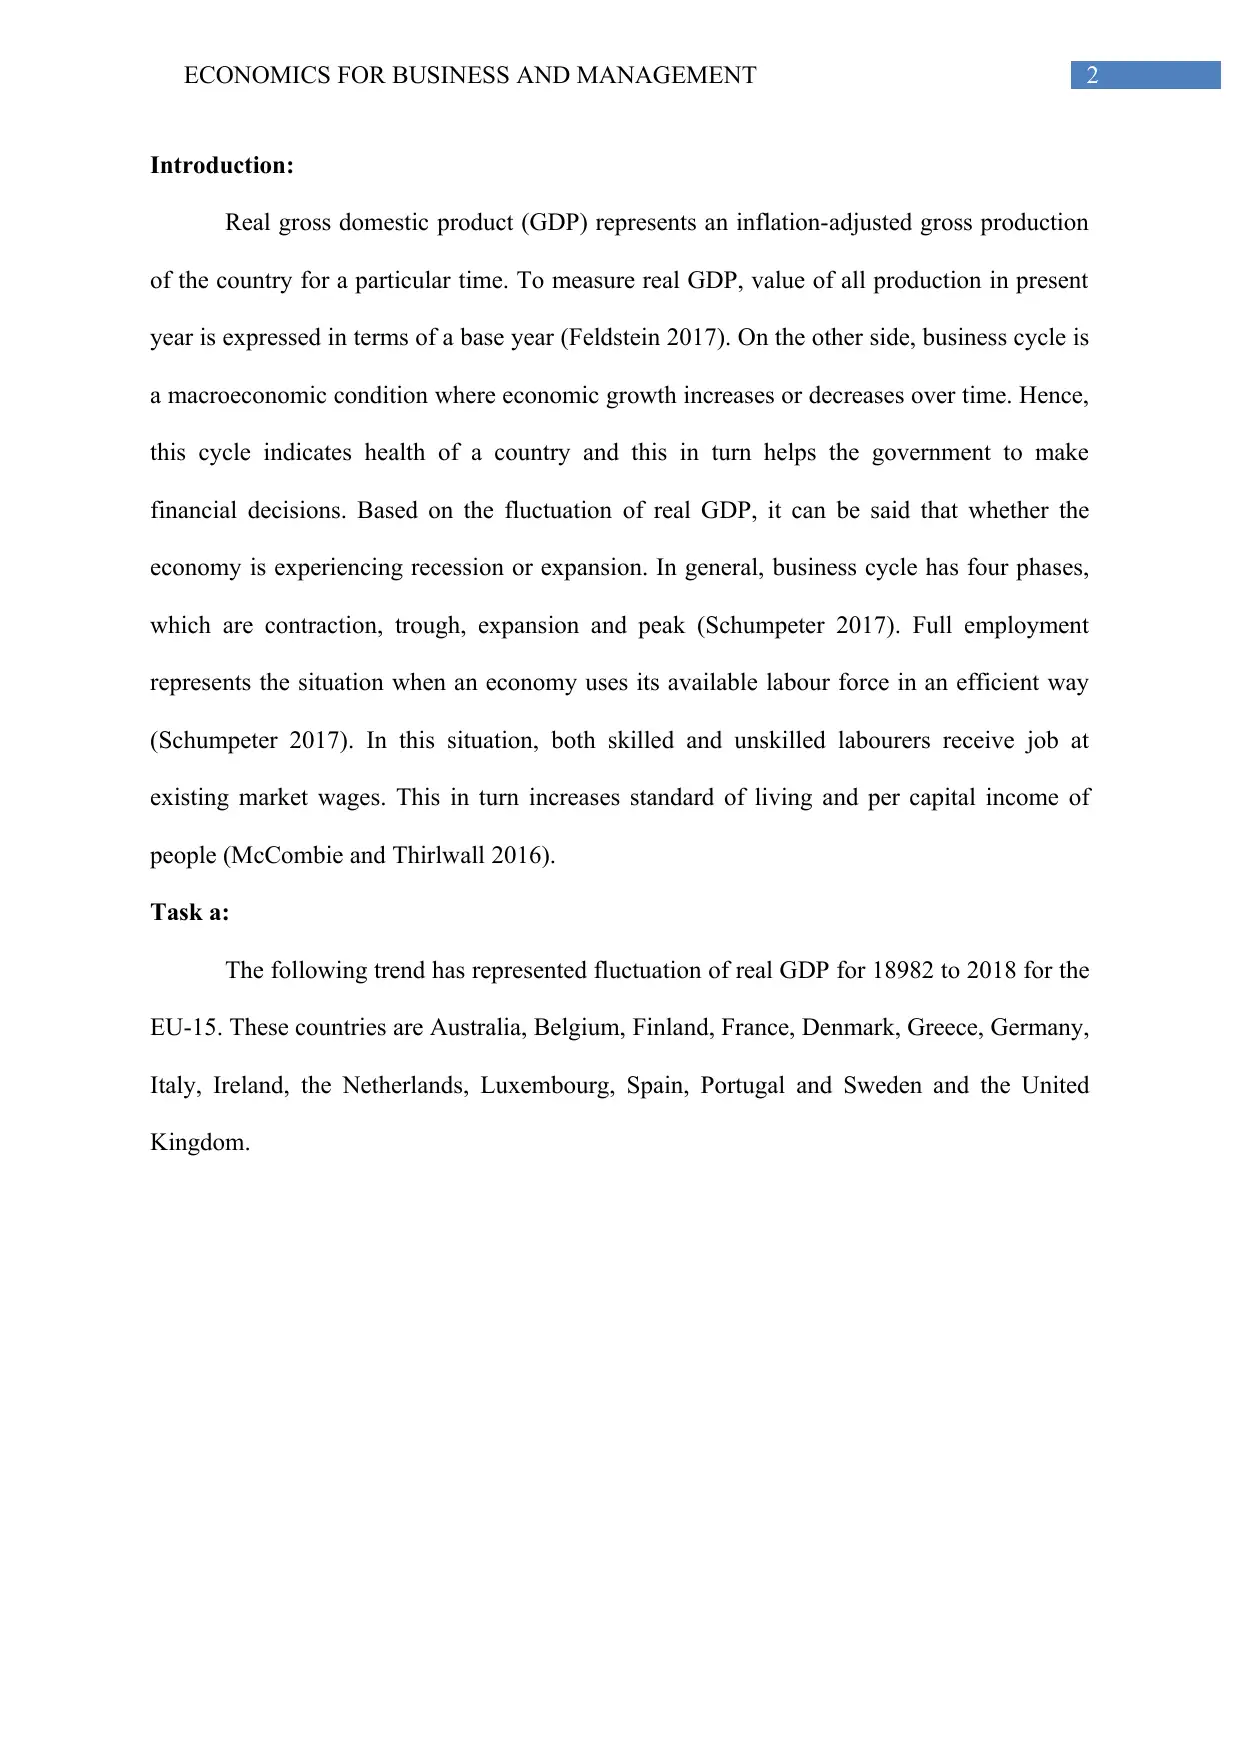
Figure 1: Trend of real GDP for the EU-15
The above figure has represents a trend line of real GDP for the EU-15 since 1982.
Based on the fluctuation of this line, it can be said that whether the economy of these
countries experience expansion or recession (Bloom et al. 2018). At the initial phase, the
value of real GDP has increased continuously between 1982 and 1988. In 1988, this curve
reached at a maximum level and has started to decline again. The sustainable period, during
which the value of real GDP increased continuously, expansion period, has occurred.
Therefore, all countries under the EU-15 experienced drastic economic growth during this
time. People received more employment opportunities while national income also increased.
Following this growth path, inflation also started to increase. On the other side, this real GDP
growth started to fall after 1988. During this period, recession occurred within those
countries. However, the adverse situation has occurred during the period of global financial
crisis. The financial crisis of 2007 gave drastic shock in these countries and consequently, the
value of real GDP reached to -4.4 in 2009. However, the government recovered this condition
successfully through implanting various fiscal as well as monetary policies.
This diagram represents that many people lost their jobs during this period of
financial crisis. Total production reduced drastically and people experienced a poor standard
1982
1984
1986
1988
1990
1992
1994
1996
1998
2000
2002
2004
2006
2008
2010
2012
2014
2016
2018
-5
-4
-3
-2
-1
0
1
2
3
4
5
ealR GDP
Figure 1: Trend of real GDP for the EU-15
The above figure has represents a trend line of real GDP for the EU-15 since 1982.
Based on the fluctuation of this line, it can be said that whether the economy of these
countries experience expansion or recession (Bloom et al. 2018). At the initial phase, the
value of real GDP has increased continuously between 1982 and 1988. In 1988, this curve
reached at a maximum level and has started to decline again. The sustainable period, during
which the value of real GDP increased continuously, expansion period, has occurred.
Therefore, all countries under the EU-15 experienced drastic economic growth during this
time. People received more employment opportunities while national income also increased.
Following this growth path, inflation also started to increase. On the other side, this real GDP
growth started to fall after 1988. During this period, recession occurred within those
countries. However, the adverse situation has occurred during the period of global financial
crisis. The financial crisis of 2007 gave drastic shock in these countries and consequently, the
value of real GDP reached to -4.4 in 2009. However, the government recovered this condition
successfully through implanting various fiscal as well as monetary policies.
This diagram represents that many people lost their jobs during this period of
financial crisis. Total production reduced drastically and people experienced a poor standard
Paraphrase This Document
Need a fresh take? Get an instant paraphrase of this document with our AI Paraphraser
4ECONOMICS FOR BUSINESS AND MANAGEMENT
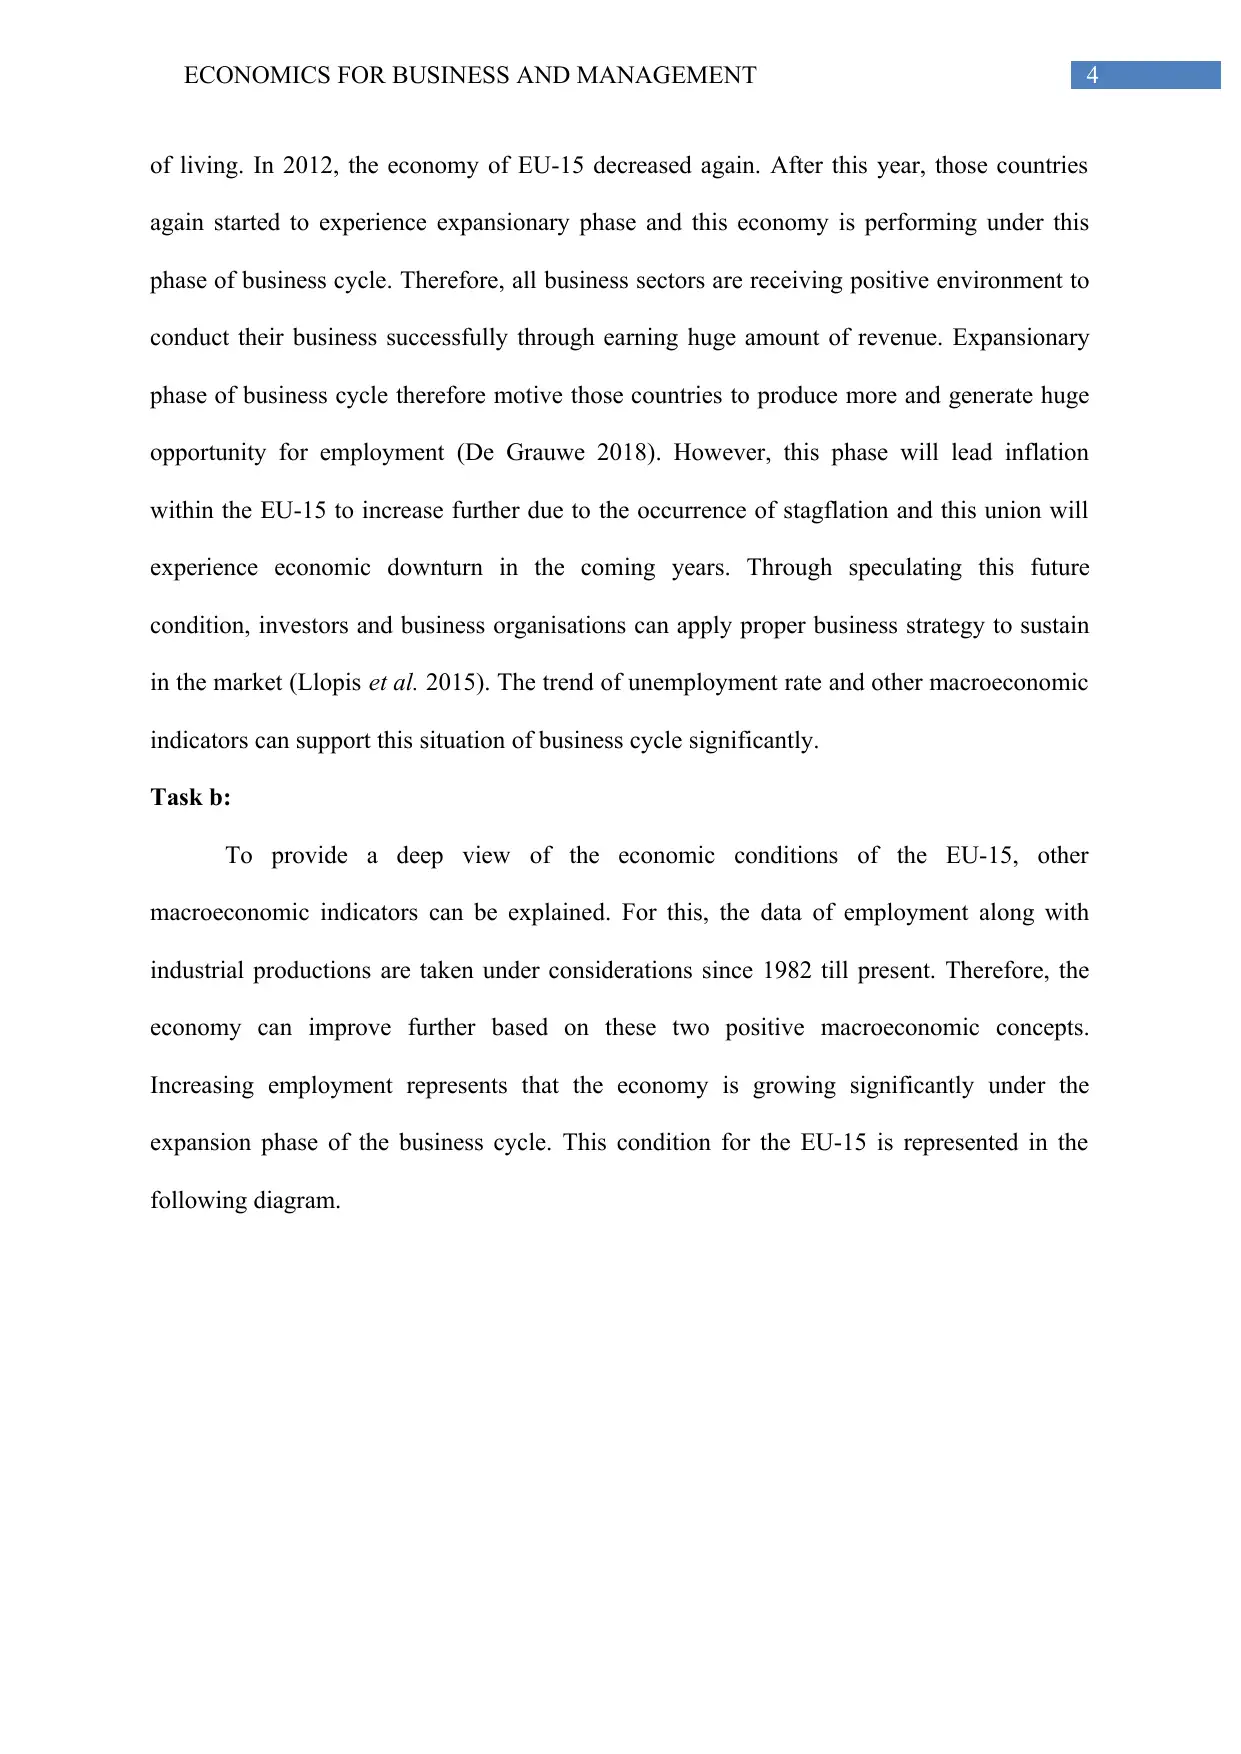
of living. In 2012, the economy of EU-15 decreased again. After this year, those countries
again started to experience expansionary phase and this economy is performing under this
phase of business cycle. Therefore, all business sectors are receiving positive environment to
conduct their business successfully through earning huge amount of revenue. Expansionary
phase of business cycle therefore motive those countries to produce more and generate huge
opportunity for employment (De Grauwe 2018). However, this phase will lead inflation
within the EU-15 to increase further due to the occurrence of stagflation and this union will
experience economic downturn in the coming years. Through speculating this future
condition, investors and business organisations can apply proper business strategy to sustain
in the market (Llopis et al. 2015). The trend of unemployment rate and other macroeconomic
indicators can support this situation of business cycle significantly.
Task b:
To provide a deep view of the economic conditions of the EU-15, other
macroeconomic indicators can be explained. For this, the data of employment along with
industrial productions are taken under considerations since 1982 till present. Therefore, the
economy can improve further based on these two positive macroeconomic concepts.
Increasing employment represents that the economy is growing significantly under the
expansion phase of the business cycle. This condition for the EU-15 is represented in the
following diagram.
5ECONOMICS FOR BUSINESS AND MANAGEMENT
1982
1984
1986
1988
1990
1992
1994
1996
1998
2000
2002
2004
2006
2008
2010
2012
2014
2016
2018
-2
-1.5
-1
-0.5
0
0.5
1
1.5
2
2.5
lo entEmp ym
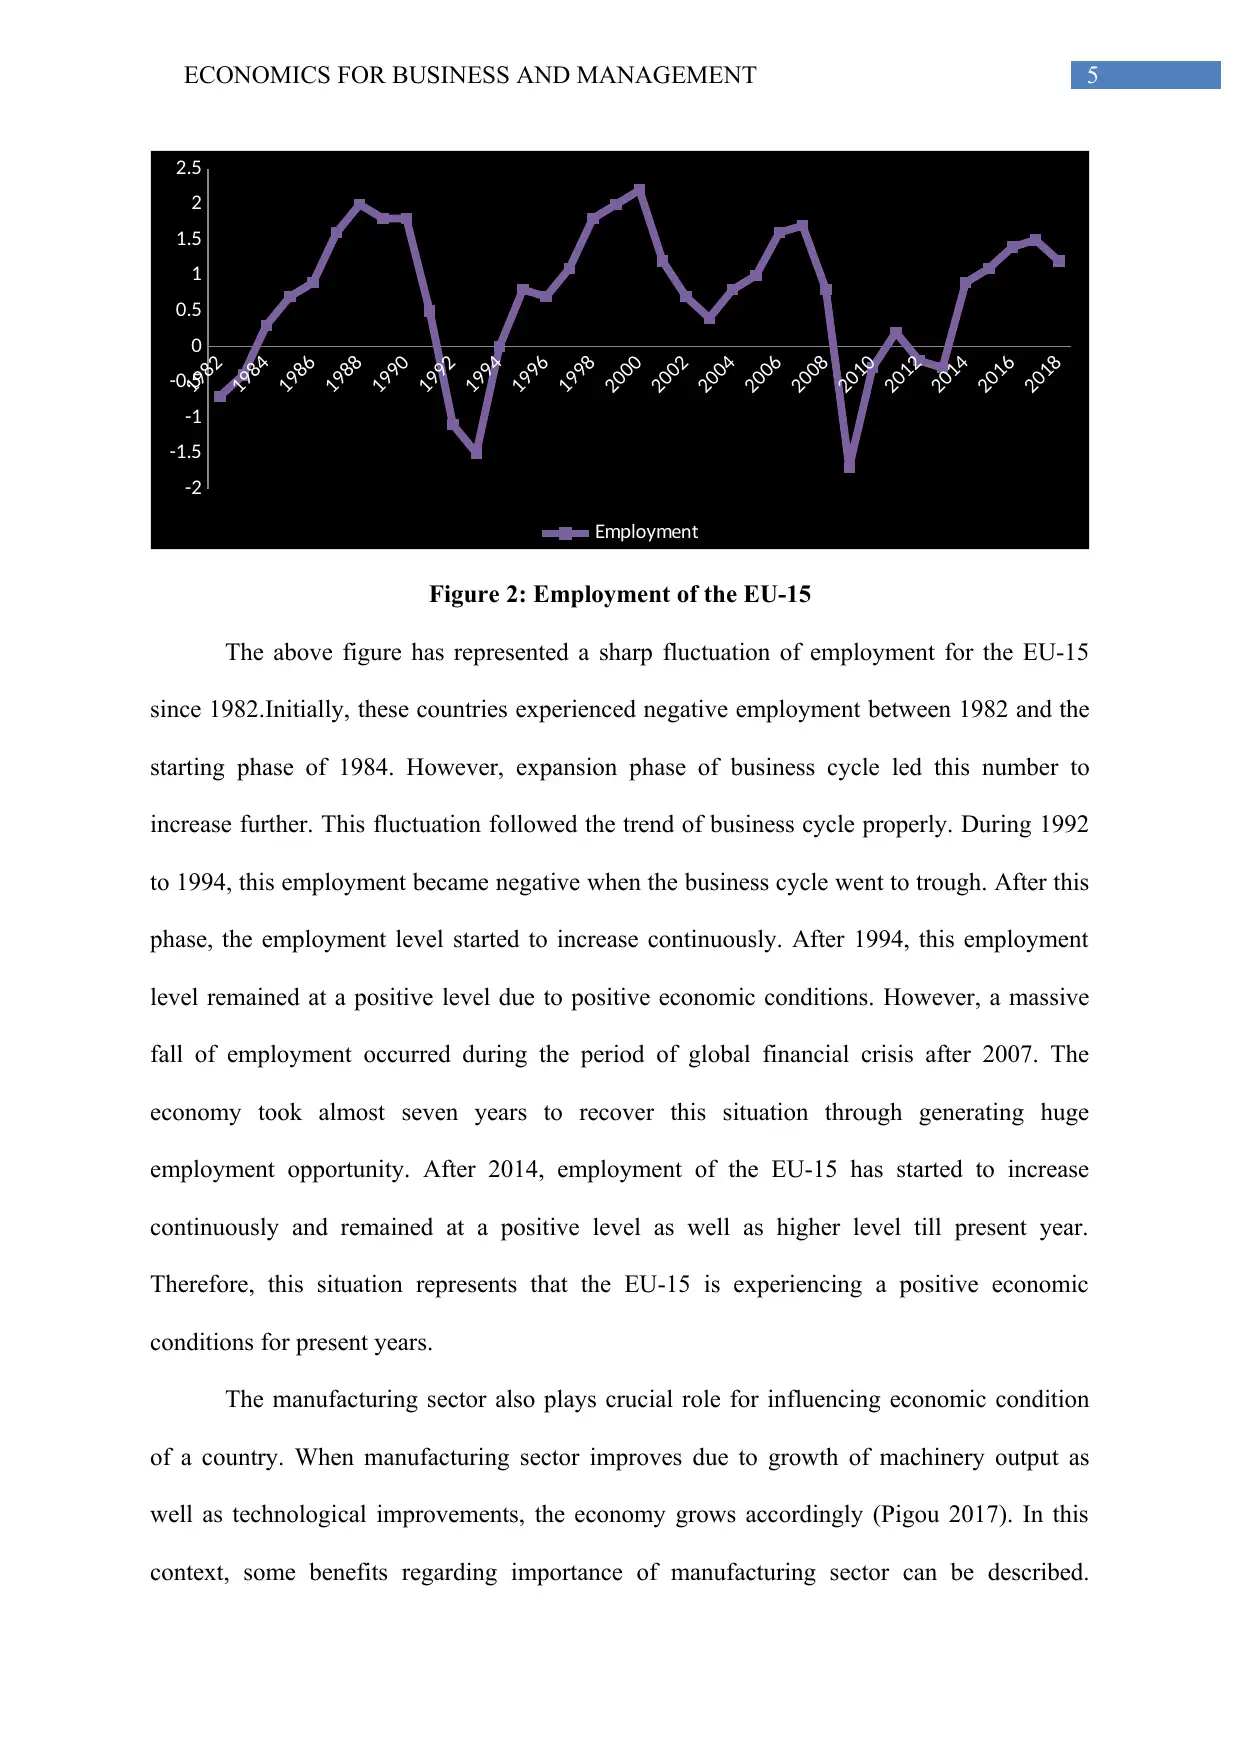
Figure 2: Employment of the EU-15
The above figure has represented a sharp fluctuation of employment for the EU-15
since 1982.Initially, these countries experienced negative employment between 1982 and the
starting phase of 1984. However, expansion phase of business cycle led this number to
increase further. This fluctuation followed the trend of business cycle properly. During 1992
to 1994, this employment became negative when the business cycle went to trough. After this
phase, the employment level started to increase continuously. After 1994, this employment
level remained at a positive level due to positive economic conditions. However, a massive
fall of employment occurred during the period of global financial crisis after 2007. The
economy took almost seven years to recover this situation through generating huge
employment opportunity. After 2014, employment of the EU-15 has started to increase
continuously and remained at a positive level as well as higher level till present year.
Therefore, this situation represents that the EU-15 is experiencing a positive economic
conditions for present years.
The manufacturing sector also plays crucial role for influencing economic condition
of a country. When manufacturing sector improves due to growth of machinery output as
well as technological improvements, the economy grows accordingly (Pigou 2017). In this
context, some benefits regarding importance of manufacturing sector can be described.
1982
1984
1986
1988
1990
1992
1994
1996
1998
2000
2002
2004
2006
2008
2010
2012
2014
2016
2018
-2
-1.5
-1
-0.5
0
0.5
1
1.5
2
2.5
lo entEmp ym
Figure 2: Employment of the EU-15
The above figure has represented a sharp fluctuation of employment for the EU-15
since 1982.Initially, these countries experienced negative employment between 1982 and the
starting phase of 1984. However, expansion phase of business cycle led this number to
increase further. This fluctuation followed the trend of business cycle properly. During 1992
to 1994, this employment became negative when the business cycle went to trough. After this
phase, the employment level started to increase continuously. After 1994, this employment
level remained at a positive level due to positive economic conditions. However, a massive
fall of employment occurred during the period of global financial crisis after 2007. The
economy took almost seven years to recover this situation through generating huge
employment opportunity. After 2014, employment of the EU-15 has started to increase
continuously and remained at a positive level as well as higher level till present year.
Therefore, this situation represents that the EU-15 is experiencing a positive economic
conditions for present years.
The manufacturing sector also plays crucial role for influencing economic condition
of a country. When manufacturing sector improves due to growth of machinery output as
well as technological improvements, the economy grows accordingly (Pigou 2017). In this
context, some benefits regarding importance of manufacturing sector can be described.
⊘ This is a preview!⊘
Do you want full access?
Subscribe today to unlock all pages.
Trusted by 1+ million students worldwide
6ECONOMICS FOR BUSINESS AND MANAGEMENT
Firstly, this sector helps an economy to develop through providing sufficient wealth and
power to the concerned country. Secondly, this improvement in manufacturing sector helps
the economy to experience significant power in international economy through capturing a
large share in international market. Thirdly, this sector causes economic growth as well
through increasing total output of the concerned economy (Machlup 2014). Moreover,
improvement in manufacturing sector contributes significant amount to national income
through exporting more products in international market. Therefore, through describing the
condition of manufacturing sectors in the EU-15, this report can sharply represent economic
condition of the EU-15. The following diagram represents this situation appropriately.
1982
1984
1986
1988
1990
1992
1994
1996
1998
2000
2002
2004
2006
2008
2010
2012
2014
2016
-20
-15
-10
-5
0
5
10
ndustrial rodu tion e e t onstru tionI p c ( xc p c c ) (%)
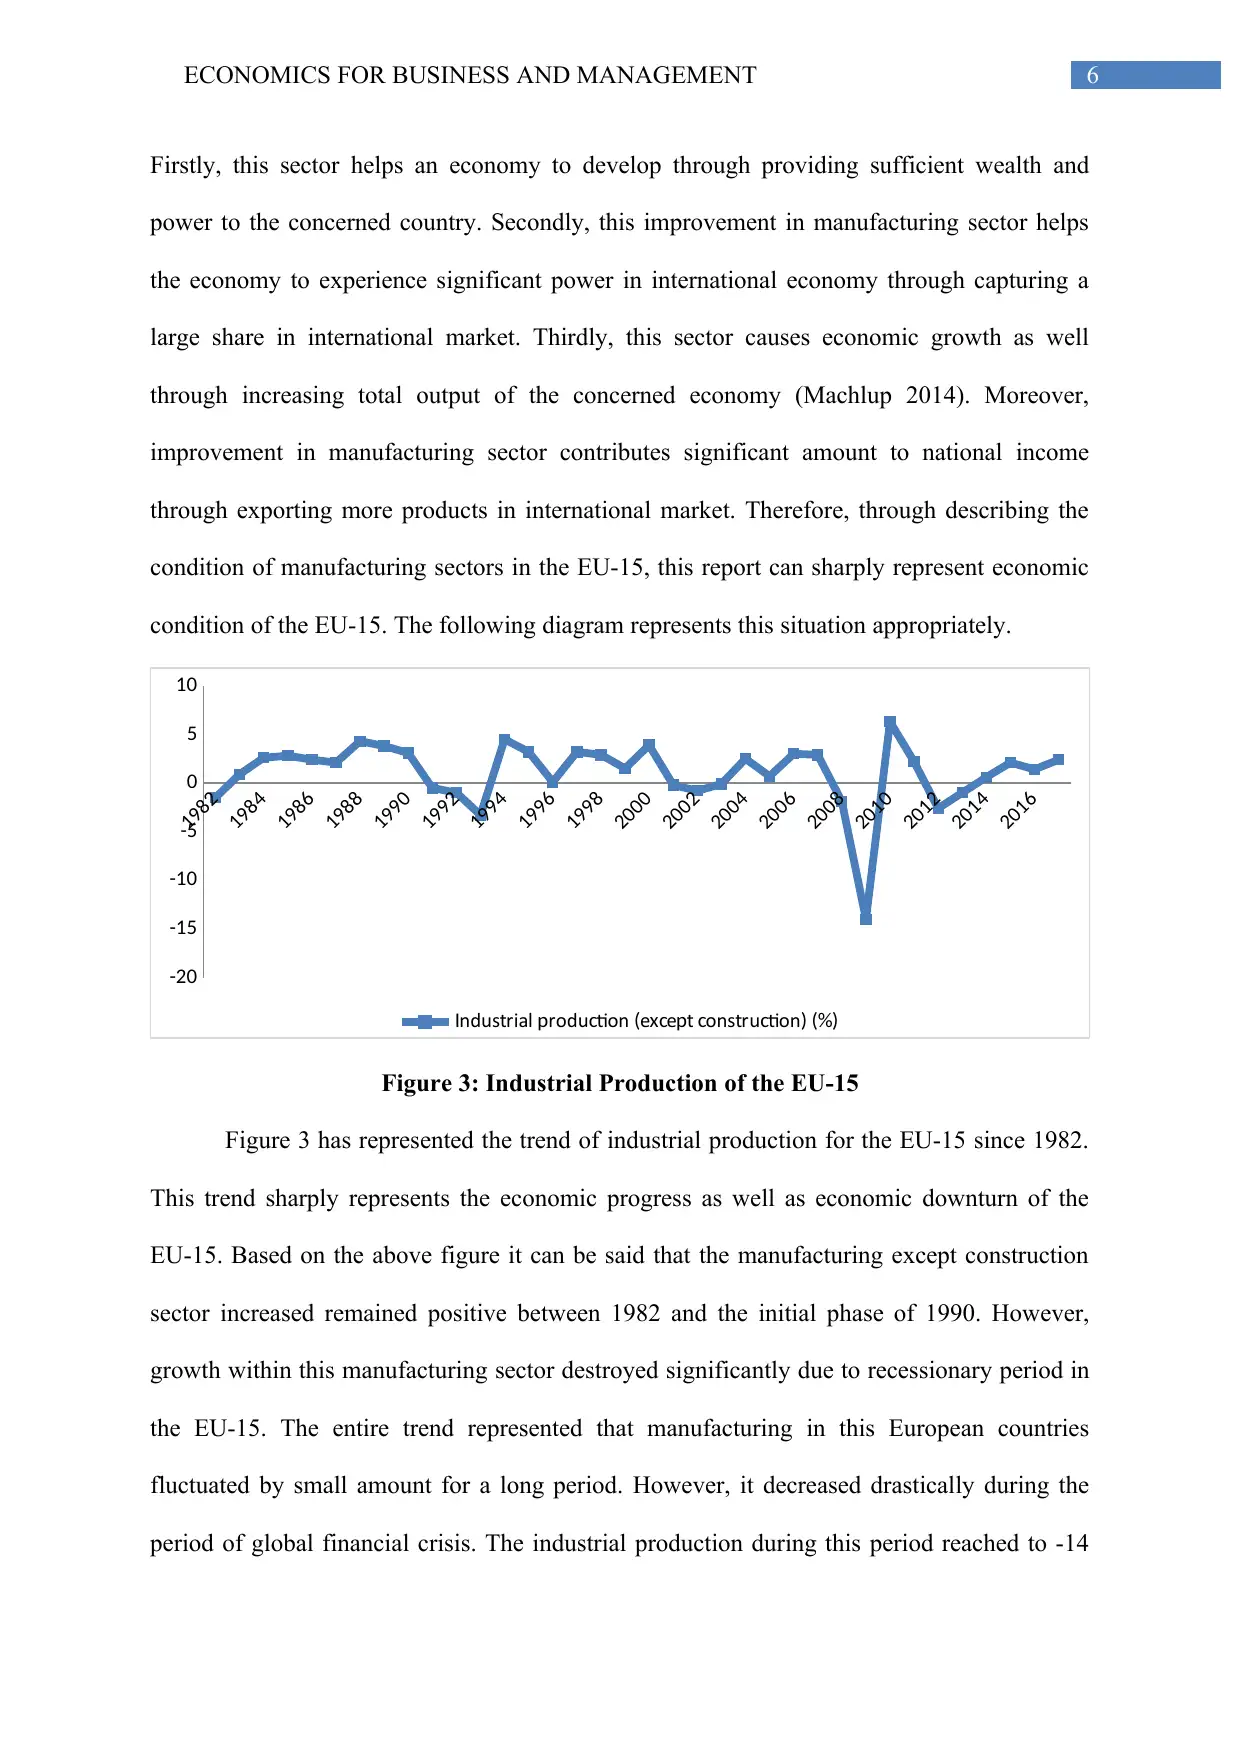
Figure 3: Industrial Production of the EU-15
Figure 3 has represented the trend of industrial production for the EU-15 since 1982.
This trend sharply represents the economic progress as well as economic downturn of the
EU-15. Based on the above figure it can be said that the manufacturing except construction
sector increased remained positive between 1982 and the initial phase of 1990. However,
growth within this manufacturing sector destroyed significantly due to recessionary period in
the EU-15. The entire trend represented that manufacturing in this European countries
fluctuated by small amount for a long period. However, it decreased drastically during the
period of global financial crisis. The industrial production during this period reached to -14
Firstly, this sector helps an economy to develop through providing sufficient wealth and
power to the concerned country. Secondly, this improvement in manufacturing sector helps
the economy to experience significant power in international economy through capturing a
large share in international market. Thirdly, this sector causes economic growth as well
through increasing total output of the concerned economy (Machlup 2014). Moreover,
improvement in manufacturing sector contributes significant amount to national income
through exporting more products in international market. Therefore, through describing the
condition of manufacturing sectors in the EU-15, this report can sharply represent economic
condition of the EU-15. The following diagram represents this situation appropriately.
1982
1984
1986
1988
1990
1992
1994
1996
1998
2000
2002
2004
2006
2008
2010
2012
2014
2016
-20
-15
-10
-5
0
5
10
ndustrial rodu tion e e t onstru tionI p c ( xc p c c ) (%)
Figure 3: Industrial Production of the EU-15
Figure 3 has represented the trend of industrial production for the EU-15 since 1982.
This trend sharply represents the economic progress as well as economic downturn of the
EU-15. Based on the above figure it can be said that the manufacturing except construction
sector increased remained positive between 1982 and the initial phase of 1990. However,
growth within this manufacturing sector destroyed significantly due to recessionary period in
the EU-15. The entire trend represented that manufacturing in this European countries
fluctuated by small amount for a long period. However, it decreased drastically during the
period of global financial crisis. The industrial production during this period reached to -14
Paraphrase This Document
Need a fresh take? Get an instant paraphrase of this document with our AI Paraphraser
7ECONOMICS FOR BUSINESS AND MANAGEMENT
percent, representing an adverse economic condition of these countries. The economy
recovered from this situation significantly after 2009. At present, industrial production is
increasing again this will generate a positive impact for business sectors within these
countries significantly.
Task c
After considering macroeconomic condition of the EU-15 by discussing business
cycles along with employment and industrial production, the report can come to a conclusion.
Based on these outcomes, the report can state that the economy of these countries is
maintaining a positive environment for all business sectors along with other sectors of the
economy. Expansionary period helps the country to generate more employment, increase per
capita income and enhance industrial production. This in turn can help the European
countries to invest sufficient amount of money for developing the communications along with
infrastructure for electric vehicles during the medium term. To produce electric vehicles, each
country requires higher technology as well as infrastructure. In this context, it will be
beneficial to discuss about some positive sides of communication as well as infrastructure for
an economy.
Through analysing the world economy, it can be seen that developed infrastructure
along with communication helps a country to develop significantly compare to other
countries. Physical communication by road, air and water can help a company to transport its
final goods to target market. Moreover, the company can easily purchase and import raw
materials from other international as well internal market within short period. Electricity is
also considered as an essential component of infrastructure. Insufficient supply of power can
hamper production system by large extend (Amann, Baer, Trebat and Lora 2016). Therefore,
the government of any country experiences the significant importance of investment in these
infrastructural and communicational sectors. No country can develop its industrial output
8ECONOMICS FOR BUSINESS AND MANAGEMENT
without the help of this infrastructural sector. Most of the Western countries have invested
huge amount of money to develop this specified sector. Investment in infrastructural sector
acts as a multiplier for economic growth and development through manufacturing ports,
highways and airports. This investment further helps the country to produce more
construction products along with raw materials and wages. This in turn helps any company to
develop at a faster rate. Therefore, investment in infrastructural sector generates hardware of
the country (Ansar, Flyvbjerg, Budzier and Lunn 2016). In addition to this, the investment
also influences software of the country by large extend. This concept considers human
capital, which is very crucial to produce any product within an industry (Henckel and
McKibbin 2017). For companies, which use modern technology, hiring of skilled labour is
essential. For this, the economy needs to investment sufficient amount of money in health
care and educational system to improve standard of living of people.
Therefore, it can be said from the above discussion that proper investment in
communication and infrastructure sector is essential for the purpose of development.
Therefore, it is essential to observe and analyse potentiality of a country based on some
macroeconomic factors. The initial macroeconomic factor is gross domestic product. The real
gross domestic product of the EU-15 has increased during the last few years. This further
helps the country to measure its economic growth based on money expenditures. Increasing
value of this economic indicator can significantly help the country to show the potentially for
investing money in different economic sectors. In addition to this, a relationship between
expenditure and production can also represent economic condition of the country. Increasing
aggregate demand of the country indicates economic growth of the country.
⊘ This is a preview!⊘
Do you want full access?
Subscribe today to unlock all pages.
Trusted by 1+ million students worldwide
9ECONOMICS FOR BUSINESS AND MANAGEMENT
1980 1985 1990 1995 2000 2005 2010 2015 2020
54
55
56
57
58
59
ri ate final onsu tionP v c mp (%)
ri ate final onsu tionP v c mp (%)
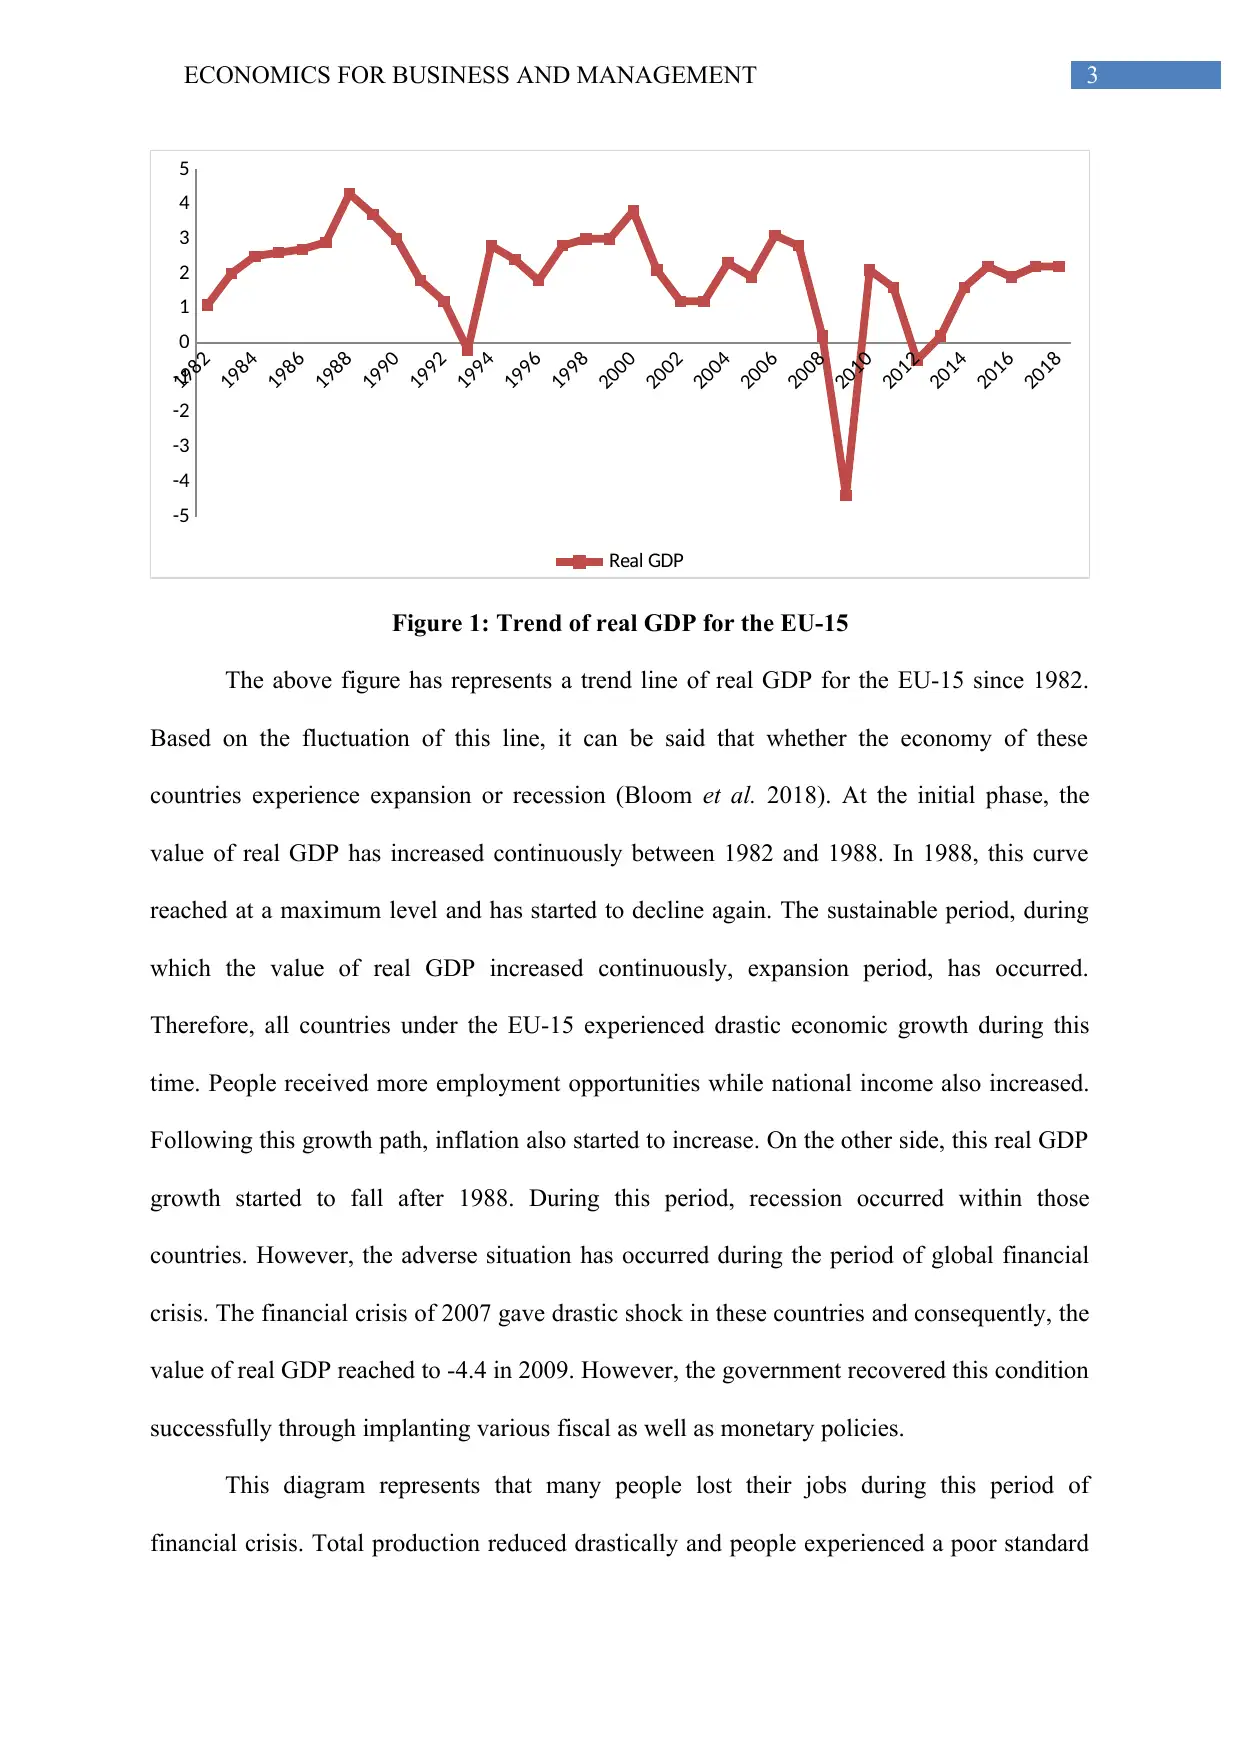
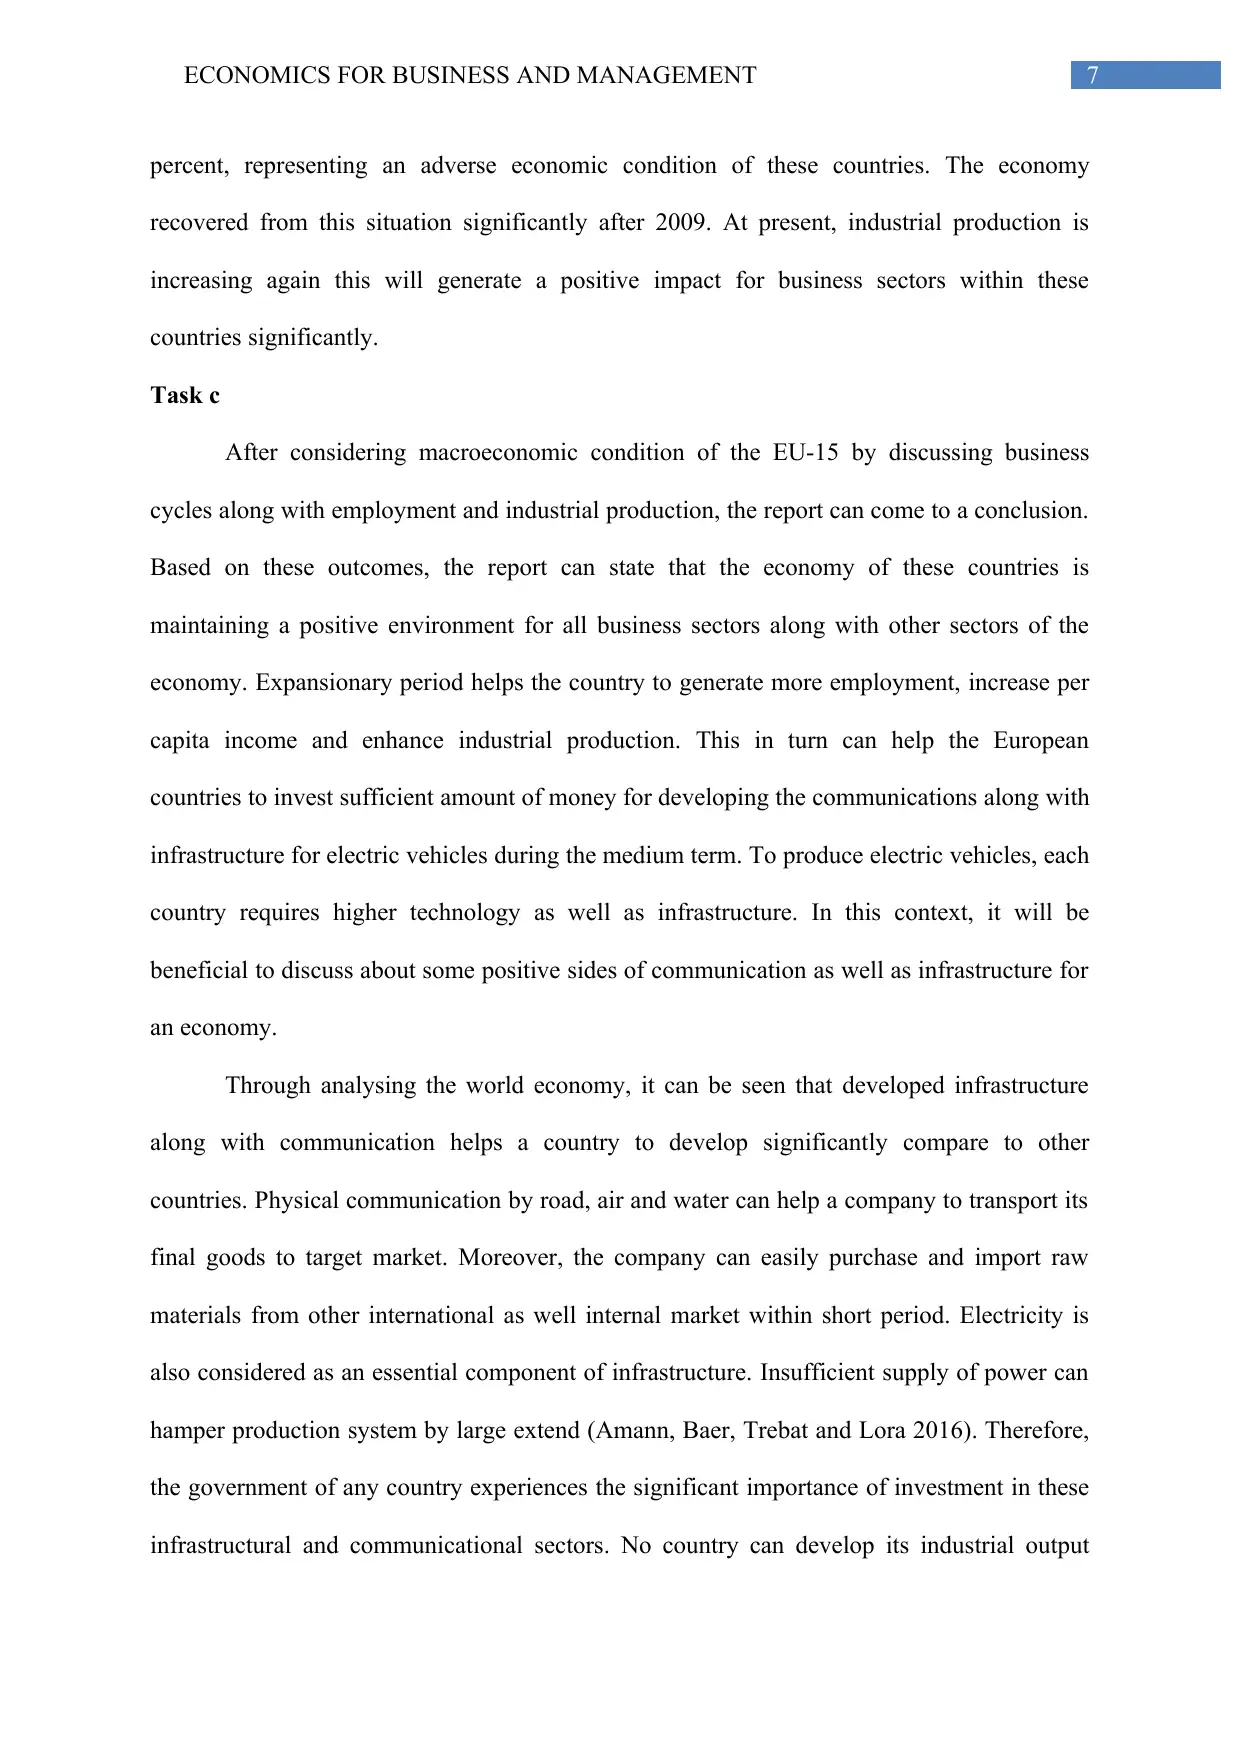
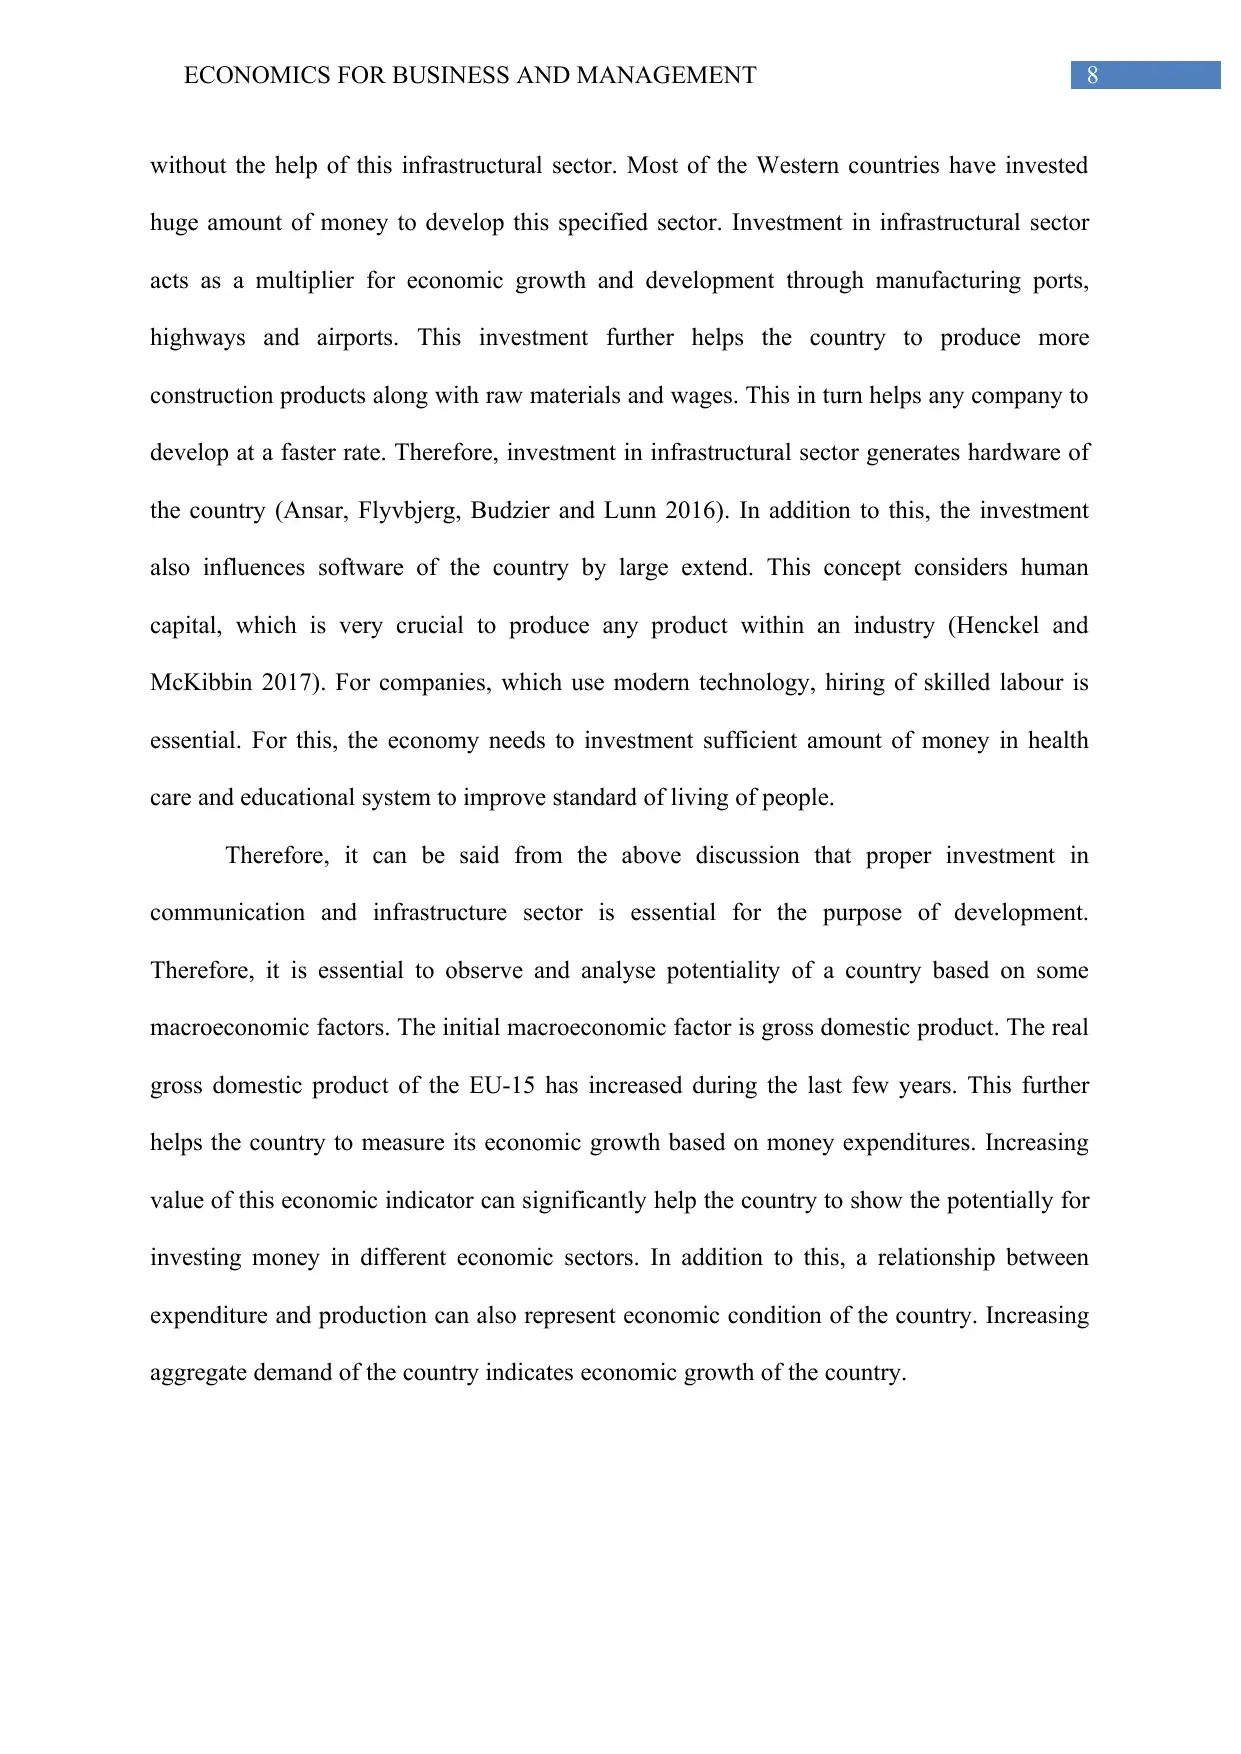
Figure 4: Private Consumption of the EU-15
The above figure represents private final consumption of the EU-15 since 1982. This
represents a negative trend indicating that private consumption has decreased over the year
due to some economic reasons. During the period of global financial crisis, the private
consumption has reduced (Serrano and Summa 2015). However, the government has
remained unable to improve this economic condition over the year. This inverse outcome of
aggregate demand represents that the EU-15 needs to provide more effort to improve this
economic condition (Ebell and Warren 2016). Moreover, productivity in industrial sector
does not provide any significant outcome. This value in terms of annual percentage shows
negative value in the year 2013. In the next year, this value increases with comparatively
lower percentage. Therefore, the EU-15 does not show enough potentiality to produce certain
amount of industrial output except construction sector.
1980 1985 1990 1995 2000 2005 2010 2015 2020
17
18
19
20
21
22
23
o ern ent onsu tionG v m c mp (%)
o ern ent onsu tionG v m c mp (%)
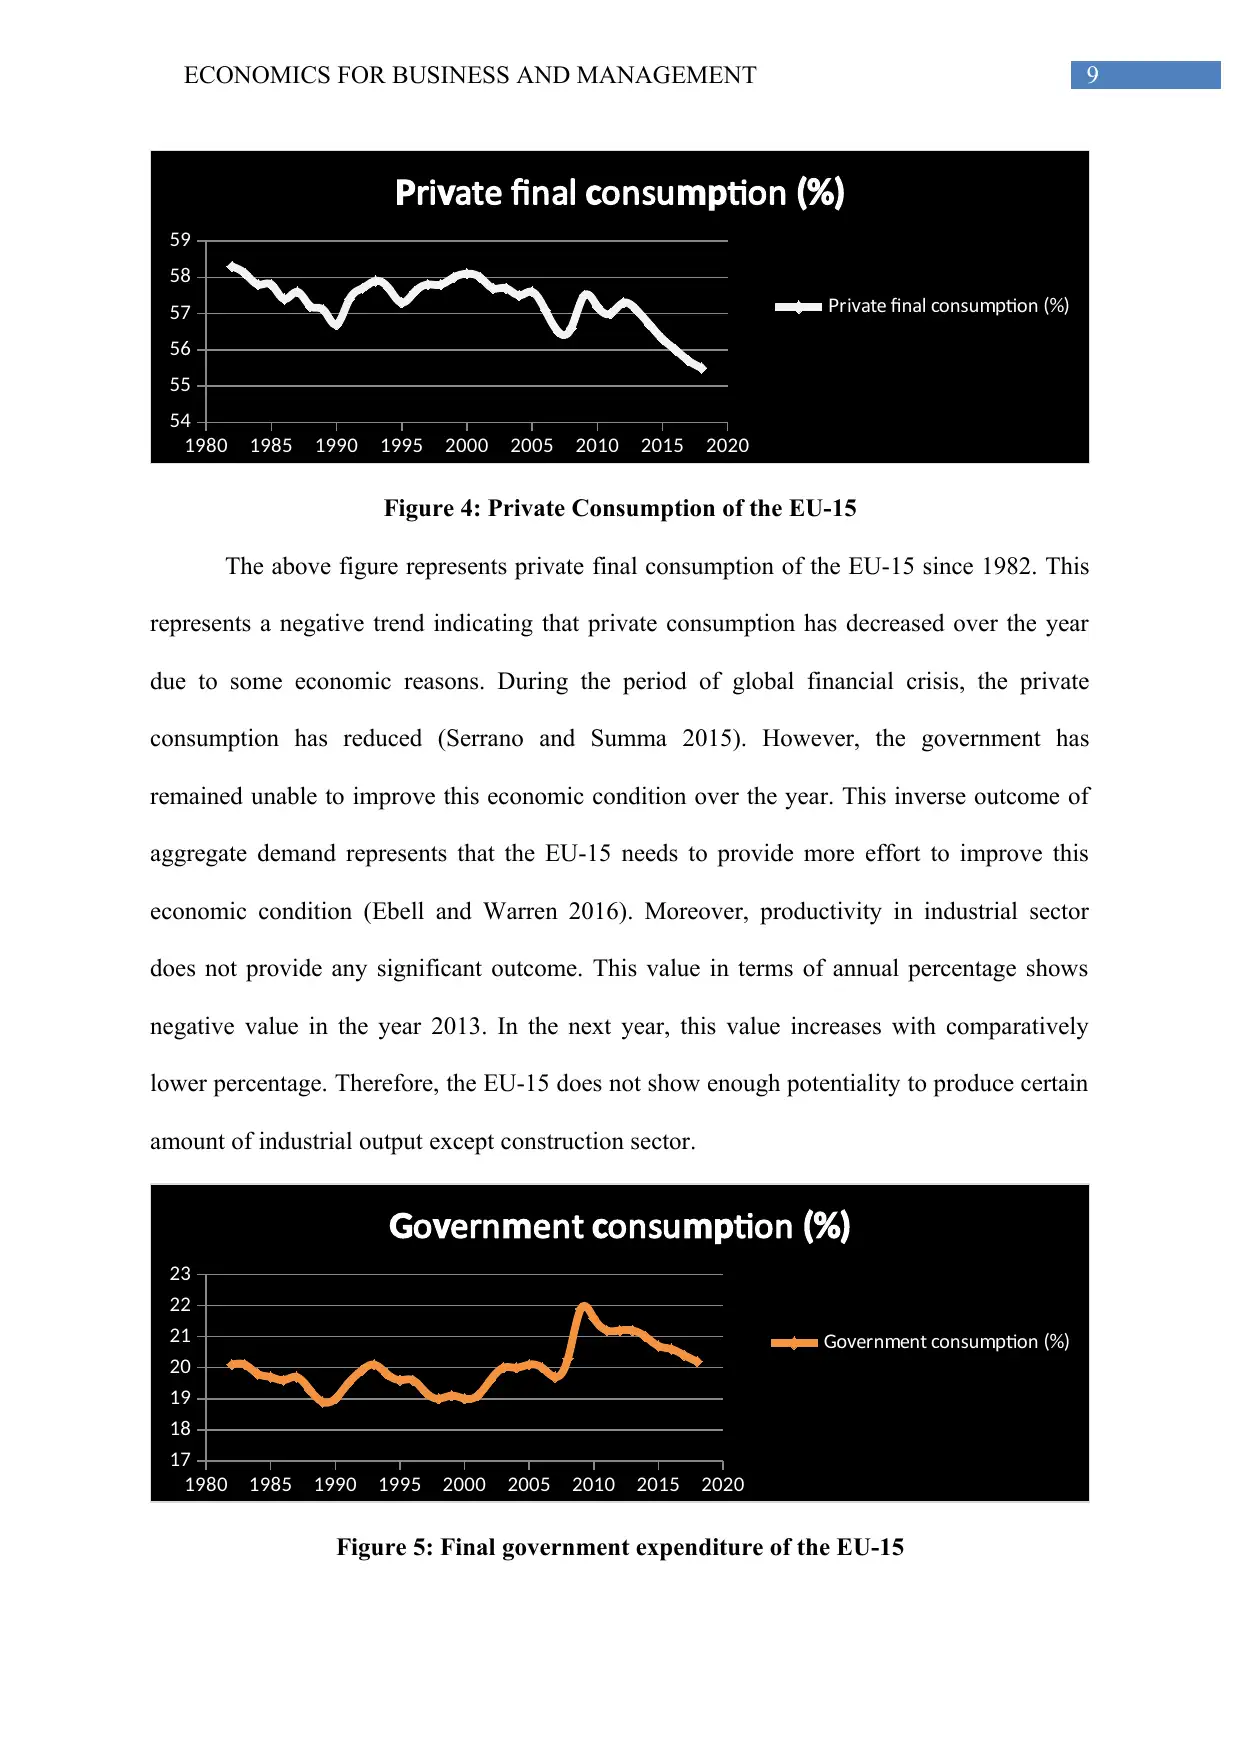
Figure 5: Final government expenditure of the EU-15
1980 1985 1990 1995 2000 2005 2010 2015 2020
54
55
56
57
58
59
ri ate final onsu tionP v c mp (%)
ri ate final onsu tionP v c mp (%)
Figure 4: Private Consumption of the EU-15
The above figure represents private final consumption of the EU-15 since 1982. This
represents a negative trend indicating that private consumption has decreased over the year
due to some economic reasons. During the period of global financial crisis, the private
consumption has reduced (Serrano and Summa 2015). However, the government has
remained unable to improve this economic condition over the year. This inverse outcome of
aggregate demand represents that the EU-15 needs to provide more effort to improve this
economic condition (Ebell and Warren 2016). Moreover, productivity in industrial sector
does not provide any significant outcome. This value in terms of annual percentage shows
negative value in the year 2013. In the next year, this value increases with comparatively
lower percentage. Therefore, the EU-15 does not show enough potentiality to produce certain
amount of industrial output except construction sector.
1980 1985 1990 1995 2000 2005 2010 2015 2020
17
18
19
20
21
22
23
o ern ent onsu tionG v m c mp (%)
o ern ent onsu tionG v m c mp (%)
Figure 5: Final government expenditure of the EU-15
Paraphrase This Document
Need a fresh take? Get an instant paraphrase of this document with our AI Paraphraser
10ECONOMICS FOR BUSINESS AND MANAGEMENT
The above figure represents final government expenditure of the EU-25 since 1982.
According to this trend, it can be said that government expenditure has remained was low
since 1982. The percentage value of final private consumption in terms of gross domestic
product has remained comparatively very high than that of government expenditure (Stiglitz
and Rosengard 2015). Moreover, this percentage of private consumptions has started to fall
after 2010. From here, it could be said that the economic condition of this EU-15 is declining
continuously. This in turn reflects that potentiality of the EU government for investing more
money in communication and infrastructure will reduce in further year. In this context, it
needs to mention that higher employment does not always reflect that the economy is
performing in a better way (Carvalho and Rezai 2015).
Conclusion:
Therefore, after discussing all related macroeconomic data of the EU-15 since 1982, it
can be said that the economic condition of this countries are experiencing many difficulties
Moreover, some factors have provided positive economic outcomes while some other factors
represent negative economic outcome. One of the chief reasons behind this peculiar
economic structure of the EU-15 is BREXIT. This political decision has influenced the
international economic system in both positive and negative directions. As a result, total
potentiality of those countries has reduced significantly. Therefore, the EU-15 does not have
enough potential to invest money infrastructure for electric car during medium term.
11ECONOMICS FOR BUSINESS AND MANAGEMENT
References:
Amann, E., Baer, W., Trebat, T. and Lora, J.V., 2016. Infrastructure and its role in Brazil's
development process. The Quarterly Review of Economics and Finance, 62, pp.66-73.
Ansar, A., Flyvbjerg, B., Budzier, A. and Lunn, D., 2016. Does infrastructure investment lead
to economic growth or economic fragility? Evidence from China. Oxford Review of
Economic Policy, 32(3), pp.360-390.
Bloom, N., Floetotto, M., Jaimovich, N., Saporta‐Eksten, I. and Terry, S.J., 2018. Really
uncertain business cycles. Econometrica, 86(3), pp.1031-1065.
Carvalho, L. and Rezai, A., 2015. Personal income inequality and aggregate
demand. Cambridge Journal of Economics, 40(2), pp.491-505.
De Grauwe, P., 2018. Economics of monetary union. Oxford university press.
Ebell, M. and Warren, J., 2016. The long-term economic impact of leaving the EU. National
Institute Economic Review, 236(1), pp.121-138.
Feldstein, M., 2017. Underestimating the real growth of GDP, personal income, and
productivity. Journal of Economic Perspectives, 31(2), pp.145-64.
Henckel, T. and McKibbin, W.J., 2017. The economics of infrastructure in a globalized
world: issues, lessons and future challenges. Journal of Infrastructure, Policy and
Development, 1(2), pp.254-272.
Llopis, J.A.S., Millán, J.M., Baptista, R., Burke, A., Parker, S.C. and Thurik, R., 2015. Good
times, bad times: entrepreneurship and the business cycle. International Entrepreneurship
and Management Journal, 11(2), pp.243-251.
Machlup, F., 2014. Knowledge: its creation, distribution and economic significance, Volume
I: Knowledge and knowledge production (Vol. 741). Princeton university press.
McCombie, J. and Thirlwall, A.P., 2016. Economic growth and the balance-of-payments
constraint. Springer.
⊘ This is a preview!⊘
Do you want full access?
Subscribe today to unlock all pages.
Trusted by 1+ million students worldwide
1 out of 13
Related Documents


Your All-in-One AI-Powered Toolkit for Academic Success.
+13062052269
info@desklib.com
Available 24*7 on WhatsApp / Email
![[object Object]](/_next/static/media/star-bottom.7253800d.svg)
Unlock your academic potential
Copyright © 2020–2026 A2Z Services. All Rights Reserved. Developed and managed by ZUCOL.