Nestle Market Analysis Project: Economics for Management 2018
VerifiedAdded on 2023/05/30
|18
|4158
|125
Report
AI Summary
This report provides a comprehensive neoclassical and behavioral economics analysis of Nestle, a multinational food and beverage company. It examines demand and supply dynamics for Nestle chocolates, focusing on factors like cocoa prices and consumer behavior. The report also delves into elasticity, cost patterns, market structure (monopolistic competition), and profit maximization strategies employed by Nestle. Furthermore, it considers the impact of behavioral economics on Nestle's decision-making processes, offering a holistic view of the company's market operations. Desklib is a platform where students can find similar solved assignments and past papers.
Running head: ECONOMICS FOR MANAGEMENT
Economics for Management
Name of the student
Name of the University
Author Note
Economics for Management
Name of the student
Name of the University
Author Note
Paraphrase This Document
Need a fresh take? Get an instant paraphrase of this document with our AI Paraphraser
1ECONOMICS FOR MANAGEMENT
Table of Contents
Introduction:...............................................................................................................................2
Neoclassical analysis of Nestle:.................................................................................................3
Demand and Supply:..............................................................................................................3
Elasticity:................................................................................................................................4
Behavioural economics of Nestle:.............................................................................................5
Conclusion:................................................................................................................................5
Cost pattern of Nestle:............................................................................................................8
Market structure of Nestle:.....................................................................................................9
Profit maximisation of Nestle:.............................................................................................10
Market Power:......................................................................................................................12
Behavioural Economics:..........................................................................................................13
Conclusion:..............................................................................................................................14
References:...............................................................................................................................15
2ECONOMICS FOR MANAGEMENT
Introduction:
Neoclassical economics represents an approach that deals with demand for and supply
of a product in market considering rationality of an individual and firm. The chief focus of
the firm is to maximise utility while for an individual the chief focus is utility maximisation.
To analyse these economic concepts, neoclassical economists intend to use mathematical
equations (Foss and Klein 2015). On the contrary, behavioural economics deals with
psychological aspects of a firm and producer regarding their decision-making processes (Pete
2014). In addition to this, the behavioural economics focuses to maximise expected utility of
a consumer. With the help of these two economic approaches, a firm takes its business
decisions regarding production of output and charging appropriate price. This paper conducts
this analysis on Nestle chocolates through considering its market decision-making process.
Nestle is a Switzerland based multinational company that produces drinks and foods.
Since 2014, it has remained the largest food producing company across the world in terms of
revenue. The company chiefly produces medical food, baby food, breakfast cereals and other
energy drinks like coffee and tea. Some well-known brands of this company are Nescafe,
Nespresso, Maggie and Kit Kat. In addition to this, Nestle is one of the largest shareholders
of L’Oreal, which is the largest cosmetic company of the world. The company has large
market share across the world though it competes with other large-scale chocolate producing
products. The entire market of Nestle depends heavily on cocoa market. The report will focus
on demand and supply of chocolate, demand elasticity, market structure and profit
maximisation condition of this firm. In addition to this, the report will discuss about
appropriate behavioural economics related to company’s activity.
⊘ This is a preview!⊘
Do you want full access?
Subscribe today to unlock all pages.
Trusted by 1+ million students worldwide
3ECONOMICS FOR MANAGEMENT
Neoclassical analysis of Nestle:
Demand and Supply:
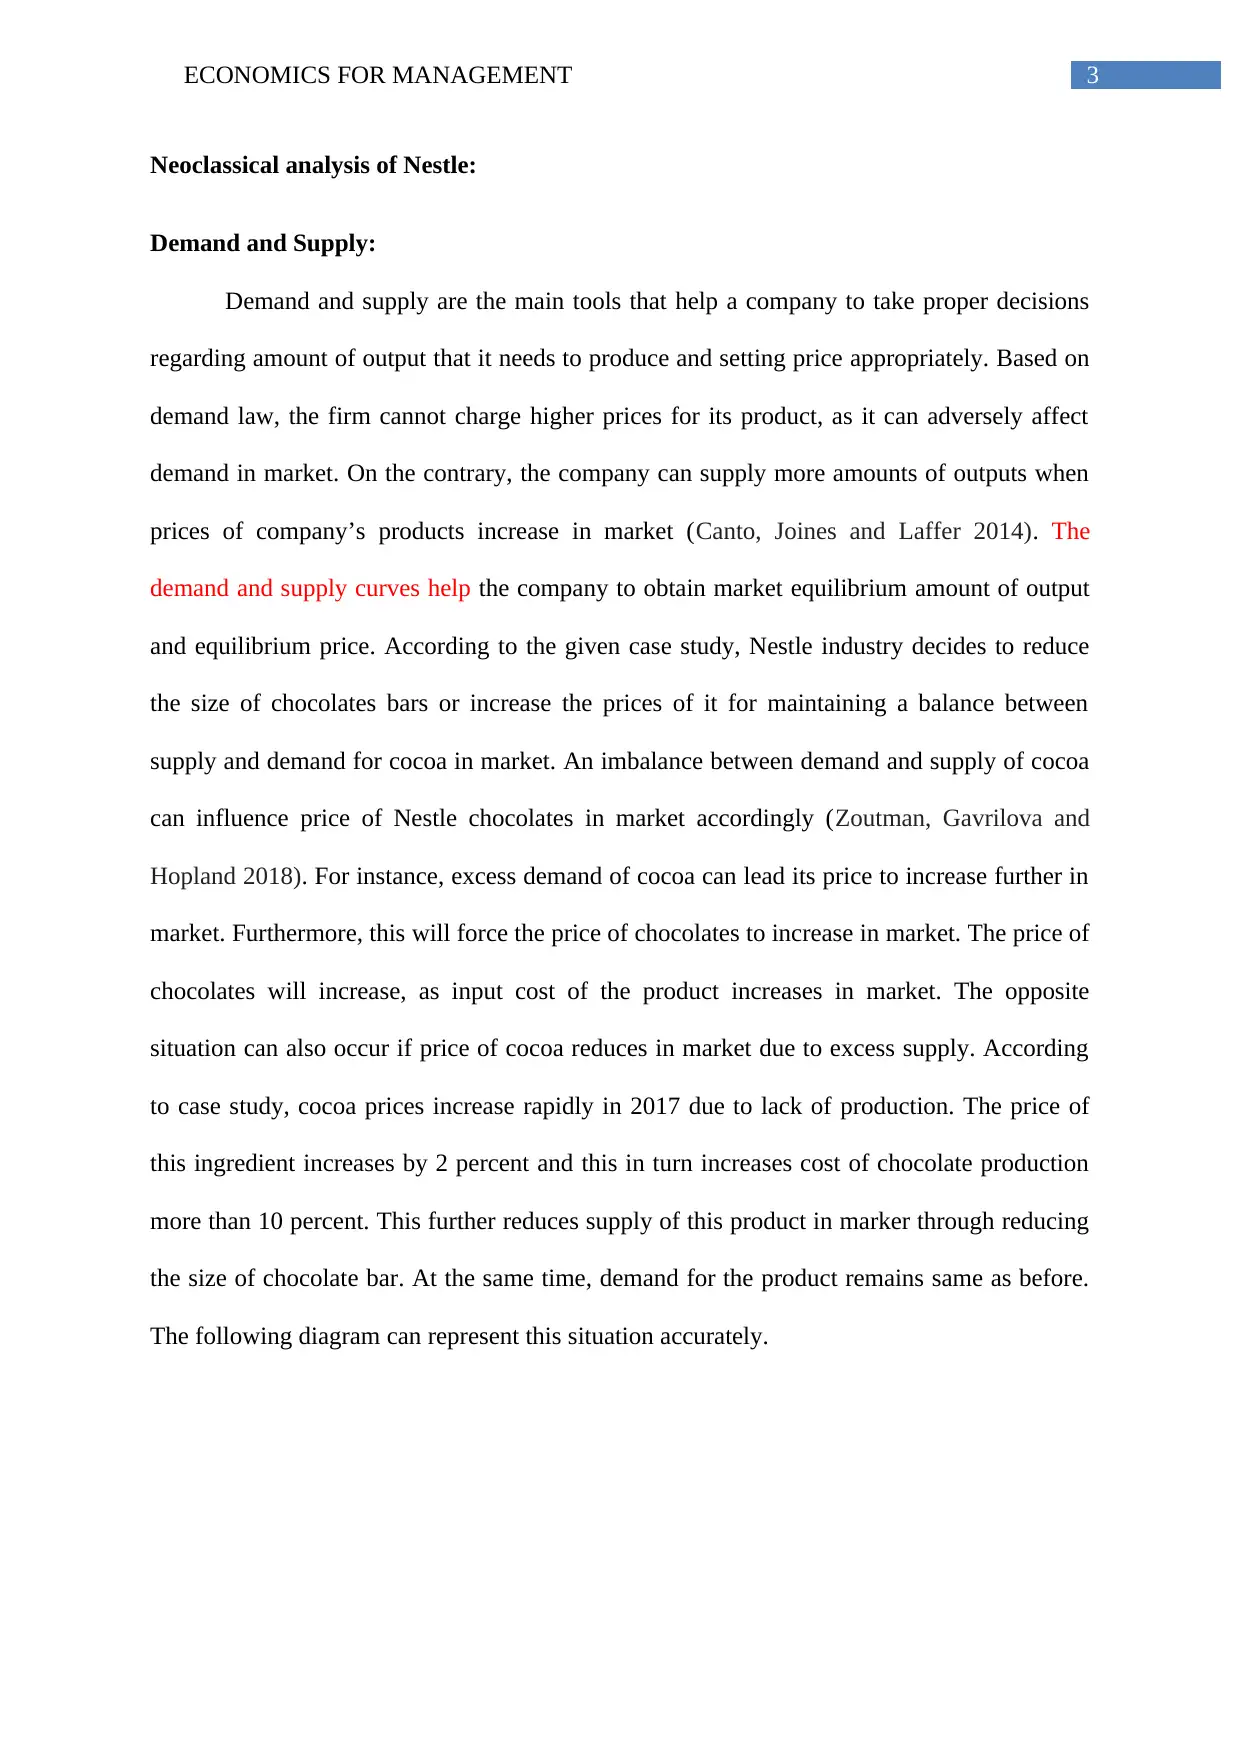
Demand and supply are the main tools that help a company to take proper decisions
regarding amount of output that it needs to produce and setting price appropriately. Based on
demand law, the firm cannot charge higher prices for its product, as it can adversely affect
demand in market. On the contrary, the company can supply more amounts of outputs when
prices of company’s products increase in market (Canto, Joines and Laffer 2014). The
demand and supply curves help the company to obtain market equilibrium amount of output
and equilibrium price. According to the given case study, Nestle industry decides to reduce
the size of chocolates bars or increase the prices of it for maintaining a balance between
supply and demand for cocoa in market. An imbalance between demand and supply of cocoa
can influence price of Nestle chocolates in market accordingly (Zoutman, Gavrilova and
Hopland 2018). For instance, excess demand of cocoa can lead its price to increase further in
market. Furthermore, this will force the price of chocolates to increase in market. The price of
chocolates will increase, as input cost of the product increases in market. The opposite
situation can also occur if price of cocoa reduces in market due to excess supply. According
to case study, cocoa prices increase rapidly in 2017 due to lack of production. The price of
this ingredient increases by 2 percent and this in turn increases cost of chocolate production
more than 10 percent. This further reduces supply of this product in marker through reducing
the size of chocolate bar. At the same time, demand for the product remains same as before.
The following diagram can represent this situation accurately.
Neoclassical analysis of Nestle:
Demand and Supply:
Demand and supply are the main tools that help a company to take proper decisions
regarding amount of output that it needs to produce and setting price appropriately. Based on
demand law, the firm cannot charge higher prices for its product, as it can adversely affect
demand in market. On the contrary, the company can supply more amounts of outputs when
prices of company’s products increase in market (Canto, Joines and Laffer 2014). The
demand and supply curves help the company to obtain market equilibrium amount of output
and equilibrium price. According to the given case study, Nestle industry decides to reduce
the size of chocolates bars or increase the prices of it for maintaining a balance between
supply and demand for cocoa in market. An imbalance between demand and supply of cocoa
can influence price of Nestle chocolates in market accordingly (Zoutman, Gavrilova and
Hopland 2018). For instance, excess demand of cocoa can lead its price to increase further in
market. Furthermore, this will force the price of chocolates to increase in market. The price of
chocolates will increase, as input cost of the product increases in market. The opposite
situation can also occur if price of cocoa reduces in market due to excess supply. According
to case study, cocoa prices increase rapidly in 2017 due to lack of production. The price of
this ingredient increases by 2 percent and this in turn increases cost of chocolate production
more than 10 percent. This further reduces supply of this product in marker through reducing
the size of chocolate bar. At the same time, demand for the product remains same as before.
The following diagram can represent this situation accurately.
Paraphrase This Document
Need a fresh take? Get an instant paraphrase of this document with our AI Paraphraser
4ECONOMICS FOR MANAGEMENT
D
S0
S1
Equilibrium amount of chocolate
Price of chocolate
P1
P0
O Q1 Q0
Figure 1: demand and supply of Nestle chocolates
Source: (created by author)
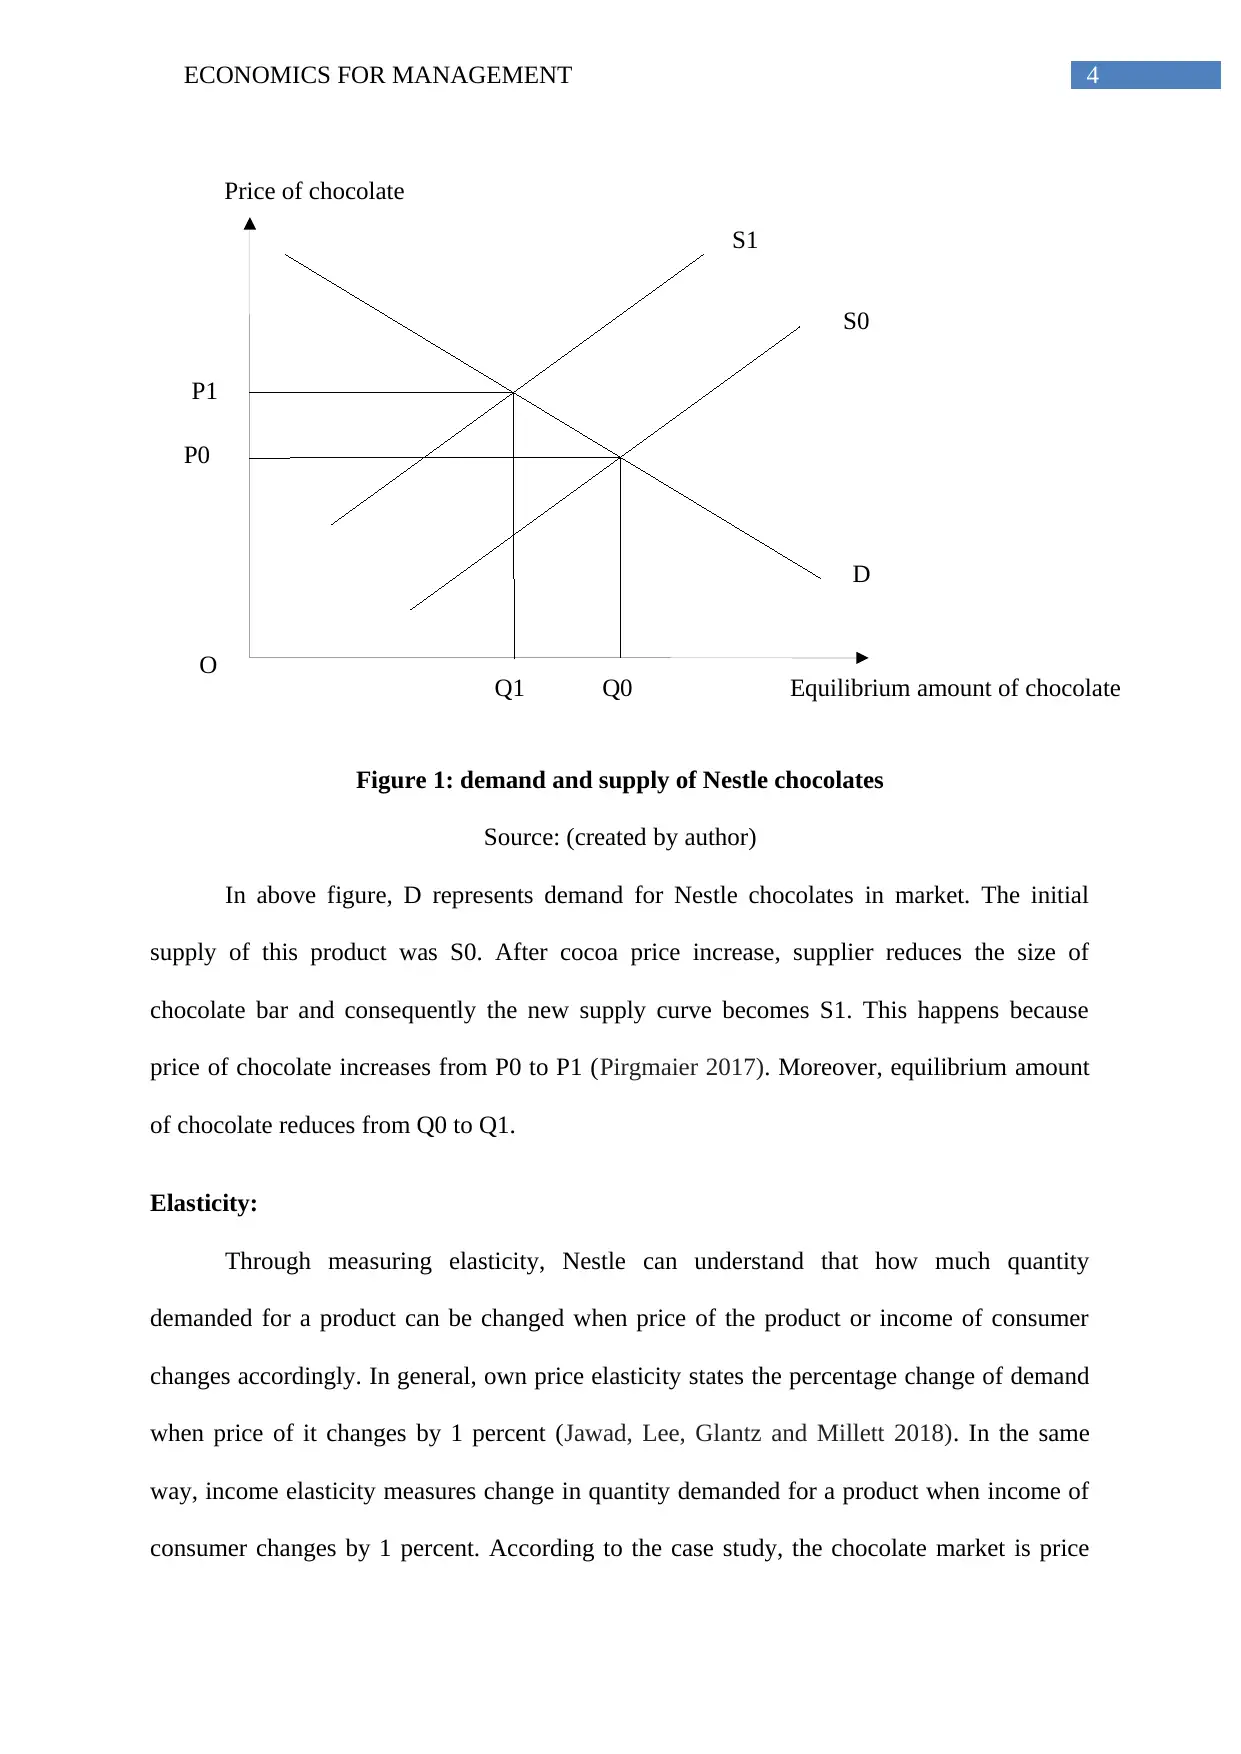
In above figure, D represents demand for Nestle chocolates in market. The initial
supply of this product was S0. After cocoa price increase, supplier reduces the size of
chocolate bar and consequently the new supply curve becomes S1. This happens because
price of chocolate increases from P0 to P1 (Pirgmaier 2017). Moreover, equilibrium amount
of chocolate reduces from Q0 to Q1.
Elasticity:
Through measuring elasticity, Nestle can understand that how much quantity
demanded for a product can be changed when price of the product or income of consumer
changes accordingly. In general, own price elasticity states the percentage change of demand
when price of it changes by 1 percent (Jawad, Lee, Glantz and Millett 2018). In the same
way, income elasticity measures change in quantity demanded for a product when income of
consumer changes by 1 percent. According to the case study, the chocolate market is price
D
S0
S1
Equilibrium amount of chocolate
Price of chocolate
P1
P0
O Q1 Q0
Figure 1: demand and supply of Nestle chocolates
Source: (created by author)
In above figure, D represents demand for Nestle chocolates in market. The initial
supply of this product was S0. After cocoa price increase, supplier reduces the size of
chocolate bar and consequently the new supply curve becomes S1. This happens because
price of chocolate increases from P0 to P1 (Pirgmaier 2017). Moreover, equilibrium amount
of chocolate reduces from Q0 to Q1.
Elasticity:
Through measuring elasticity, Nestle can understand that how much quantity
demanded for a product can be changed when price of the product or income of consumer
changes accordingly. In general, own price elasticity states the percentage change of demand
when price of it changes by 1 percent (Jawad, Lee, Glantz and Millett 2018). In the same
way, income elasticity measures change in quantity demanded for a product when income of
consumer changes by 1 percent. According to the case study, the chocolate market is price
5ECONOMICS FOR MANAGEMENT
Price of chocolate
P1
P0
D
O
Demand for chocolateQ1 Q0
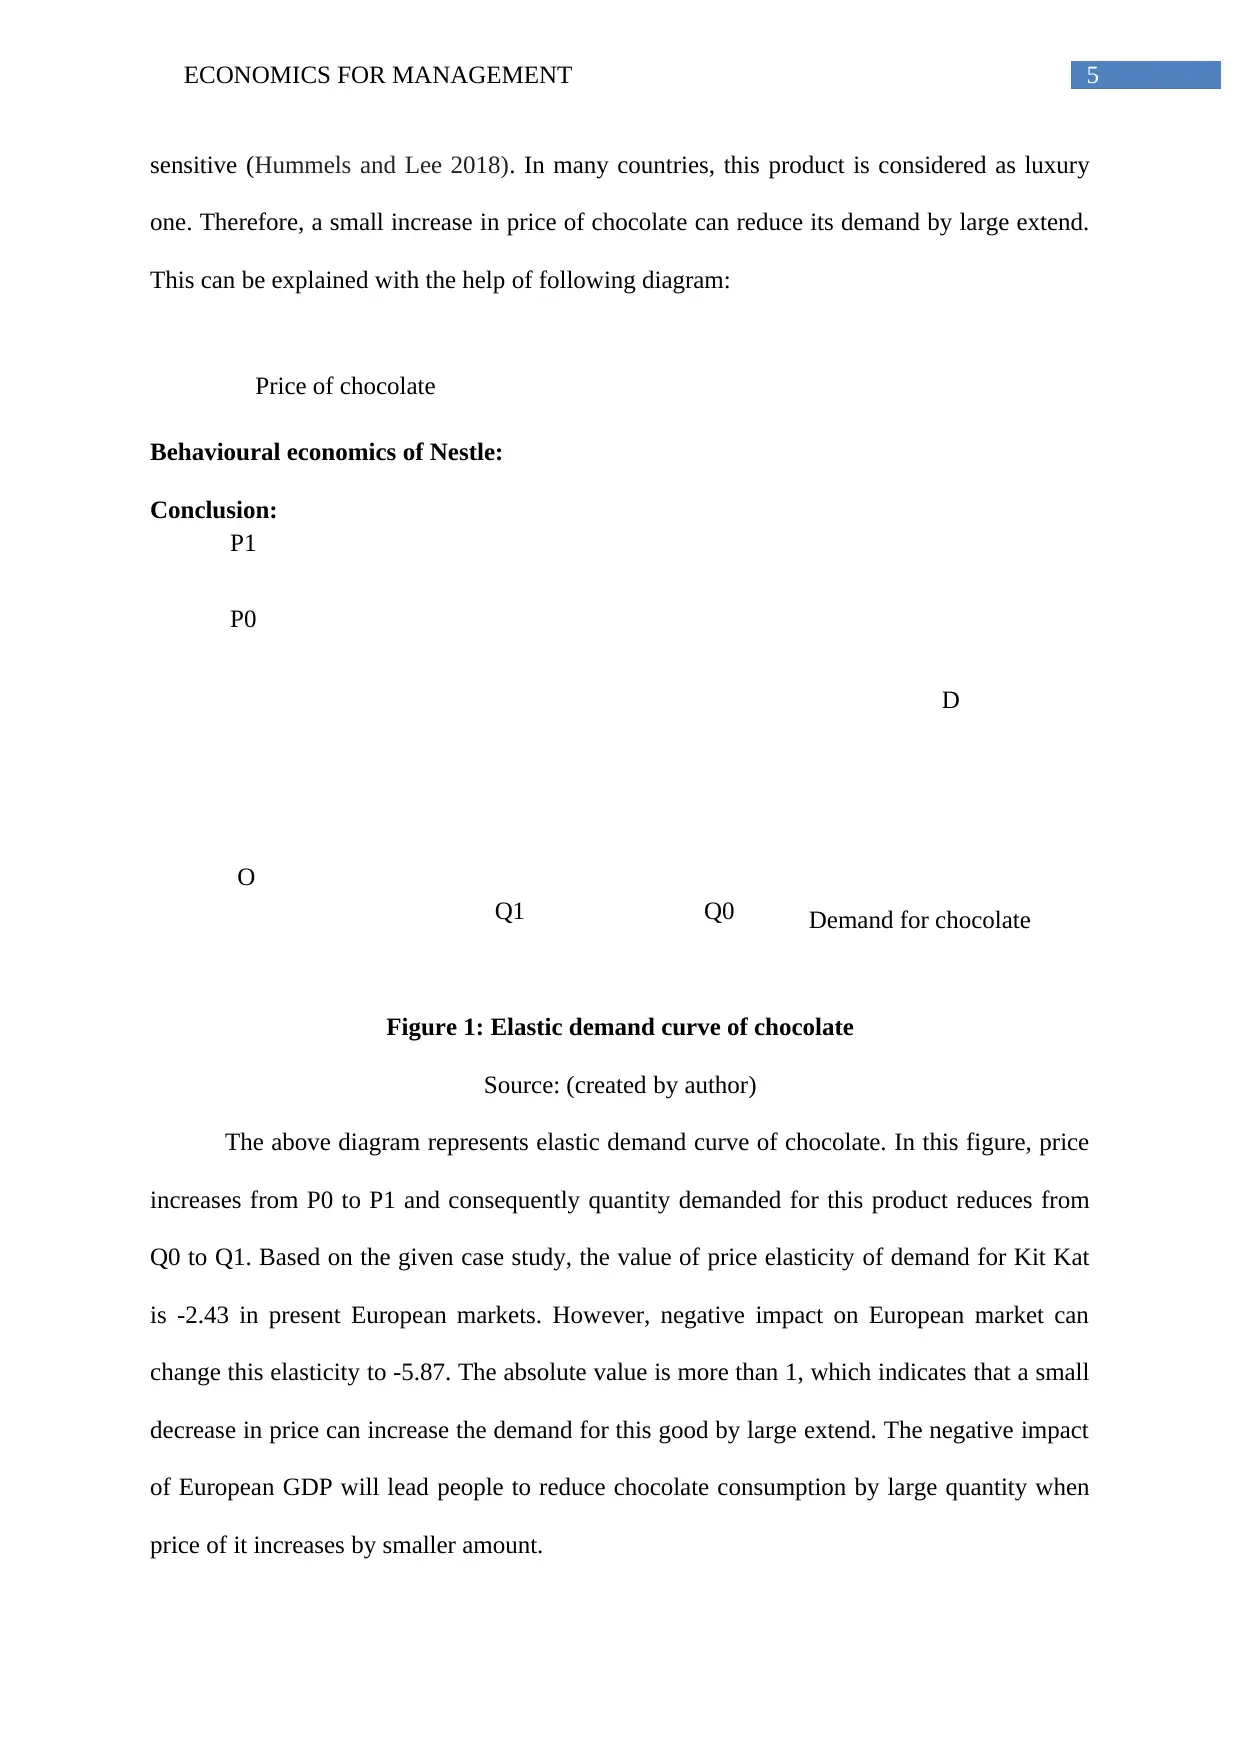
sensitive (Hummels and Lee 2018). In many countries, this product is considered as luxury
one. Therefore, a small increase in price of chocolate can reduce its demand by large extend.
This can be explained with the help of following diagram:
Behavioural economics of Nestle:
Conclusion:
Figure 1: Elastic demand curve of chocolate
Source: (created by author)
The above diagram represents elastic demand curve of chocolate. In this figure, price
increases from P0 to P1 and consequently quantity demanded for this product reduces from
Q0 to Q1. Based on the given case study, the value of price elasticity of demand for Kit Kat
is -2.43 in present European markets. However, negative impact on European market can
change this elasticity to -5.87. The absolute value is more than 1, which indicates that a small
decrease in price can increase the demand for this good by large extend. The negative impact
of European GDP will lead people to reduce chocolate consumption by large quantity when
price of it increases by smaller amount.
Price of chocolate
P1
P0
D
O
Demand for chocolateQ1 Q0
sensitive (Hummels and Lee 2018). In many countries, this product is considered as luxury
one. Therefore, a small increase in price of chocolate can reduce its demand by large extend.
This can be explained with the help of following diagram:
Behavioural economics of Nestle:
Conclusion:
Figure 1: Elastic demand curve of chocolate
Source: (created by author)
The above diagram represents elastic demand curve of chocolate. In this figure, price
increases from P0 to P1 and consequently quantity demanded for this product reduces from
Q0 to Q1. Based on the given case study, the value of price elasticity of demand for Kit Kat
is -2.43 in present European markets. However, negative impact on European market can
change this elasticity to -5.87. The absolute value is more than 1, which indicates that a small
decrease in price can increase the demand for this good by large extend. The negative impact
of European GDP will lead people to reduce chocolate consumption by large quantity when
price of it increases by smaller amount.
⊘ This is a preview!⊘
Do you want full access?
Subscribe today to unlock all pages.
Trusted by 1+ million students worldwide
6ECONOMICS FOR MANAGEMENT
Quantity demanded for chocolate
D
Income of consumer
O
I0
I1
Q0 Q1
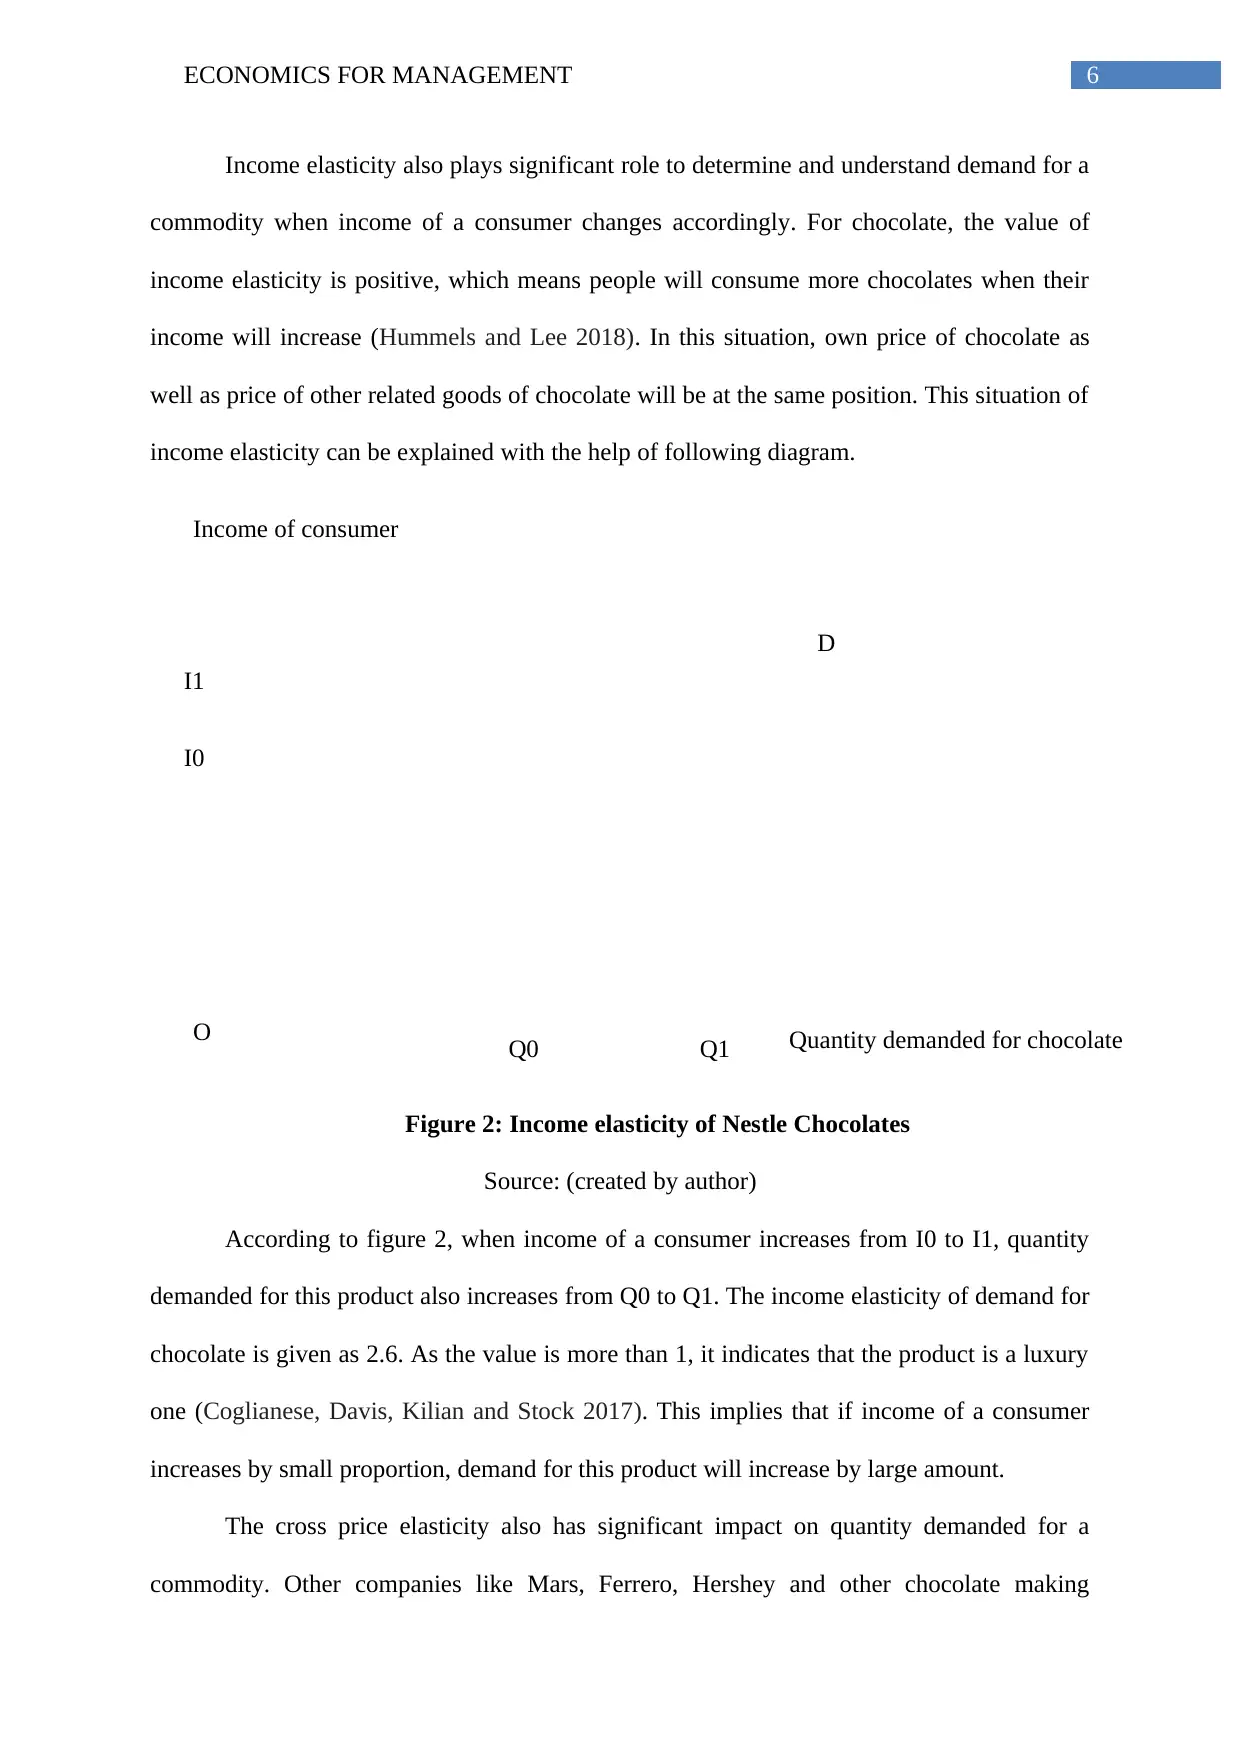
Income elasticity also plays significant role to determine and understand demand for a
commodity when income of a consumer changes accordingly. For chocolate, the value of
income elasticity is positive, which means people will consume more chocolates when their
income will increase (Hummels and Lee 2018). In this situation, own price of chocolate as
well as price of other related goods of chocolate will be at the same position. This situation of
income elasticity can be explained with the help of following diagram.
Figure 2: Income elasticity of Nestle Chocolates
Source: (created by author)
According to figure 2, when income of a consumer increases from I0 to I1, quantity
demanded for this product also increases from Q0 to Q1. The income elasticity of demand for
chocolate is given as 2.6. As the value is more than 1, it indicates that the product is a luxury
one (Coglianese, Davis, Kilian and Stock 2017). This implies that if income of a consumer
increases by small proportion, demand for this product will increase by large amount.
The cross price elasticity also has significant impact on quantity demanded for a
commodity. Other companies like Mars, Ferrero, Hershey and other chocolate making
Quantity demanded for chocolate
D
Income of consumer
O
I0
I1
Q0 Q1
Income elasticity also plays significant role to determine and understand demand for a
commodity when income of a consumer changes accordingly. For chocolate, the value of
income elasticity is positive, which means people will consume more chocolates when their
income will increase (Hummels and Lee 2018). In this situation, own price of chocolate as
well as price of other related goods of chocolate will be at the same position. This situation of
income elasticity can be explained with the help of following diagram.
Figure 2: Income elasticity of Nestle Chocolates
Source: (created by author)
According to figure 2, when income of a consumer increases from I0 to I1, quantity
demanded for this product also increases from Q0 to Q1. The income elasticity of demand for
chocolate is given as 2.6. As the value is more than 1, it indicates that the product is a luxury
one (Coglianese, Davis, Kilian and Stock 2017). This implies that if income of a consumer
increases by small proportion, demand for this product will increase by large amount.
The cross price elasticity also has significant impact on quantity demanded for a
commodity. Other companies like Mars, Ferrero, Hershey and other chocolate making
Paraphrase This Document
Need a fresh take? Get an instant paraphrase of this document with our AI Paraphraser
7ECONOMICS FOR MANAGEMENT
Quantity demanded for Nestle chocolates
D
Price of Ferrero chocolates
O
P0
P1
Q0 Q1
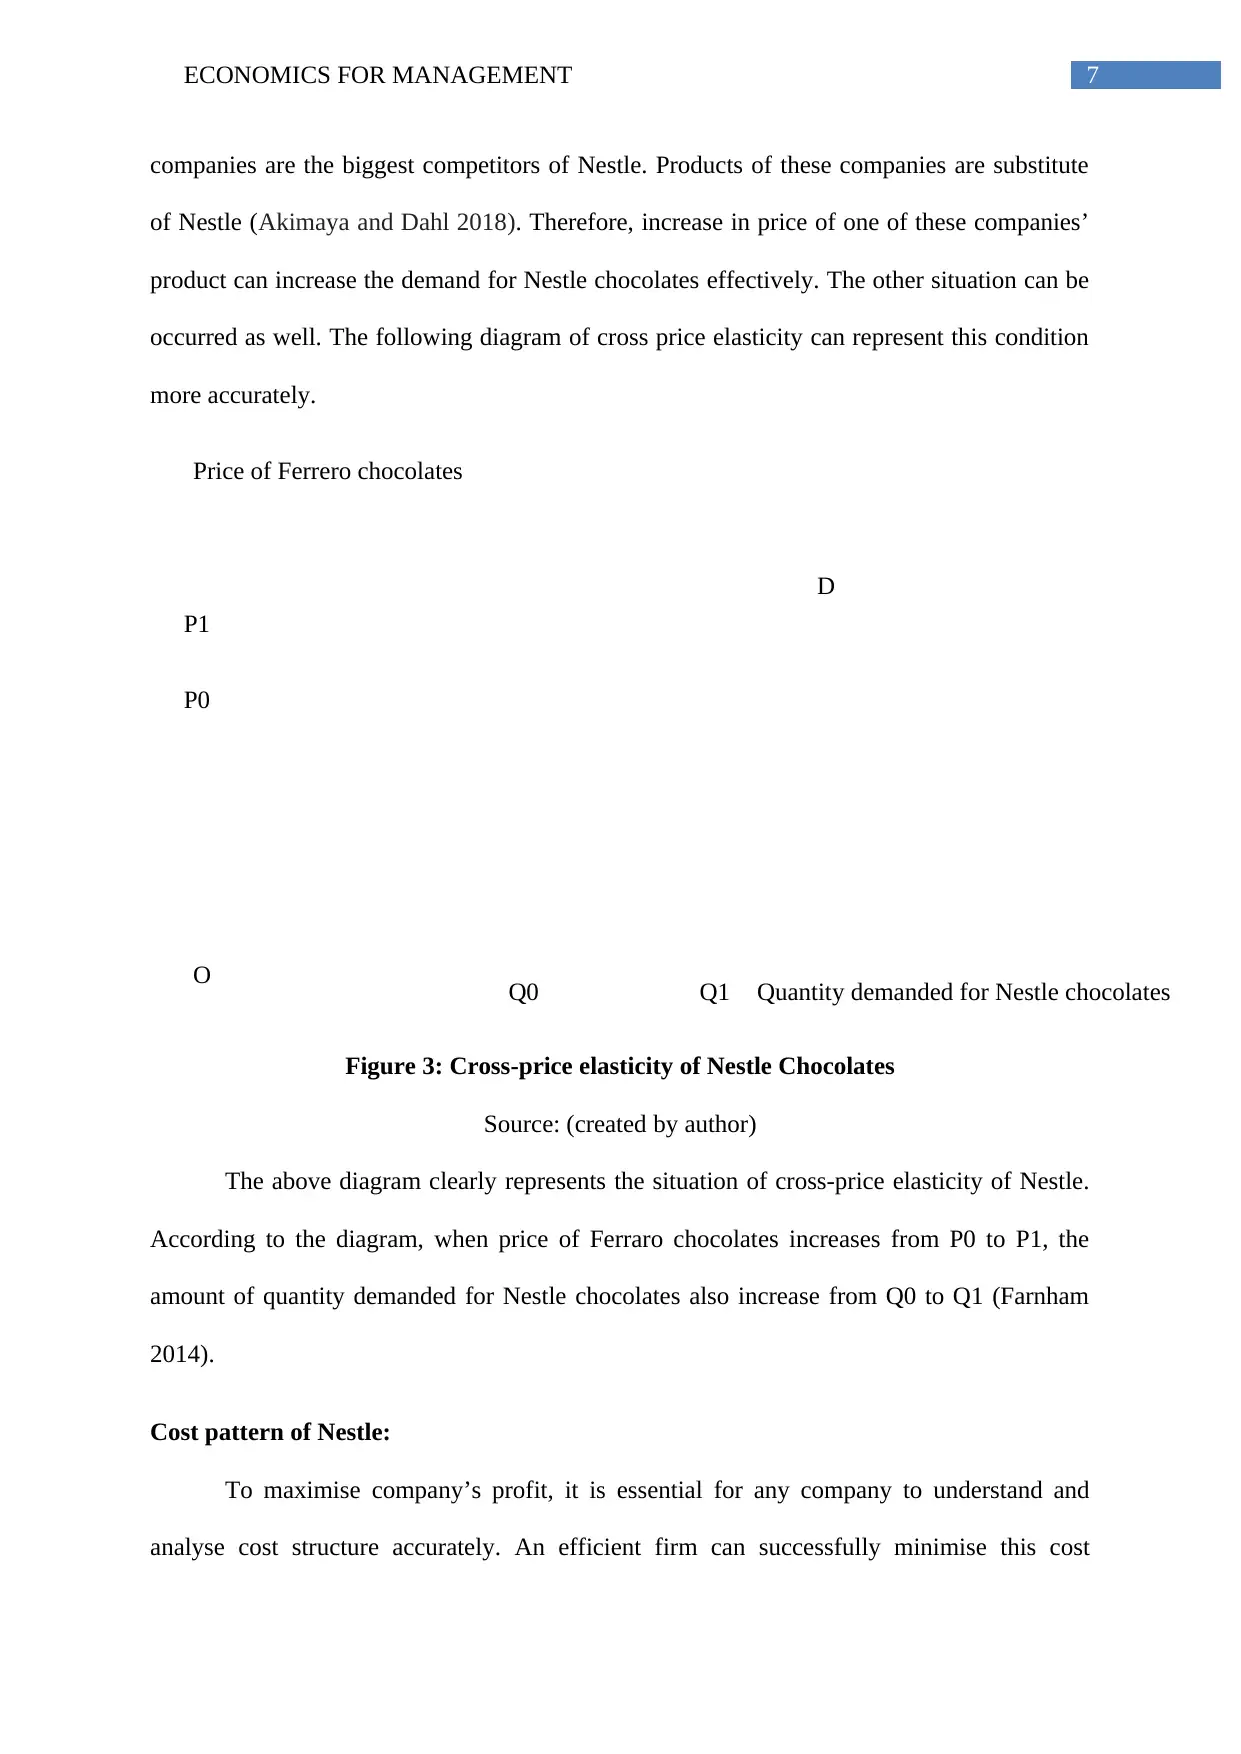
companies are the biggest competitors of Nestle. Products of these companies are substitute
of Nestle (Akimaya and Dahl 2018). Therefore, increase in price of one of these companies’
product can increase the demand for Nestle chocolates effectively. The other situation can be
occurred as well. The following diagram of cross price elasticity can represent this condition
more accurately.
Figure 3: Cross-price elasticity of Nestle Chocolates
Source: (created by author)
The above diagram clearly represents the situation of cross-price elasticity of Nestle.
According to the diagram, when price of Ferraro chocolates increases from P0 to P1, the
amount of quantity demanded for Nestle chocolates also increase from Q0 to Q1 (Farnham
2014).
Cost pattern of Nestle:
To maximise company’s profit, it is essential for any company to understand and
analyse cost structure accurately. An efficient firm can successfully minimise this cost
Quantity demanded for Nestle chocolates
D
Price of Ferrero chocolates
O
P0
P1
Q0 Q1
companies are the biggest competitors of Nestle. Products of these companies are substitute
of Nestle (Akimaya and Dahl 2018). Therefore, increase in price of one of these companies’
product can increase the demand for Nestle chocolates effectively. The other situation can be
occurred as well. The following diagram of cross price elasticity can represent this condition
more accurately.
Figure 3: Cross-price elasticity of Nestle Chocolates
Source: (created by author)
The above diagram clearly represents the situation of cross-price elasticity of Nestle.
According to the diagram, when price of Ferraro chocolates increases from P0 to P1, the
amount of quantity demanded for Nestle chocolates also increase from Q0 to Q1 (Farnham
2014).
Cost pattern of Nestle:
To maximise company’s profit, it is essential for any company to understand and
analyse cost structure accurately. An efficient firm can successfully minimise this cost
8ECONOMICS FOR MANAGEMENT
AFC
ATC, AFC, AVC, MC
Output
O
MC ATC
AVC
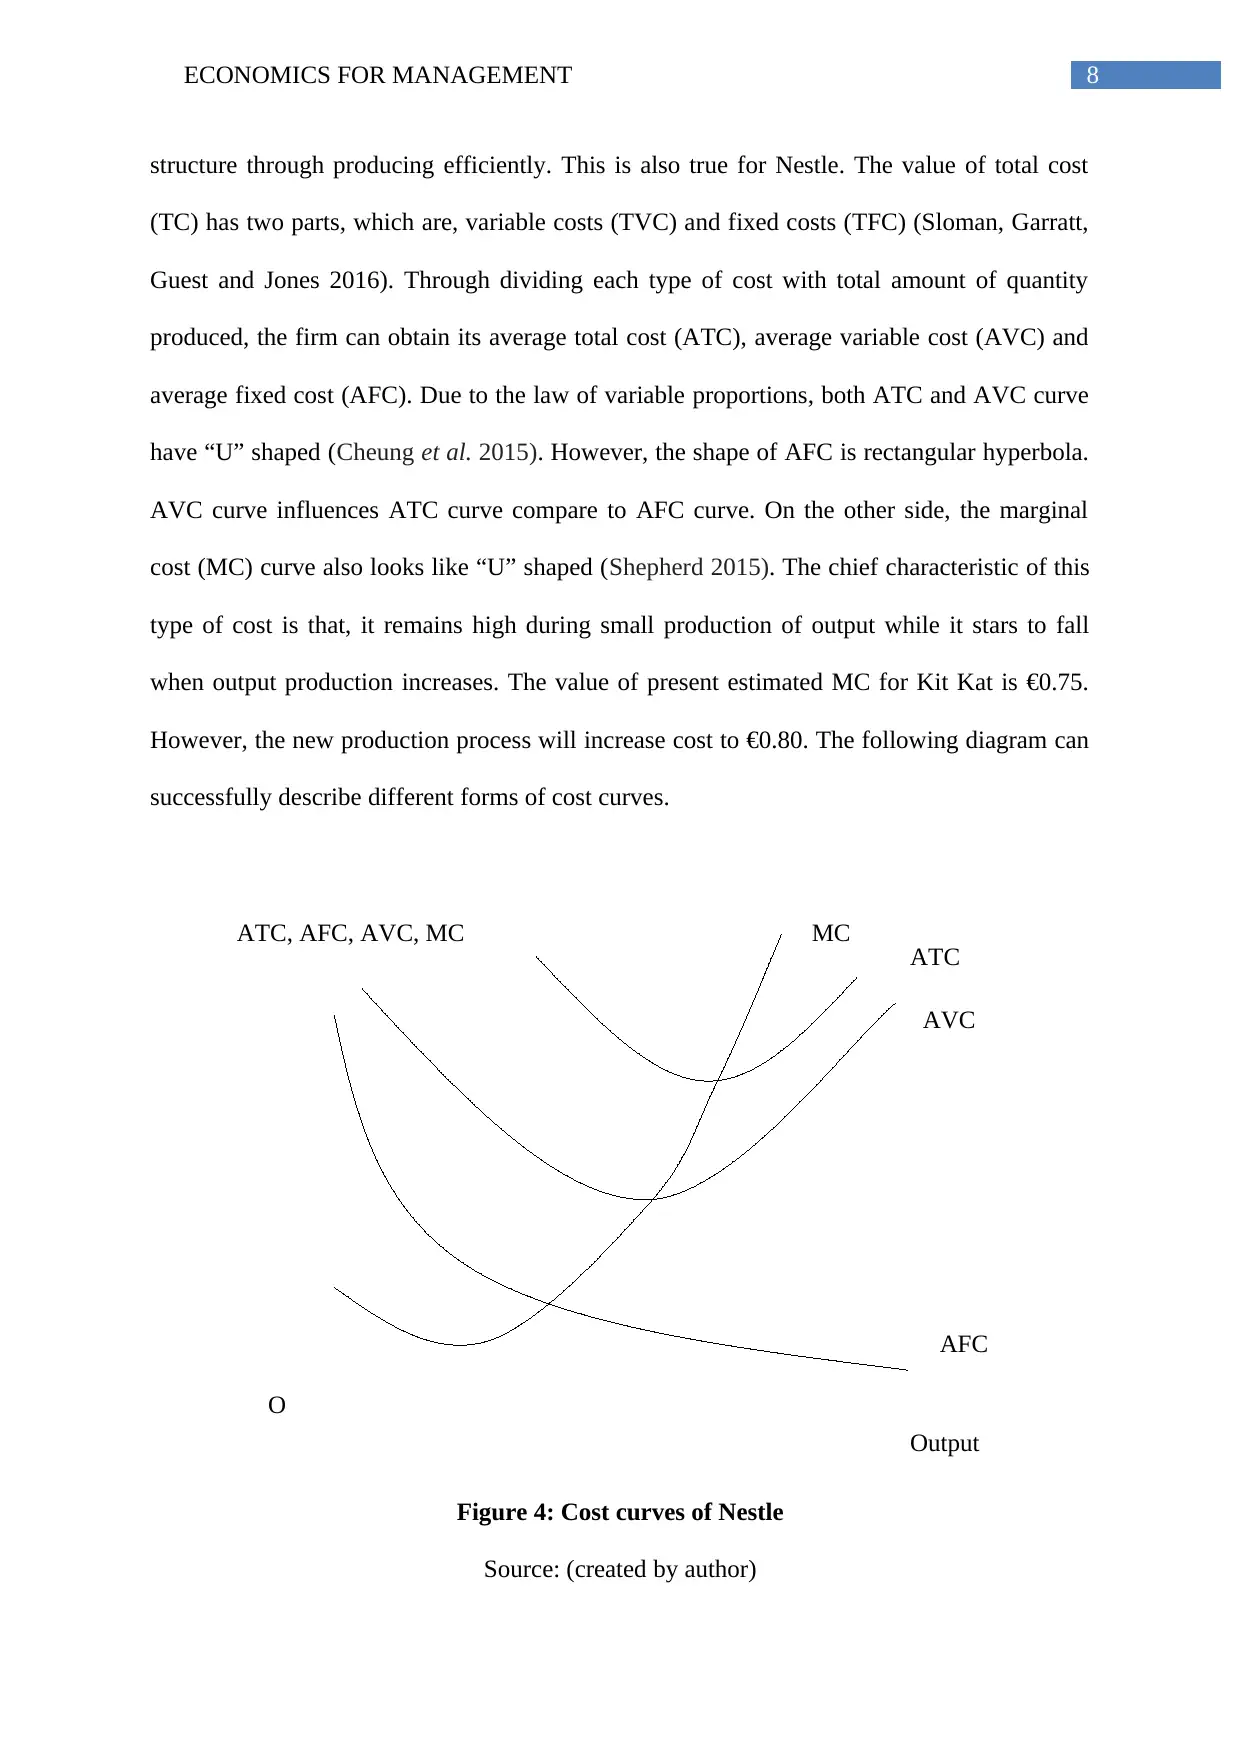
structure through producing efficiently. This is also true for Nestle. The value of total cost
(TC) has two parts, which are, variable costs (TVC) and fixed costs (TFC) (Sloman, Garratt,
Guest and Jones 2016). Through dividing each type of cost with total amount of quantity
produced, the firm can obtain its average total cost (ATC), average variable cost (AVC) and
average fixed cost (AFC). Due to the law of variable proportions, both ATC and AVC curve
have “U” shaped (Cheung et al. 2015). However, the shape of AFC is rectangular hyperbola.
AVC curve influences ATC curve compare to AFC curve. On the other side, the marginal
cost (MC) curve also looks like “U” shaped (Shepherd 2015). The chief characteristic of this
type of cost is that, it remains high during small production of output while it stars to fall
when output production increases. The value of present estimated MC for Kit Kat is €0.75.
However, the new production process will increase cost to €0.80. The following diagram can
successfully describe different forms of cost curves.
Figure 4: Cost curves of Nestle
Source: (created by author)
AFC
ATC, AFC, AVC, MC
Output
O
MC ATC
AVC
structure through producing efficiently. This is also true for Nestle. The value of total cost
(TC) has two parts, which are, variable costs (TVC) and fixed costs (TFC) (Sloman, Garratt,
Guest and Jones 2016). Through dividing each type of cost with total amount of quantity
produced, the firm can obtain its average total cost (ATC), average variable cost (AVC) and
average fixed cost (AFC). Due to the law of variable proportions, both ATC and AVC curve
have “U” shaped (Cheung et al. 2015). However, the shape of AFC is rectangular hyperbola.
AVC curve influences ATC curve compare to AFC curve. On the other side, the marginal
cost (MC) curve also looks like “U” shaped (Shepherd 2015). The chief characteristic of this
type of cost is that, it remains high during small production of output while it stars to fall
when output production increases. The value of present estimated MC for Kit Kat is €0.75.
However, the new production process will increase cost to €0.80. The following diagram can
successfully describe different forms of cost curves.
Figure 4: Cost curves of Nestle
Source: (created by author)
⊘ This is a preview!⊘
Do you want full access?
Subscribe today to unlock all pages.
Trusted by 1+ million students worldwide
9ECONOMICS FOR MANAGEMENT
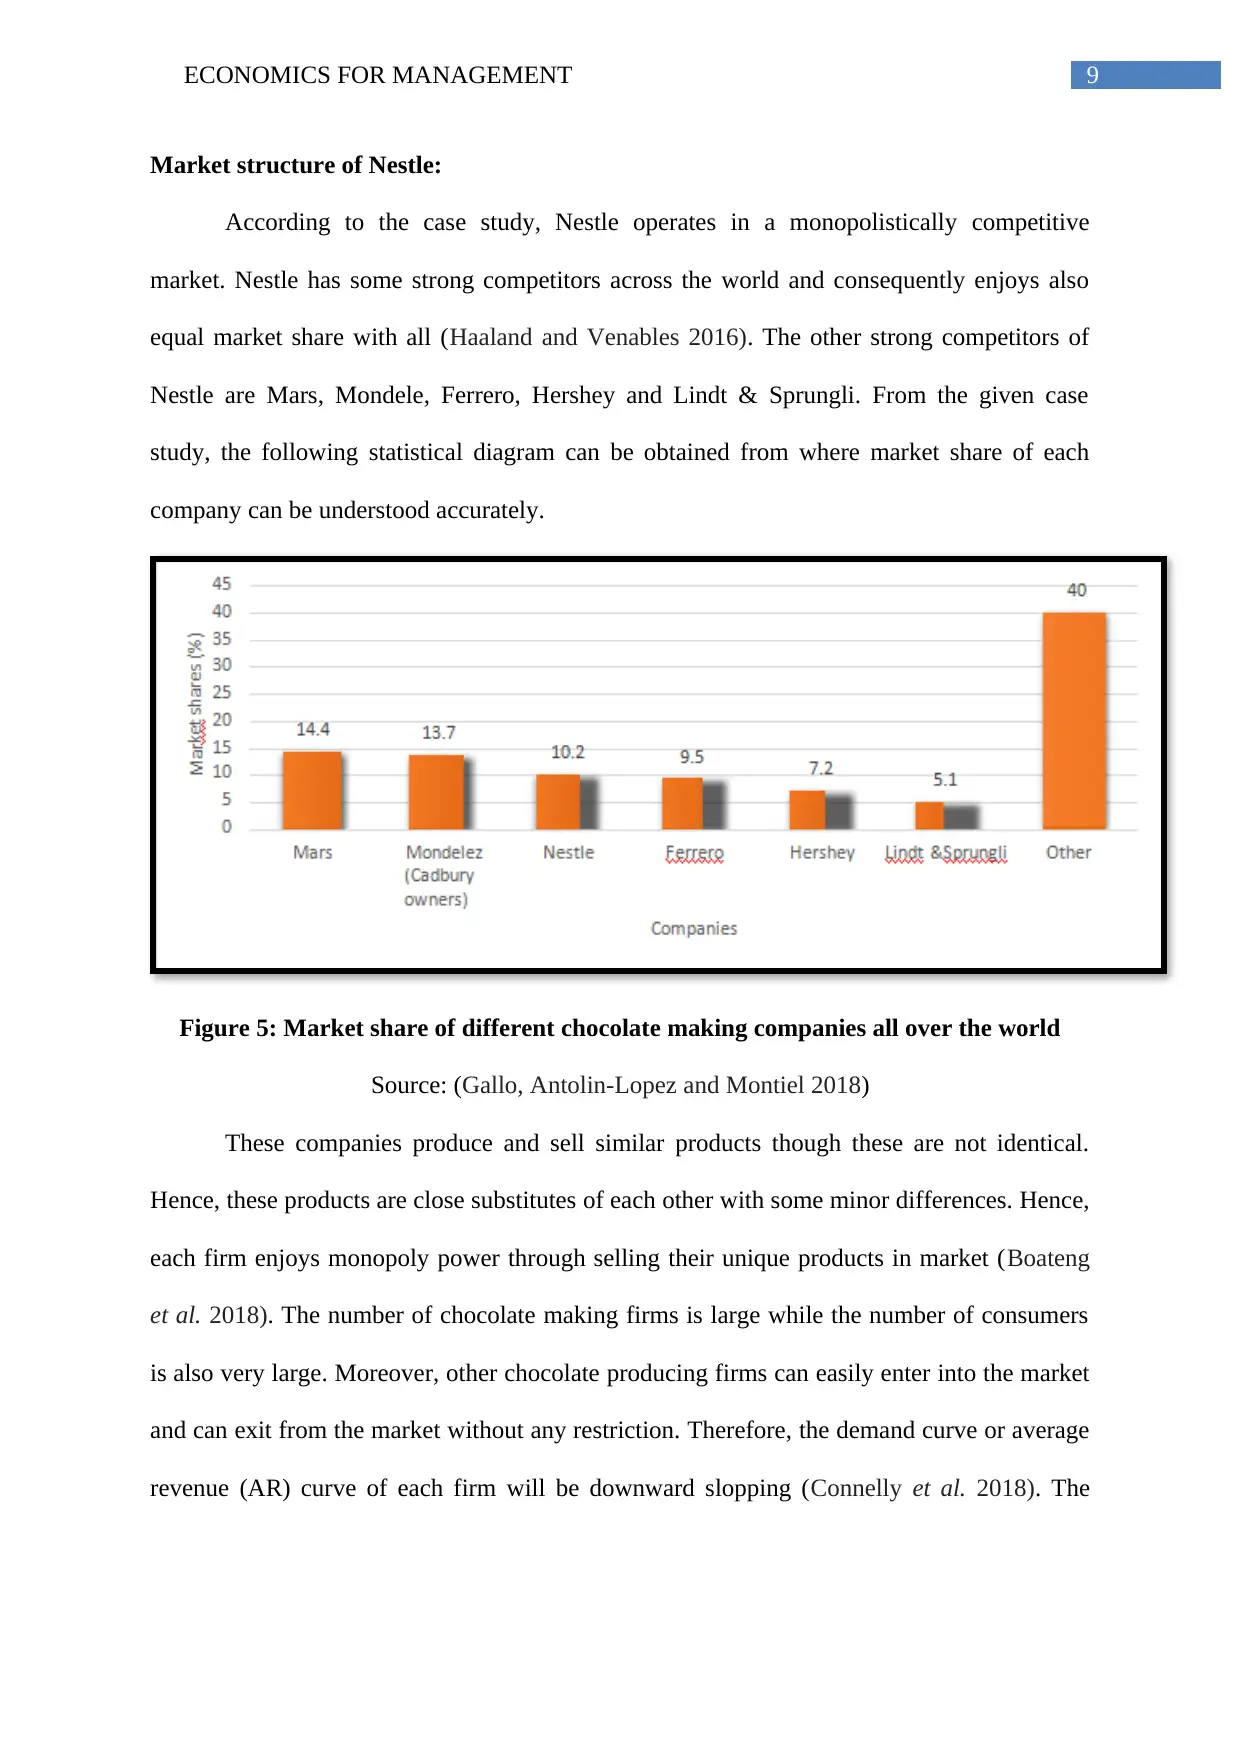
Market structure of Nestle:
According to the case study, Nestle operates in a monopolistically competitive
market. Nestle has some strong competitors across the world and consequently enjoys also
equal market share with all (Haaland and Venables 2016). The other strong competitors of
Nestle are Mars, Mondele, Ferrero, Hershey and Lindt & Sprungli. From the given case
study, the following statistical diagram can be obtained from where market share of each
company can be understood accurately.
Figure 5: Market share of different chocolate making companies all over the world
Source: (Gallo, Antolin-Lopez and Montiel 2018)
These companies produce and sell similar products though these are not identical.
Hence, these products are close substitutes of each other with some minor differences. Hence,
each firm enjoys monopoly power through selling their unique products in market (Boateng
et al. 2018). The number of chocolate making firms is large while the number of consumers
is also very large. Moreover, other chocolate producing firms can easily enter into the market
and can exit from the market without any restriction. Therefore, the demand curve or average
revenue (AR) curve of each firm will be downward slopping (Connelly et al. 2018). The
Paraphrase This Document
Need a fresh take? Get an instant paraphrase of this document with our AI Paraphraser
10ECONOMICS FOR MANAGEMENT
marginal revenue (MR) curve will also have negative slope and will remain below the AR
curve.
Profit maximisation of Nestle:
The difference between total revenue and total cost represents the amount of profit
that a firm can obtain. In a monopolistically competitive market, the firm can earn excess
profit or normal profit during short-run. The firm can also incur loss during this period.
However, in long-run, the firm experiences normal profit only (Nikaido 2015). The market
obtains its equilibrium amount of output and price through equating marginal cost and
marginal revenue. The simple demand equation of Kit Kat is:
P = -0.1250Q+1.59
Therefore, total revenue is:
TR= P*Q= -0.1250Q2 +1.59Q
Thus, marginal revenue is:
MR= -0.25Q + 1.59 the estimated marginal cost of this product is €0.75. Thus, the
following diagram represents the long-run condition of Nestle where it can earn normal profit
only.
11ECONOMICS FOR MANAGEMENT
MR, AR, MC, AC
AC
MC
D = AR
MR
Output
0.34
€0.75
€1.55
O
Figure 6: Normal profit of Nestle
Source: (created by author)
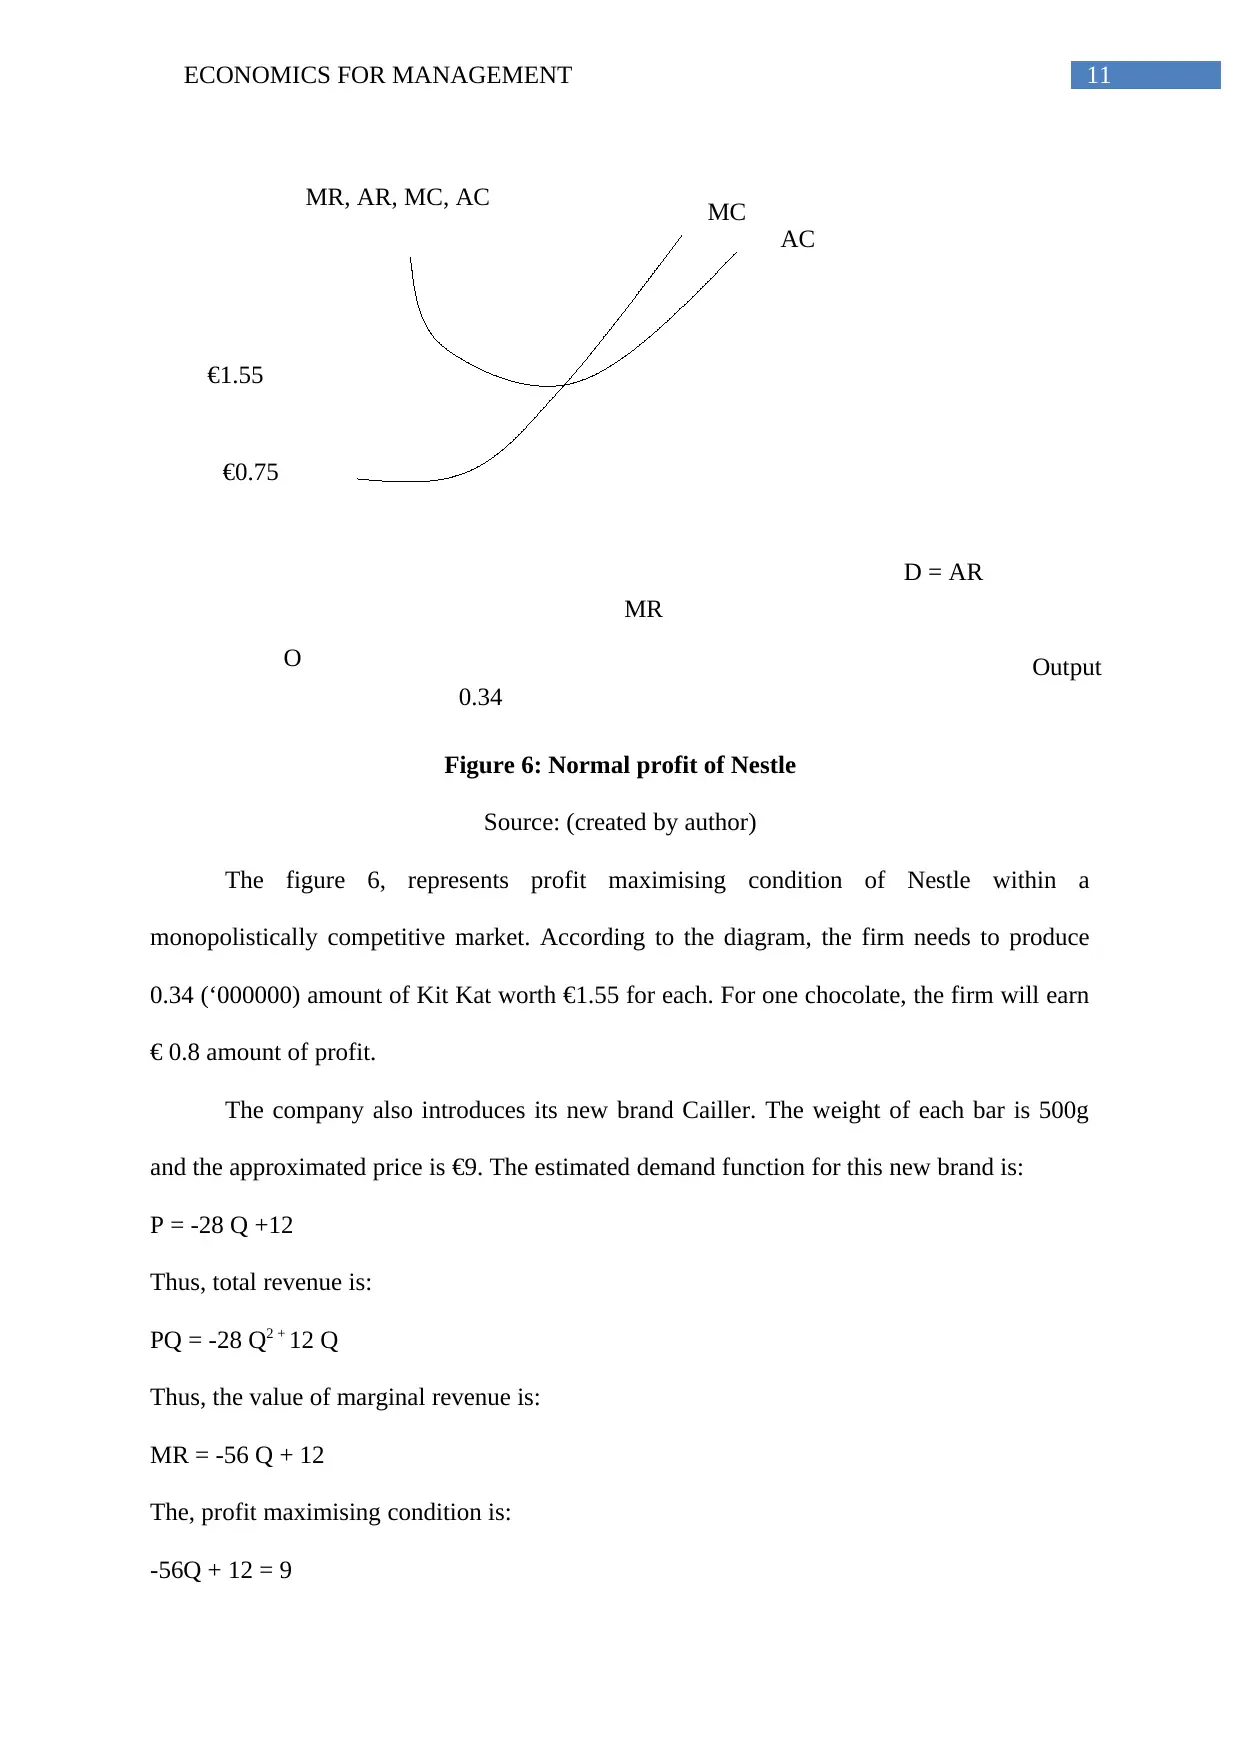
The figure 6, represents profit maximising condition of Nestle within a
monopolistically competitive market. According to the diagram, the firm needs to produce
0.34 (‘000000) amount of Kit Kat worth €1.55 for each. For one chocolate, the firm will earn
€ 0.8 amount of profit.
The company also introduces its new brand Cailler. The weight of each bar is 500g
and the approximated price is €9. The estimated demand function for this new brand is:
P = -28 Q +12
Thus, total revenue is:
PQ = -28 Q2 + 12 Q
Thus, the value of marginal revenue is:
MR = -56 Q + 12
The, profit maximising condition is:
-56Q + 12 = 9
MR, AR, MC, AC
AC
MC
D = AR
MR
Output
0.34
€0.75
€1.55
O
Figure 6: Normal profit of Nestle
Source: (created by author)
The figure 6, represents profit maximising condition of Nestle within a
monopolistically competitive market. According to the diagram, the firm needs to produce
0.34 (‘000000) amount of Kit Kat worth €1.55 for each. For one chocolate, the firm will earn
€ 0.8 amount of profit.
The company also introduces its new brand Cailler. The weight of each bar is 500g
and the approximated price is €9. The estimated demand function for this new brand is:
P = -28 Q +12
Thus, total revenue is:
PQ = -28 Q2 + 12 Q
Thus, the value of marginal revenue is:
MR = -56 Q + 12
The, profit maximising condition is:
-56Q + 12 = 9
⊘ This is a preview!⊘
Do you want full access?
Subscribe today to unlock all pages.
Trusted by 1+ million students worldwide
1 out of 18
Related Documents


Your All-in-One AI-Powered Toolkit for Academic Success.
+13062052269
info@desklib.com
Available 24*7 on WhatsApp / Email
![[object Object]](/_next/static/media/star-bottom.7253800d.svg)
Unlock your academic potential
Copyright © 2020–2026 A2Z Services. All Rights Reserved. Developed and managed by ZUCOL.