Economics for Managers: Applying Economic Principles to Business

Verified

Added on  2023/06/15

|14
|1762
|90
Homework Assignment
AI Summary
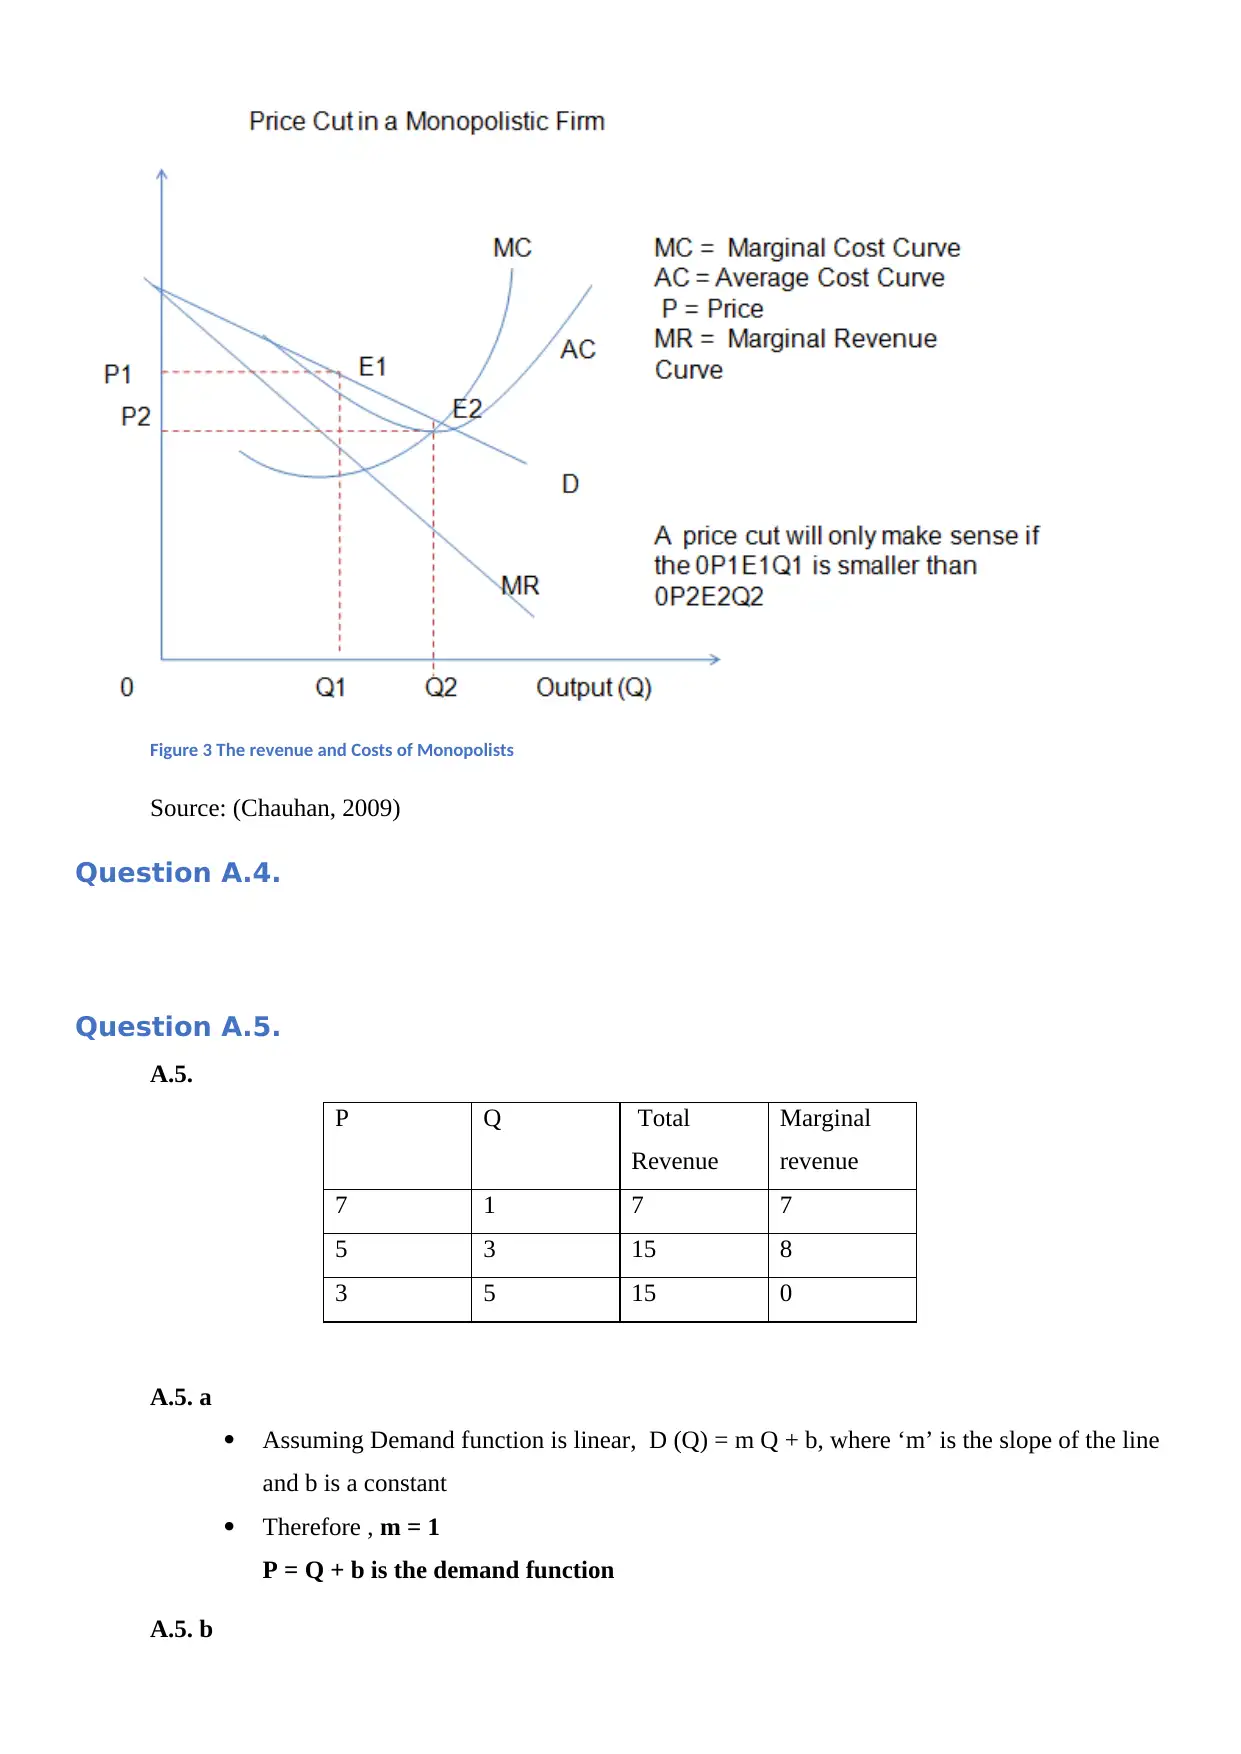
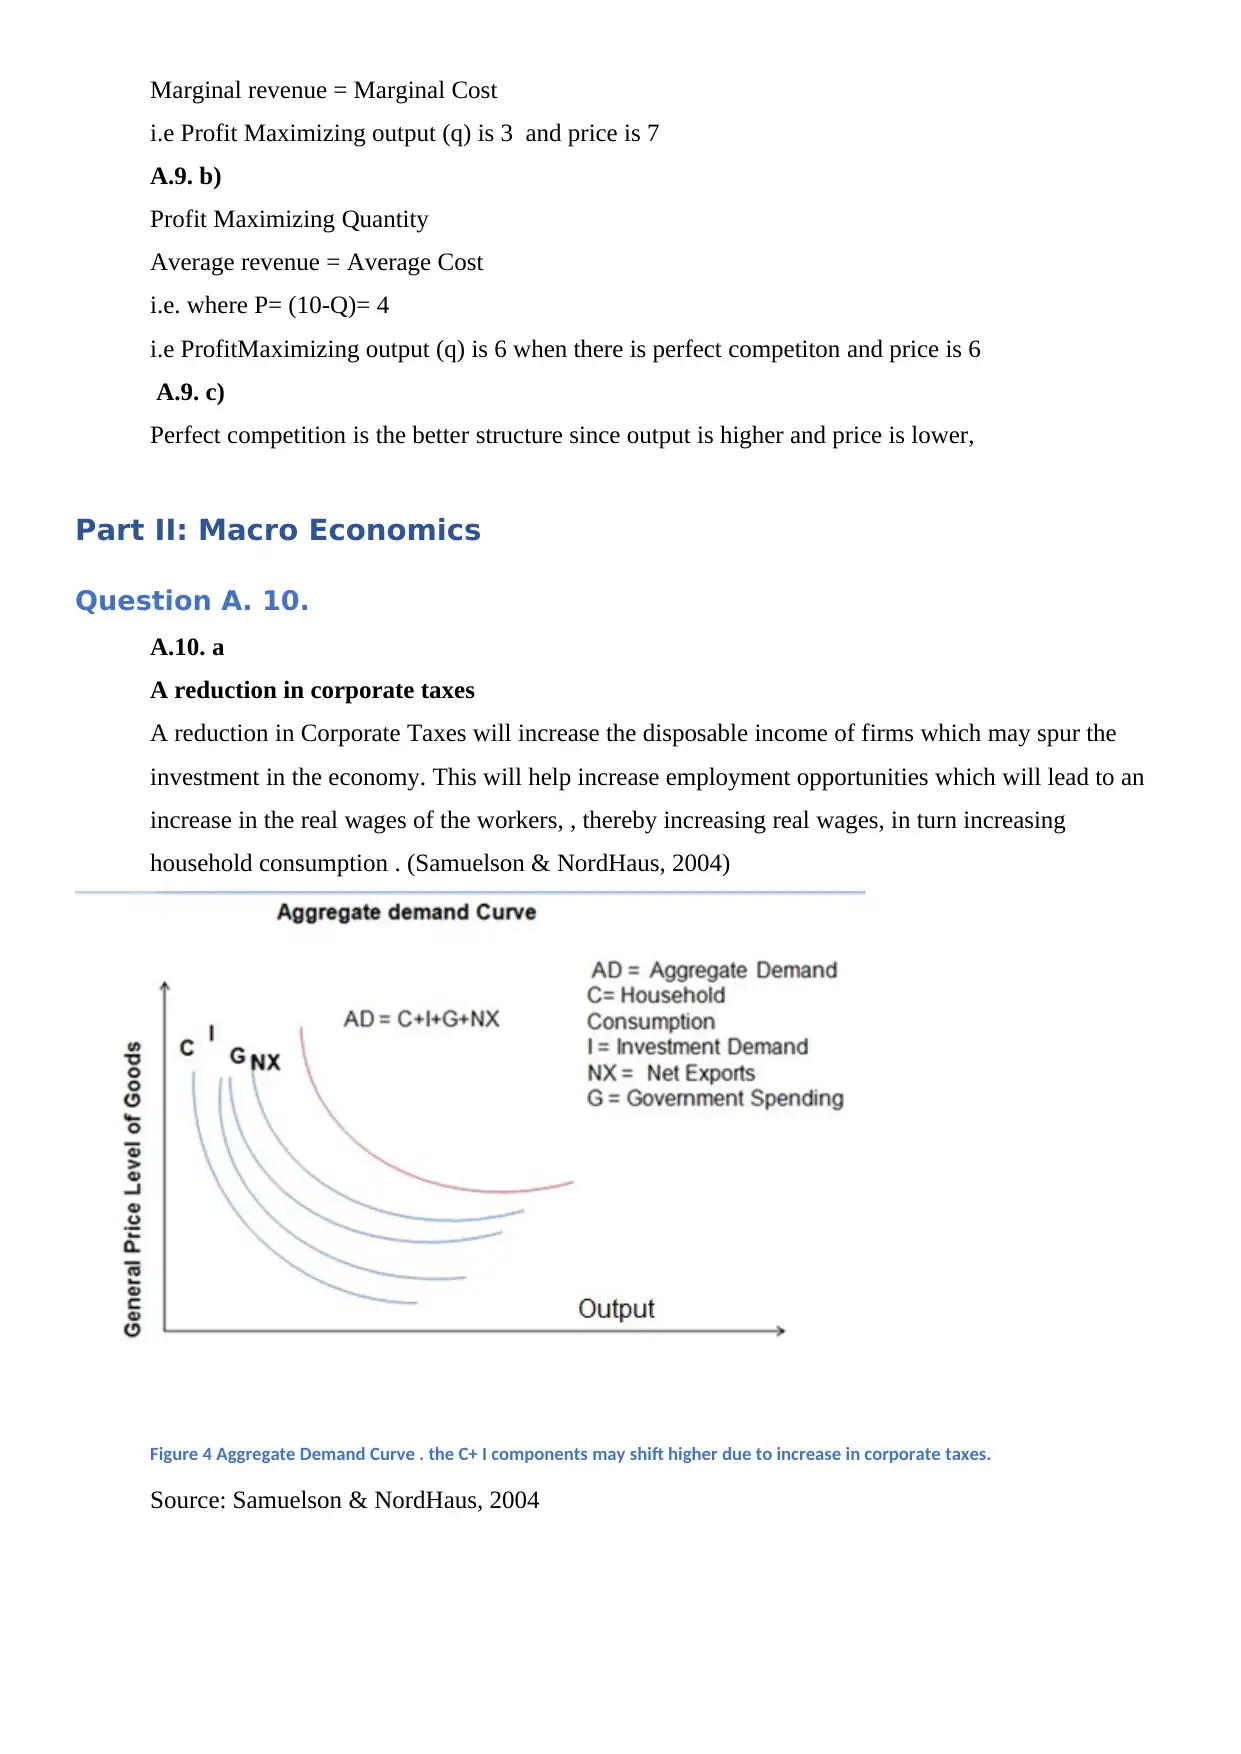
This assignment solution covers both micro and macroeconomic concepts relevant to managers. In microeconomics, it defines demand functions, price elasticity of demand, and analyzes the behavior of monopolists. It also examines the impact of technological improvements on agricultural markets and calculates market equilibrium, consumer surplus, and deadweight loss in various scenarios. The solution further explores profit maximization strategies for firms. In macroeconomics, the assignment discusses the effects of corporate tax reductions, increased tourism, and foreign housing demand on aggregate demand and the overall economy. The solutions are supported by relevant diagrams and references to established economic literature, providing a comprehensive understanding of the topics.
Document Page
qwertyuiopasdfghjklzxcvbnmqw
ertyuiopasdfghjklzxcvbnmqwert
yuiopasdfghjklzxcvbnmqwertyui
opasdfghjklzxcvbnmqwertyuiopa
sdfghjklzxcvbnmqwertyuiopasdf
ghjklzxcvbnmqwertyuiopasdfghj
klzxcvbnmqwertyuiopasdfghjklz
xcvbnmqwertyuiopasdfghjklzxcv
bnmqwertyuiopasdfghjklzxcvbn
mqwertyuiopasdfghjklzxcvbnmq
wertyuiopasdfghjklzxcvbnmqwer
tyuiopasdfghjklzxcvbnmqwertyui
opasdfghjklzxcvbnmqwertyuiopa
sdfghjklzxcvbnmqwertyuiopasdf
ghjklzxcvbnmqwertyuiopasdfghj
klzxcvbnmqwertyuiopasdfghjklz
xcvbnmrtyuiopasdfghjklzxcvbnm
qwertyuiopasdfghjklzxcvbnmqw
Economics for Mangers
[Type the document subtitle]
[Pick the date]
chandra sai
tabler-icon-diamond-filled.svg

Paraphrase This Document

Need a fresh take? Get an instant paraphrase of this document with our AI Paraphraser
Document Page
Document Page
Document Page
Part 1 : Micro Economics
Question A.1.
A.1. a
The demand function is the mathematical relationship between the output (or quanity demanded) at
a given price or price at a given output.
‘Price elasticity’ refers to the “change in demand, given a unit change in the price of a product.”
Price Elasticity of Demand ( Edp) = ( % Change in Quantity Demanded)/ ( % Change in Price) .
(Chauhan, 2009)
Figure 1 Price Elasticity of Demand
Source: (Upadhya, 2017) X Axis= Quantity, Y Axis = Price
A.1. b.
A product that has highly elastic demand will show a proportionally large drop in demand, raising
taxes will result in the increase in the price of the product (Upadhya, 2017). If the quantity demanded
drops greatly, the total revenue may drop lower and the increase in taxes will be counter productive.
On the other hand, subsidies will raise the total revenue for some products.
tabler-icon-diamond-filled.svg

Paraphrase This Document

Need a fresh take? Get an instant paraphrase of this document with our AI Paraphraser
Document Page
Source:. (Samuelson & NordHaus, 2004)
Question A.2.
A.2. a.
Demand function is the schedule that indicates the various amount of products that consumers would
be willing to and are able to buy at any specific price, from a set of prices possible, given a specified
timeframe.
Price elasticity of demand for agricultural products such as rice is generally low. (Chauhan, 2009)
This is because of the fact that products like rice tend to be staple commodities with few substitutes
and tend to form a small fraction of consumer spending at least among high and middle income
households (Cheplyanskij, 2008)
A.2. b.
Technological improvements in producing rice may help increase the yield of rice , thereby
increasing the total individual and market supply of rice. Hence, the supply will exceed the demand
and the price of rice paid to the farmer will reduce. (Blue., 2015)
Document Page
Figure 2 Effects of increased supply of rice
Source: (Blue, 2015)
Question A.3.
Monopolists , too, have a downward sloping demand as if the prices are increased to an unsustainable level, some
consumers may be priced out of the market. Hence, monopolists only seek to increase production in cases where a
single unit drop in price, increases the demand to a great extent i.e when the elasticity of demand is greater than 1.
The total revenue (Quantity X Price) is maximized in such cases. Monopolists also have diminishing marginal returns
to scale, and a U-shaped long run cost curve. Demand for a consumer after a certain output becomes relatively
inelastic due to diminishing marginal utility of a product. If the demand does not increase to a great extent while
marginal costs keep increasing, profitability is affected. Hence, monopolists only produce when elasticity of product
is high. (Chauhan, 2009)
Document Page
Figure 3 The revenue and Costs of Monopolists
Source: (Chauhan, 2009)
Question A.4.
Question A.5.
A.5.
P Q Total
Revenue
Marginal
revenue
7 1 7 7
5 3 15 8
3 5 15 0
A.5. a
Assuming Demand function is linear, D (Q) = m Q + b, where ‘m’ is the slope of the line
and b is a constant
Therefore , m = 1
P = Q + b is the demand function
A.5. b
tabler-icon-diamond-filled.svg

Paraphrase This Document

Need a fresh take? Get an instant paraphrase of this document with our AI Paraphraser
Document Page
Equilibrium Quantity is 1/3.
Equilibrium Price is 3
There is no producer surplus, since the producer is producing at looses.
Consumer Surplus is 2 Q.
A.5. c.
The new demand curve is P+2 = 3Q
Therefore, P=3Q -2
New Equilibrium price is
3Q – 2 = Q
Therefore ,
Q= 1. The New Equilibrium Quantity is 3. The New price is 7.
A.5. d.
.The tax revenue in after increase in taxes is 2 X 3 = 6
Deadweight loss is Difference between price X Difference in Output.
Hence the deadweight loss is -16 /9.
Question A.6.
A.6. a.
If price is equal to quantity, then change in price is equal to change in quanity. Therefore, the elasticity of
demand is 1, at equilibrium.
A.6. b.
Equilibrium Quantity is 3, therefore, Equilibrium Price is 3.
The profit maximizing price is the same as the price charges, the consumer surplus is willing
to pay, consumer surplus is zero.
Producer surplus , in this case is zero.
A.6. c.
Since the tax is imposed on producers, the Total price to producers becomes P+1. The new
supply curve is P+ 1 = Q . Therefore, the price for the supplier is P= Q-1
The equilibrium price, therefore, is
6-Q= Q-1
Q= 3.5
The Equilibrium Quantity is 3.5 and the Price (6-Q) is 2,5
A.6. c.
Tax Revenue = 3.5 X1 = 3.5
Deadweight loss is 1
Document Page
Question A. 7.
A.7. a)
Profit maximizing output is output 8
A.7. b)
The Total economic profit at profit maximizing output is 20
A.7. c)
Long run equilibrium output is 4 and the long run price is $10
Question A. 8.
A.8. a)
a. Profit is maximized when MR= MR
Therefore, profit maximizing output in 4.
Substituting this in Equation P= 10- Q
P= 6
Profit maximizing output in 6.
A.8. b)
At Profit Maximizing Output and Price:
Total Revenue = 6 X4
= 24
Total Costs = (Fixed Costs + Variable Costs) X Output
Variable Cost is taken an marginal costs
Total Costs = 4.X 4
Total Costs= 16
Therefore,
Economic Profit= 8
A.8. c)
At profit Maximimzing point , the change in price is 0 . The change in Marginal Cost is also zero.
Hence, the price elasticity of demand is 0.
Question A. 9.
A.9. a)
Profit maximizing quantity is where
Document Page
Marginal revenue = Marginal Cost
i.e Profit Maximizing output (q) is 3 and price is 7
A.9. b)
Profit Maximizing Quantity
Average revenue = Average Cost
i.e. where P= (10-Q)= 4
i.e ProfitMaximizing output (q) is 6 when there is perfect competiton and price is 6
A.9. c)
Perfect competition is the better structure since output is higher and price is lower,
Part II: Macro Economics
Question A. 10.
A.10. a
A reduction in corporate taxes
A reduction in Corporate Taxes will increase the disposable income of firms which may spur the
investment in the economy. This will help increase employment opportunities which will lead to an
increase in the real wages of the workers, , thereby increasing real wages, in turn increasing
household consumption . (Samuelson & NordHaus, 2004)
Figure 4 Aggregate Demand Curve . the C+ I components may shift higher due to increase in corporate taxes.
Source: Samuelson & NordHaus, 2004
tabler-icon-diamond-filled.svg

Paraphrase This Document

Need a fresh take? Get an instant paraphrase of this document with our AI Paraphraser
Document Page
Figure 5 Effect of Increased Corporate Taxes
Source:. (Upadhya, 2017)
Question A. 11.
A.11. a.
Short Run: Increase in Tourism will result in a increase in the consumer spending in the
economy, thereby increasing the consumer demand, that may increase inflation or the general
price level. (Upadhya, 2017) (Samuelson & NordHaus, 2004)
Document Page
Figure 6Short Run Supply Curve and Long Run Suuply Curve (Full Employment)
Source: (Samuelson & NordHaus, 2004)
Figure 7 Long Run Effects of Increase in Tourism
Source: (Samuelson & NordHaus, 2004)
Long Run: The potential supply increases and the inflation can be curbed and the overall general
price level, in comparison to wages may lower. However, if increase in tourism is sustained, then the
increase in wages is sustained (if the economy does not employ additional labour force due to an
increase in population or due to immigration). (Samuelson & NordHaus, 2004)
chevron_up_icon
1 out of 14
circle_padding
hide_on_mobile
zoom_out_icon
[object Object]