MPE781 - Economics for Managers: Market Structure and Pricing Analysis
VerifiedAdded on 2023/06/12
|16
|3251
|393
Homework Assignment
AI Summary
This assignment delves into various aspects of economics for managers, focusing on market structures and pricing strategies. It begins by analyzing the supply curve under perfect competition and the impact of supply restrictions on a seller's profit. It then examines the characteristics of a perfectly competitive market and contrasts it with real-world scenarios, particularly in the restaurant industry. The assignment further explores revenue maximization strategies under a monopoly market structure, highlighting the role of 'value of exclusivity' and its effect on demand. Finally, it discusses price discrimination, its anti-competitive and pro-competitive aspects, and its implications for a monopolist's profit. The document is contributed by a student and available on Desklib, a platform offering a wide array of study resources and AI-powered tools for students.
Running head: ECONOMICS FOR MANAGERS
Economics for Manager
Name of the Student:
Name of the University:
Author’s Note:
Economics for Manager
Name of the Student:
Name of the University:
Author’s Note:
Paraphrase This Document
Need a fresh take? Get an instant paraphrase of this document with our AI Paraphraser
ECONOMICS FOR MANAGERS 1
Table of Contents
Answer to Question 2:.....................................................................................................................2
Part a:...........................................................................................................................................2
Part b:...........................................................................................................................................4
Answer to Question 3......................................................................................................................5
Answer to Question 4......................................................................................................................8
Part a:...........................................................................................................................................8
Part b..........................................................................................................................................10
Answer to Question 5....................................................................................................................11
MC
J AVC
P0
ATC
Q0O Output
Price
SC
AR=MR
ECONOMICS FOR MANAGERS 2
Answer to Question 2:
Part a:
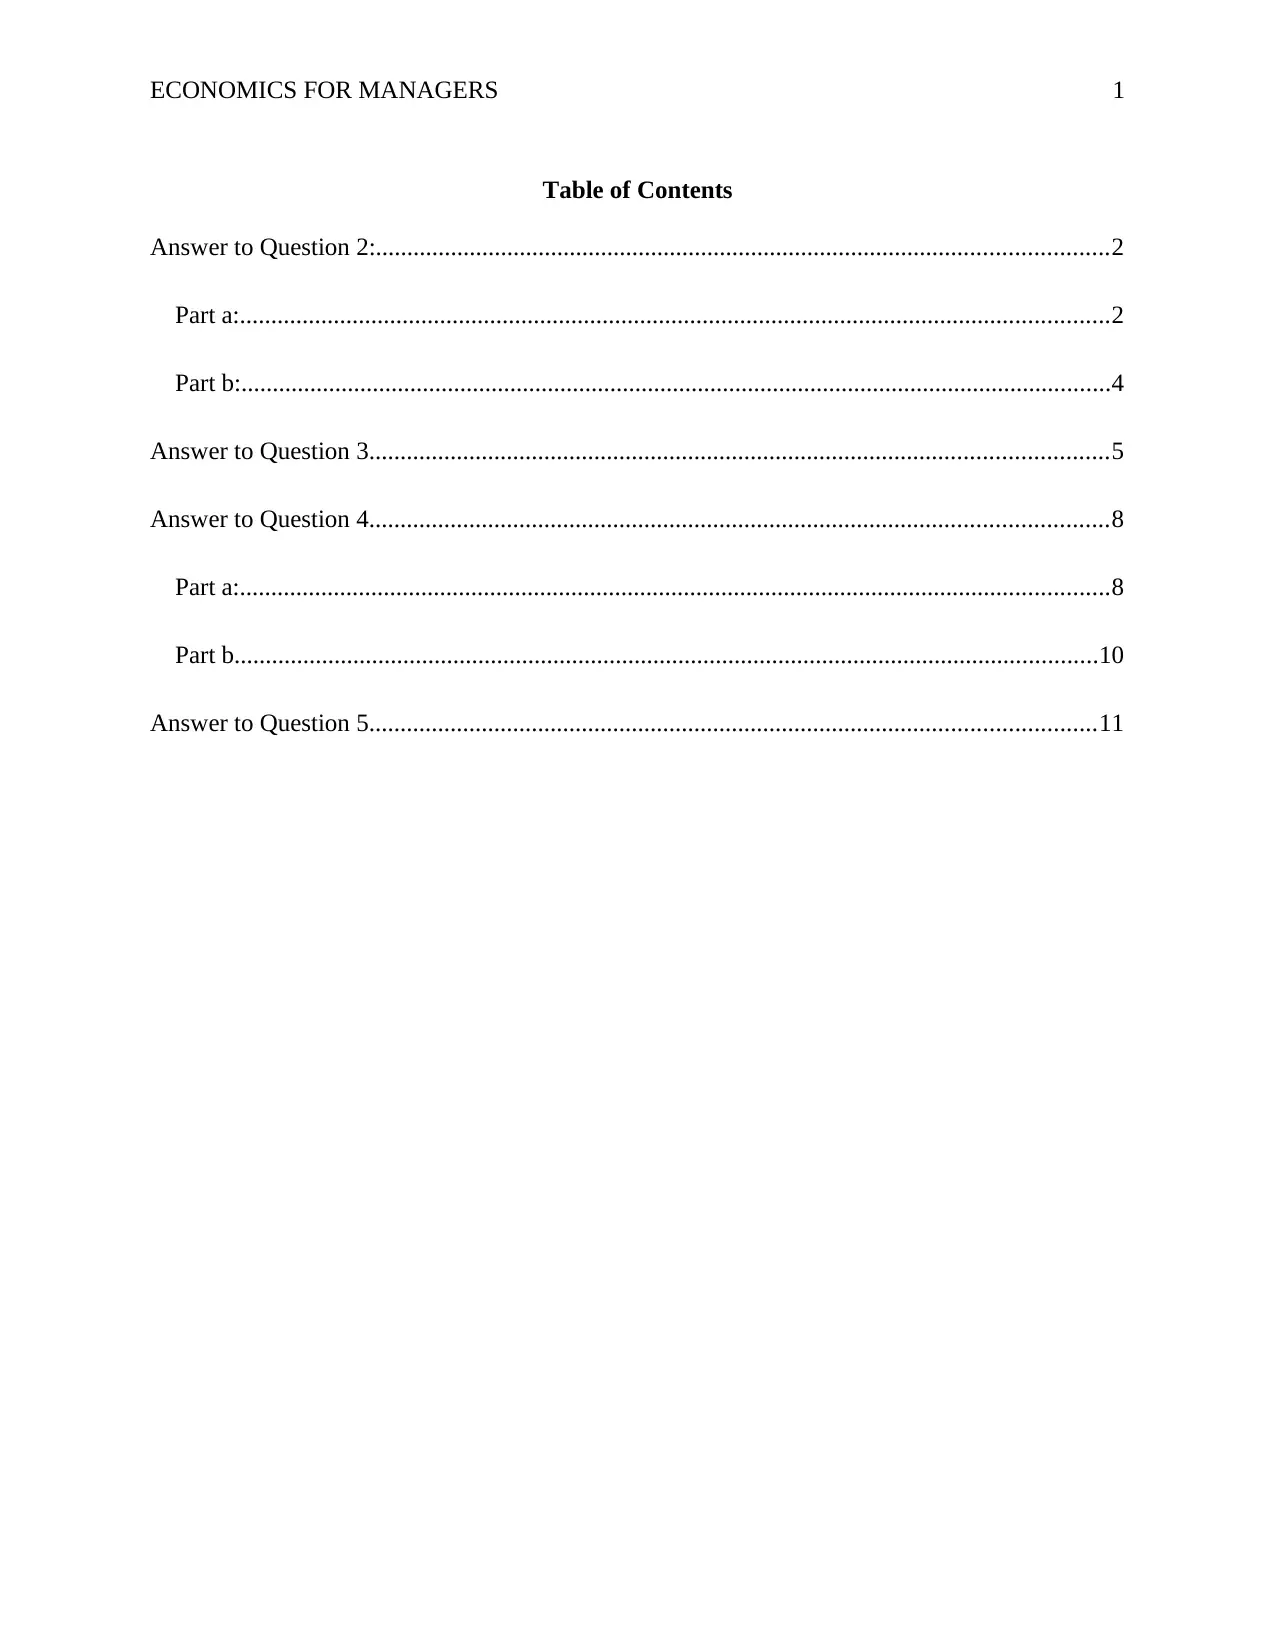
A seller is faced with an upward sloping supply curve under the perfectly competitive
market structure, this upwards sloping supply curve is represented by the rising portion of the
marginal cost curve (Kirzner 2015, P.6). This positively sloped supply curve depicts the fact that
if there is a rise in the price level the seller will supply more of the goods.
Figure1: Supply Curve in a Perfectly Competitive Market (Short Run)
(Source: Created by Author)
As it has been outlined in the figure above the upward sloping supply curve is depicted
by the SJ portion of the MC curve. It can be observed that the firm cannot continue its
production if the price level drops below the point S. This is because below this point the firm
will not be able to bear its fixed cost and will need to shut down its production (Karier 2016,
J AVC
P0
ATC
Q0O Output
Price
SC
AR=MR
ECONOMICS FOR MANAGERS 2
Answer to Question 2:
Part a:
A seller is faced with an upward sloping supply curve under the perfectly competitive
market structure, this upwards sloping supply curve is represented by the rising portion of the
marginal cost curve (Kirzner 2015, P.6). This positively sloped supply curve depicts the fact that
if there is a rise in the price level the seller will supply more of the goods.
Figure1: Supply Curve in a Perfectly Competitive Market (Short Run)
(Source: Created by Author)
As it has been outlined in the figure above the upward sloping supply curve is depicted
by the SJ portion of the MC curve. It can be observed that the firm cannot continue its
production if the price level drops below the point S. This is because below this point the firm
will not be able to bear its fixed cost and will need to shut down its production (Karier 2016,
⊘ This is a preview!⊘
Do you want full access?
Subscribe today to unlock all pages.
Trusted by 1+ million students worldwide
MC
P0
ATC
Q0O Output
Price
S
C
AR=MR
C1
ATC1
Q1
J
K
L
ECONOMICS FOR MANAGERS 3
P.55). Therefore from the diagram it has become quite evident that the seller possesses an
upward rising supply curve under the perfectly competitive market structure. Here in this specific
case the seller is supplying Q0 amount of quantity at a price P0. The seller is earning
supernormal profit which is P0C.
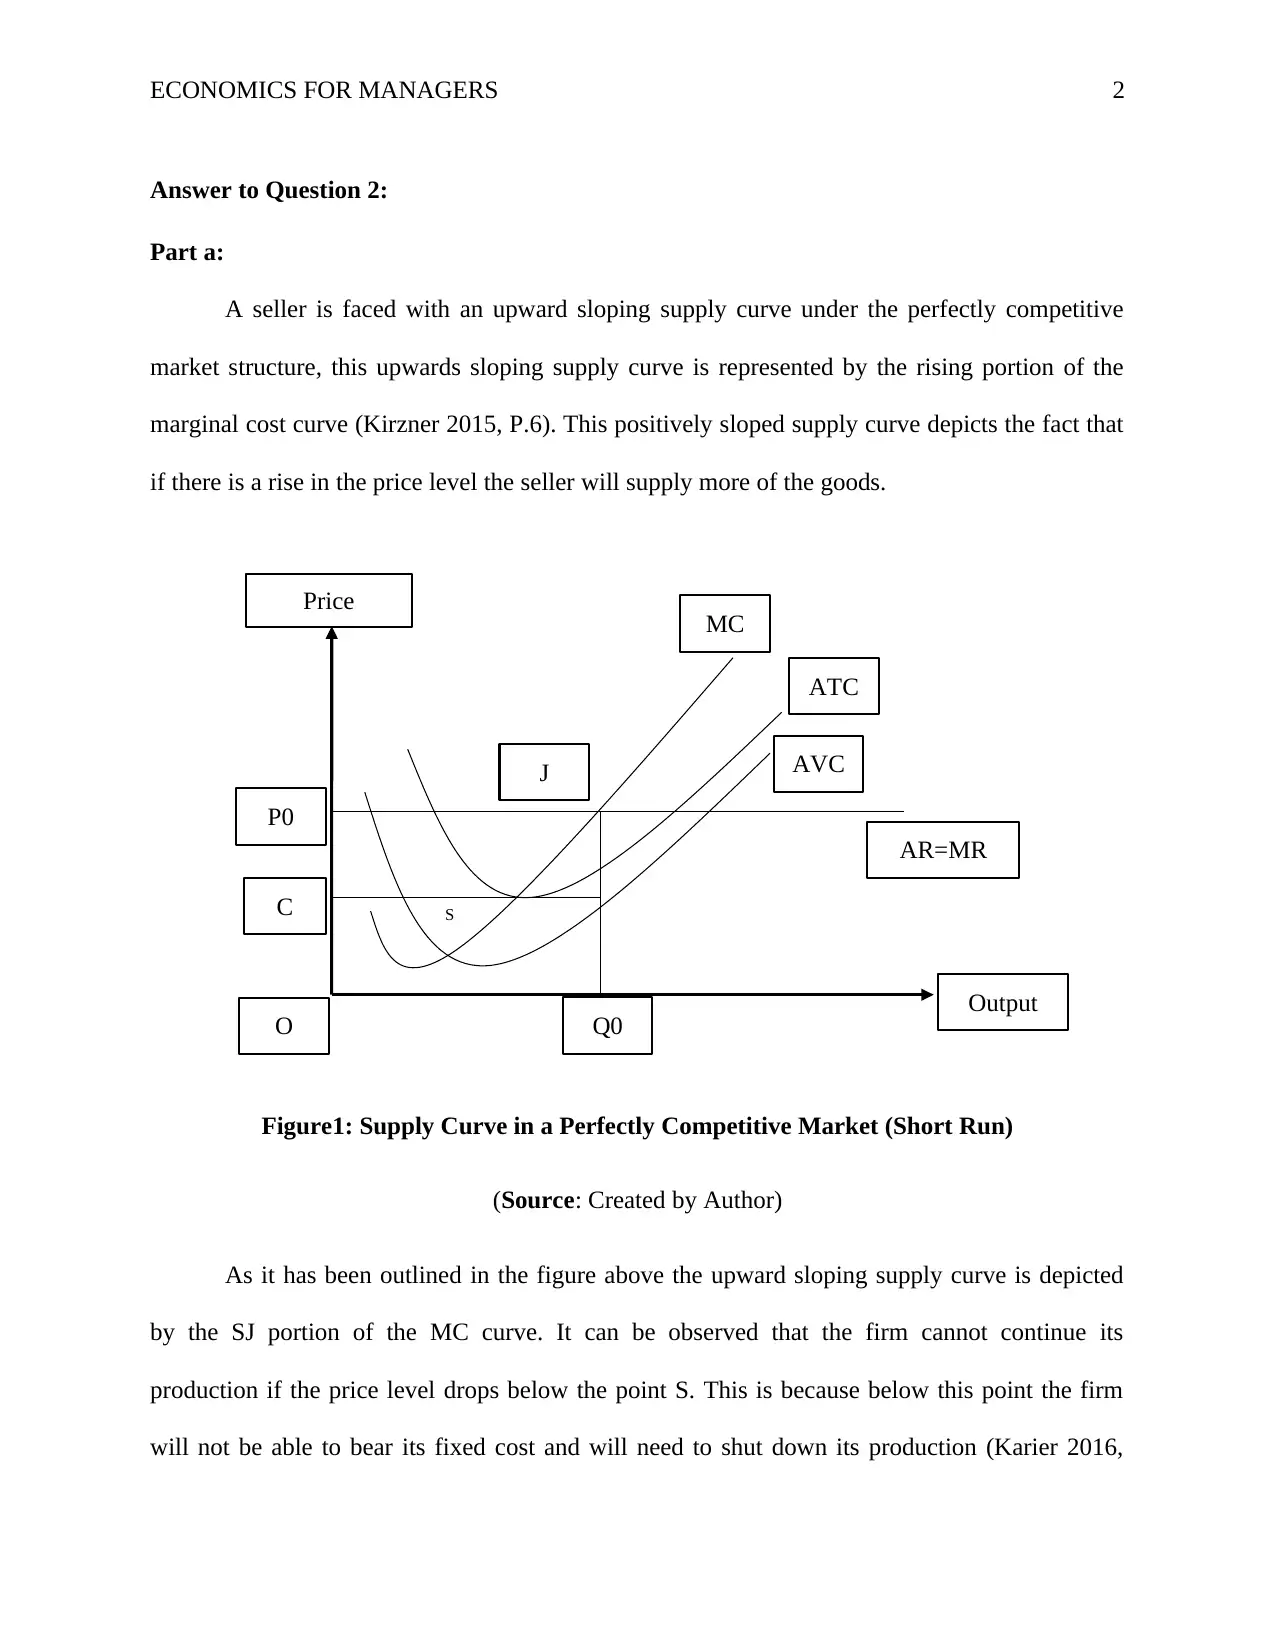
Now the seller if wish to restrict the supply of the products at the given price in the short
run, the seller can supply lesser amount of goods at the existing price level (Baumol & Blinder
2015, P.189). Now as the supply of the products has been restricted the cost of production will
also be low as the variable cost will be lower and hence the average total cost curve of the firm
will shift downwards. This can be represented with the help of the following diagram.
Figure 2: Perfectly Competitive Market with Supply Restriction
(Source: Created by Author)
P0
ATC
Q0O Output
Price
S
C
AR=MR
C1
ATC1
Q1
J
K
L
ECONOMICS FOR MANAGERS 3
P.55). Therefore from the diagram it has become quite evident that the seller possesses an
upward rising supply curve under the perfectly competitive market structure. Here in this specific
case the seller is supplying Q0 amount of quantity at a price P0. The seller is earning
supernormal profit which is P0C.
Now the seller if wish to restrict the supply of the products at the given price in the short
run, the seller can supply lesser amount of goods at the existing price level (Baumol & Blinder
2015, P.189). Now as the supply of the products has been restricted the cost of production will
also be low as the variable cost will be lower and hence the average total cost curve of the firm
will shift downwards. This can be represented with the help of the following diagram.
Figure 2: Perfectly Competitive Market with Supply Restriction
(Source: Created by Author)
Paraphrase This Document
Need a fresh take? Get an instant paraphrase of this document with our AI Paraphraser
ECONOMICS FOR MANAGERS 4
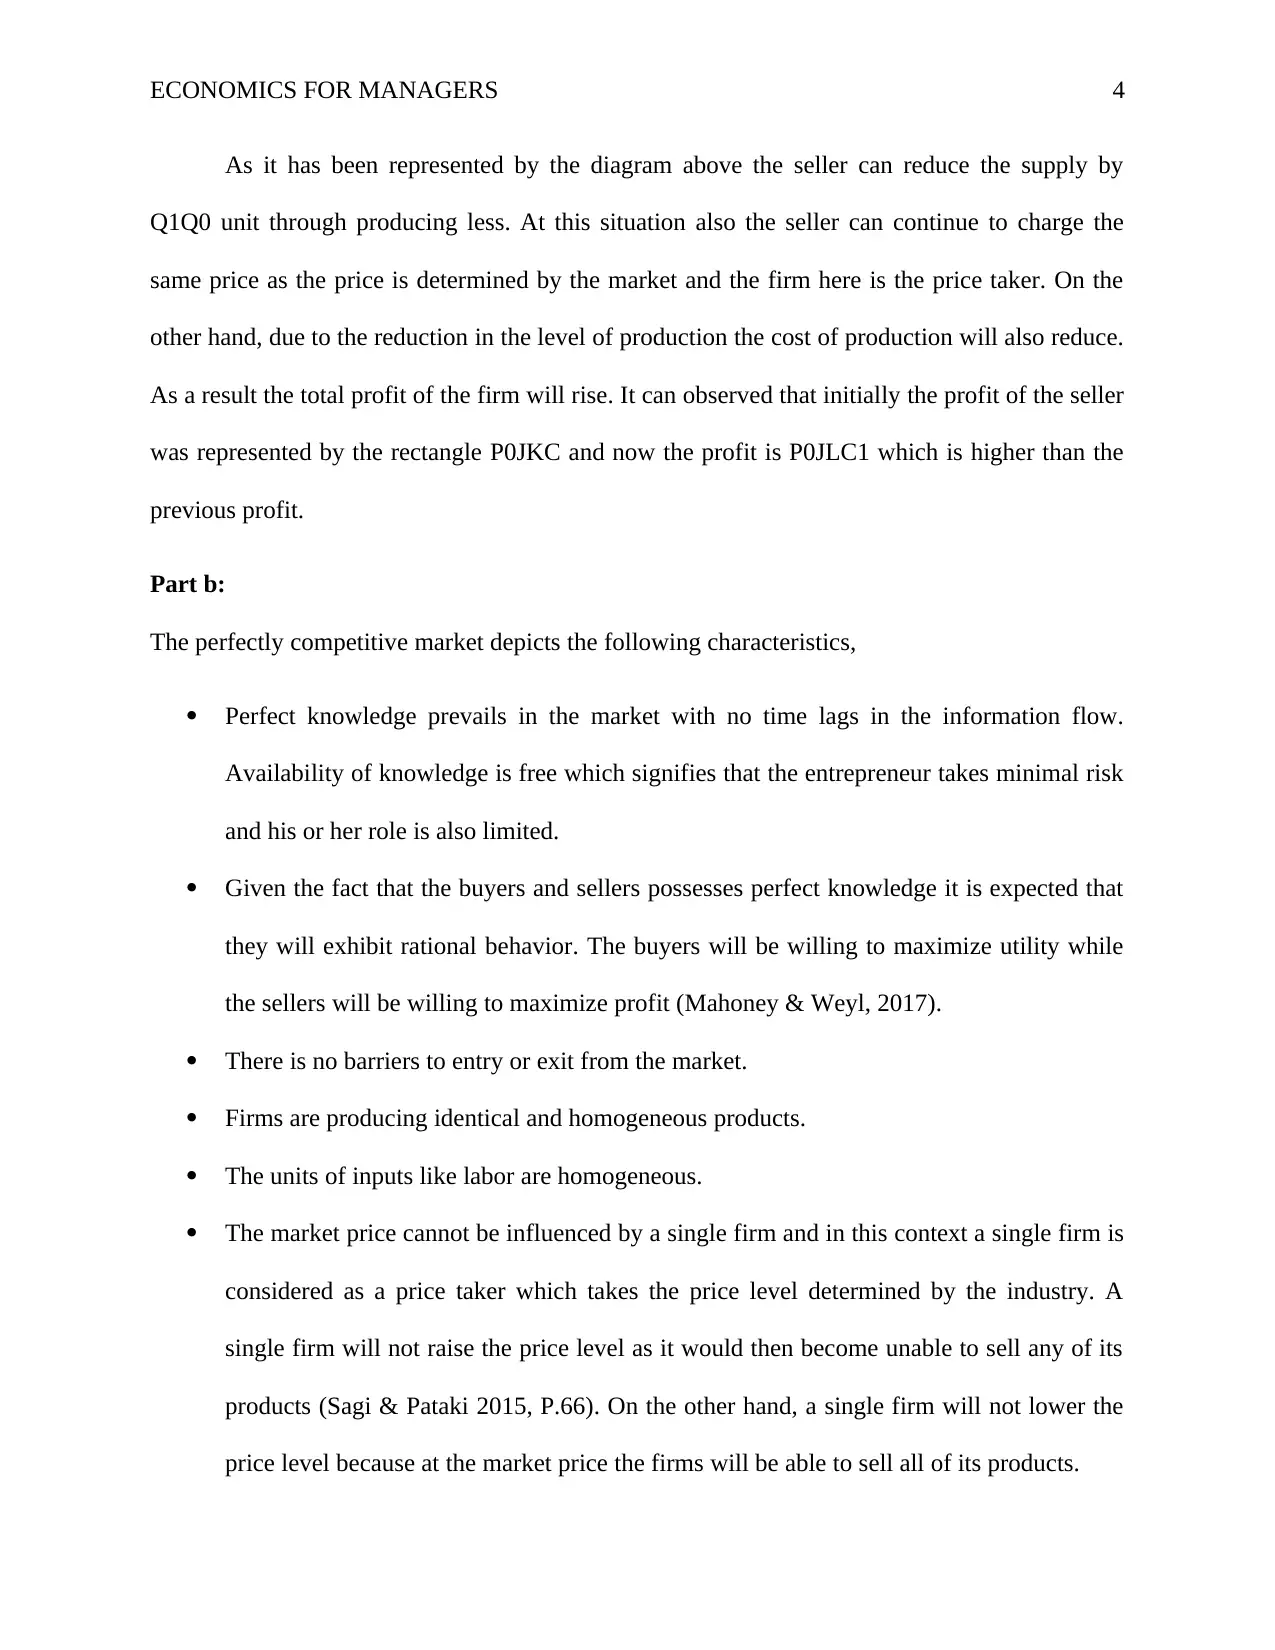
As it has been represented by the diagram above the seller can reduce the supply by
Q1Q0 unit through producing less. At this situation also the seller can continue to charge the
same price as the price is determined by the market and the firm here is the price taker. On the
other hand, due to the reduction in the level of production the cost of production will also reduce.
As a result the total profit of the firm will rise. It can observed that initially the profit of the seller
was represented by the rectangle P0JKC and now the profit is P0JLC1 which is higher than the
previous profit.
Part b:
The perfectly competitive market depicts the following characteristics,
Perfect knowledge prevails in the market with no time lags in the information flow.
Availability of knowledge is free which signifies that the entrepreneur takes minimal risk
and his or her role is also limited.
Given the fact that the buyers and sellers possesses perfect knowledge it is expected that
they will exhibit rational behavior. The buyers will be willing to maximize utility while
the sellers will be willing to maximize profit (Mahoney & Weyl, 2017).
There is no barriers to entry or exit from the market.
Firms are producing identical and homogeneous products.
The units of inputs like labor are homogeneous.
The market price cannot be influenced by a single firm and in this context a single firm is
considered as a price taker which takes the price level determined by the industry. A
single firm will not raise the price level as it would then become unable to sell any of its
products (Sagi & Pataki 2015, P.66). On the other hand, a single firm will not lower the
price level because at the market price the firms will be able to sell all of its products.
ECONOMICS FOR MANAGERS 5
The economy is a Laissez faire economy that is there no intervention on the part of the
government.
The firms can make supernormal profits in the short run but earn only normal profit in the
long run.
Given the features of the perfectly competitive market it can easily be stated that the
firms in the given extract are not operating in a perfectly competitive market. This is because the
firms in the extract have charged different prices which is not possible in a perfectly competitive
market as in such a market structure price is determined by the industry. They have also faced
different demand for their products as well.
No the restaurants generally do not operate in a perfectly competitive market. This is
because the restaurants do not sell identical products or services. Rather, the restaurants operates
in a monopolistic market. Under the monopolistic market there are a few firms selling slightly
differentiated products to a large number of buyers.
Answer to Question 3
Under monopoly market structure a seller can maximize revenue through charging a
higher price to the consumers or increase the quantity of sales by lowering the price level. A
monopoly market is characterized as a market where there is a single firm selling a unique
product to a large number buyers (Varian 2014, P.95). As per the monopoly market structure a
single firm produces a unique product which in turn enables it to charge higher prices. Moreover,
the monopolist faces a downward sloping demand curve which signifies a negative relationship
between the price of the product and quantity demanded.
⊘ This is a preview!⊘
Do you want full access?
Subscribe today to unlock all pages.
Trusted by 1+ million students worldwide
Price and cost
Output
O Qe
Pe
P1
D=AR=P
MR
MC
AC
Q1
ECONOMICS FOR MANAGERS 6
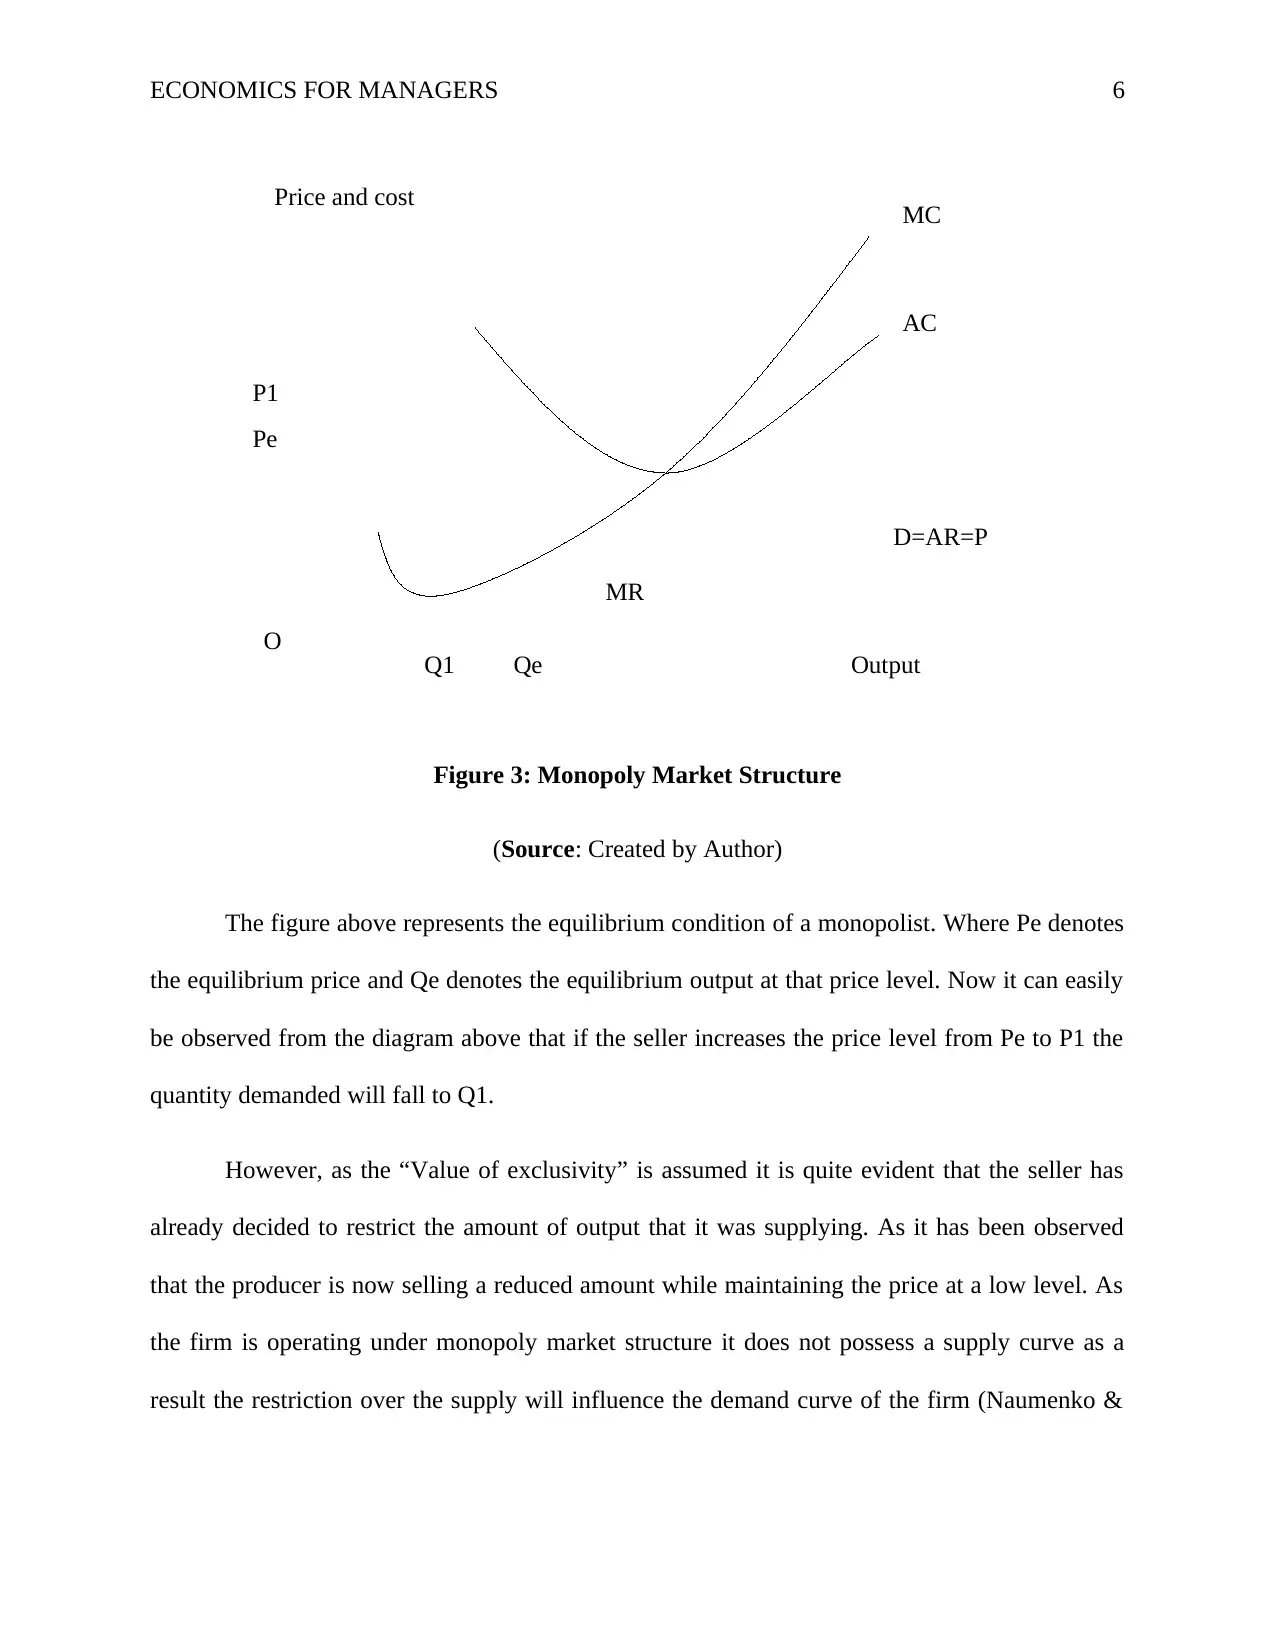
Figure 3: Monopoly Market Structure
(Source: Created by Author)
The figure above represents the equilibrium condition of a monopolist. Where Pe denotes
the equilibrium price and Qe denotes the equilibrium output at that price level. Now it can easily
be observed from the diagram above that if the seller increases the price level from Pe to P1 the
quantity demanded will fall to Q1.
However, as the “Value of exclusivity” is assumed it is quite evident that the seller has
already decided to restrict the amount of output that it was supplying. As it has been observed
that the producer is now selling a reduced amount while maintaining the price at a low level. As
the firm is operating under monopoly market structure it does not possess a supply curve as a
result the restriction over the supply will influence the demand curve of the firm (Naumenko &
Output
O Qe
Pe
P1
D=AR=P
MR
MC
AC
Q1
ECONOMICS FOR MANAGERS 6
Figure 3: Monopoly Market Structure
(Source: Created by Author)
The figure above represents the equilibrium condition of a monopolist. Where Pe denotes
the equilibrium price and Qe denotes the equilibrium output at that price level. Now it can easily
be observed from the diagram above that if the seller increases the price level from Pe to P1 the
quantity demanded will fall to Q1.
However, as the “Value of exclusivity” is assumed it is quite evident that the seller has
already decided to restrict the amount of output that it was supplying. As it has been observed
that the producer is now selling a reduced amount while maintaining the price at a low level. As
the firm is operating under monopoly market structure it does not possess a supply curve as a
result the restriction over the supply will influence the demand curve of the firm (Naumenko &
Paraphrase This Document
Need a fresh take? Get an instant paraphrase of this document with our AI Paraphraser
ECONOMICS FOR MANAGERS 7
Moosavian 2016, P. 74). The implementation of the value of excludability coupled with the
lower price in turn helps the seller to raise the demand for its products and services substantially.
As a result of the aforesaid procedures the demand curve as well as the marginal revenue
curve of the individual will shift upwards to the right. This is explained with the help of the
following figure,
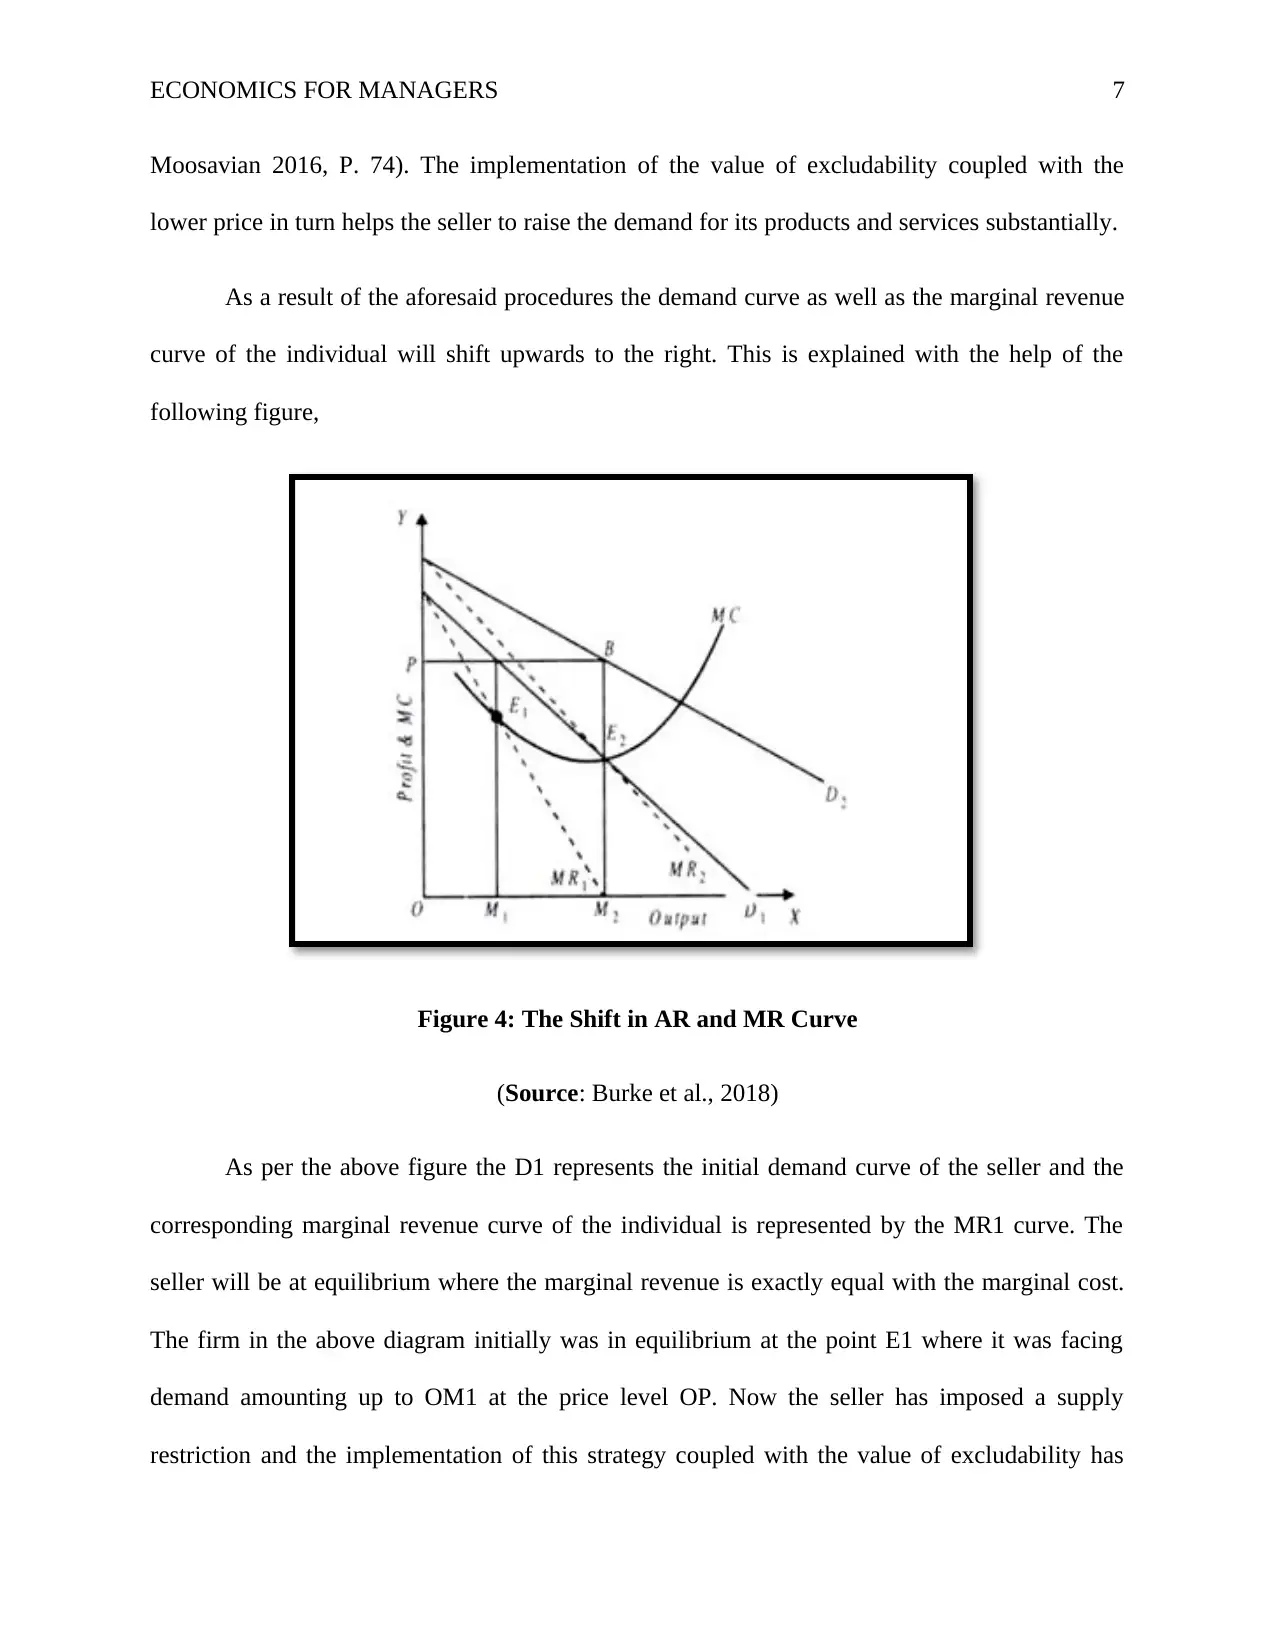
Figure 4: The Shift in AR and MR Curve
(Source: Burke et al., 2018)
As per the above figure the D1 represents the initial demand curve of the seller and the
corresponding marginal revenue curve of the individual is represented by the MR1 curve. The
seller will be at equilibrium where the marginal revenue is exactly equal with the marginal cost.
The firm in the above diagram initially was in equilibrium at the point E1 where it was facing
demand amounting up to OM1 at the price level OP. Now the seller has imposed a supply
restriction and the implementation of this strategy coupled with the value of excludability has
Moosavian 2016, P. 74). The implementation of the value of excludability coupled with the
lower price in turn helps the seller to raise the demand for its products and services substantially.
As a result of the aforesaid procedures the demand curve as well as the marginal revenue
curve of the individual will shift upwards to the right. This is explained with the help of the
following figure,
Figure 4: The Shift in AR and MR Curve
(Source: Burke et al., 2018)
As per the above figure the D1 represents the initial demand curve of the seller and the
corresponding marginal revenue curve of the individual is represented by the MR1 curve. The
seller will be at equilibrium where the marginal revenue is exactly equal with the marginal cost.
The firm in the above diagram initially was in equilibrium at the point E1 where it was facing
demand amounting up to OM1 at the price level OP. Now the seller has imposed a supply
restriction and the implementation of this strategy coupled with the value of excludability has
ECONOMICS FOR MANAGERS 8
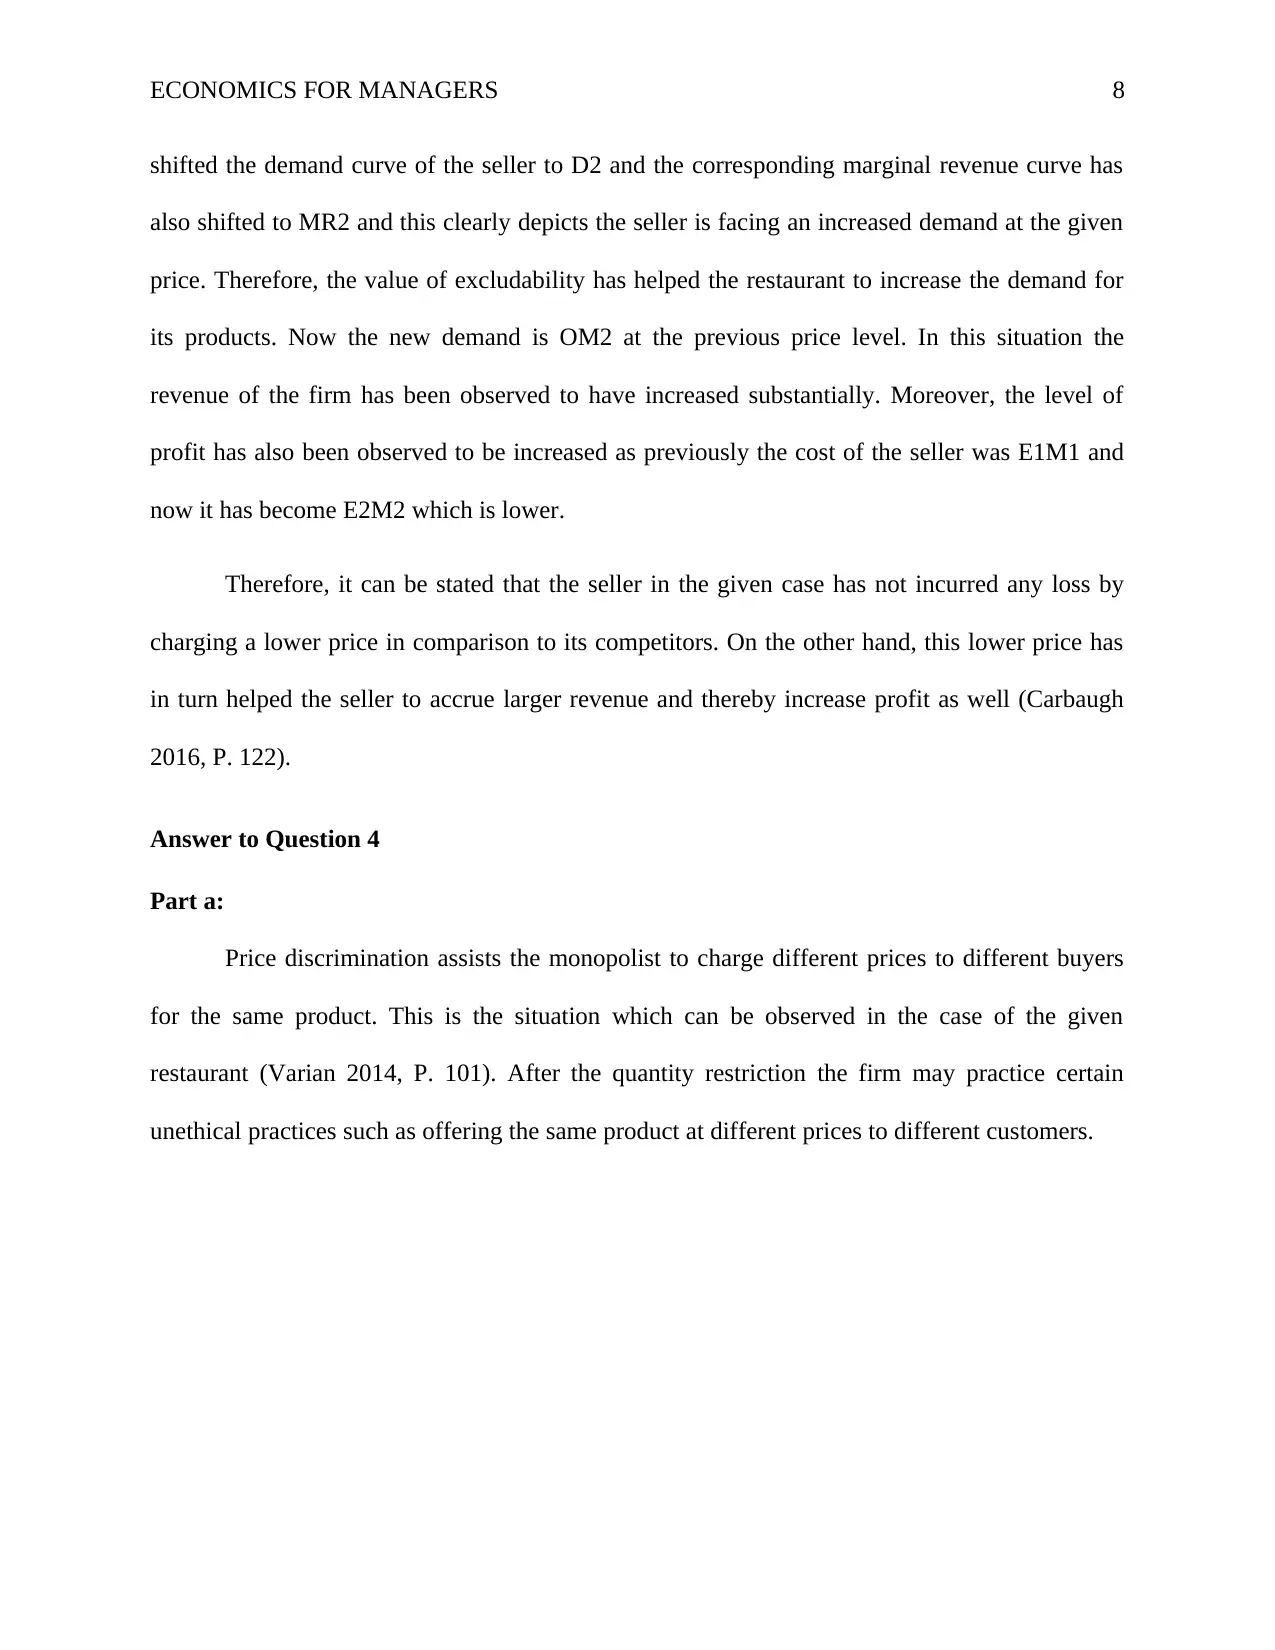
shifted the demand curve of the seller to D2 and the corresponding marginal revenue curve has
also shifted to MR2 and this clearly depicts the seller is facing an increased demand at the given
price. Therefore, the value of excludability has helped the restaurant to increase the demand for
its products. Now the new demand is OM2 at the previous price level. In this situation the
revenue of the firm has been observed to have increased substantially. Moreover, the level of
profit has also been observed to be increased as previously the cost of the seller was E1M1 and
now it has become E2M2 which is lower.
Therefore, it can be stated that the seller in the given case has not incurred any loss by
charging a lower price in comparison to its competitors. On the other hand, this lower price has
in turn helped the seller to accrue larger revenue and thereby increase profit as well (Carbaugh
2016, P. 122).
Answer to Question 4
Part a:
Price discrimination assists the monopolist to charge different prices to different buyers
for the same product. This is the situation which can be observed in the case of the given
restaurant (Varian 2014, P. 101). After the quantity restriction the firm may practice certain
unethical practices such as offering the same product at different prices to different customers.
⊘ This is a preview!⊘
Do you want full access?
Subscribe today to unlock all pages.
Trusted by 1+ million students worldwide
Price
O
P1
P0
OutputQ0
MC
D0
D1
MR0MR1
AC
C
ECONOMICS FOR MANAGERS 9
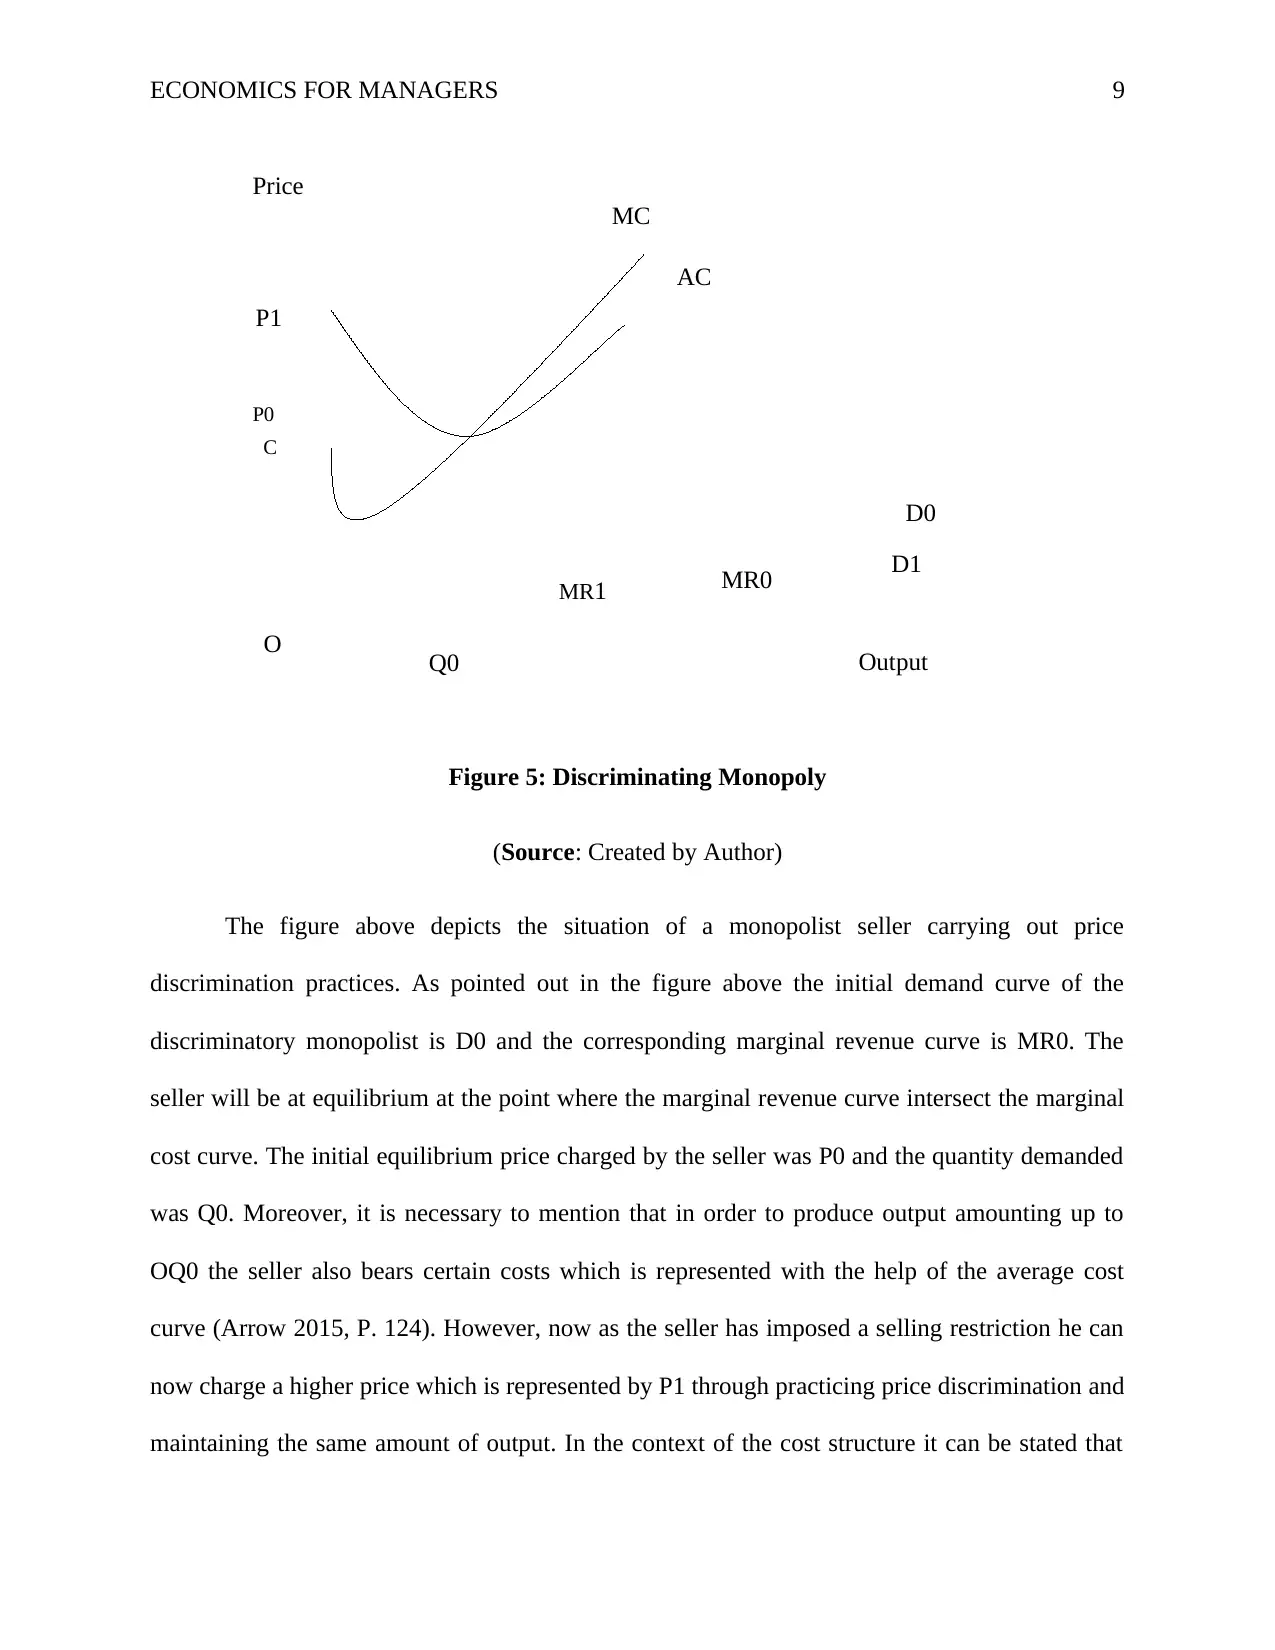
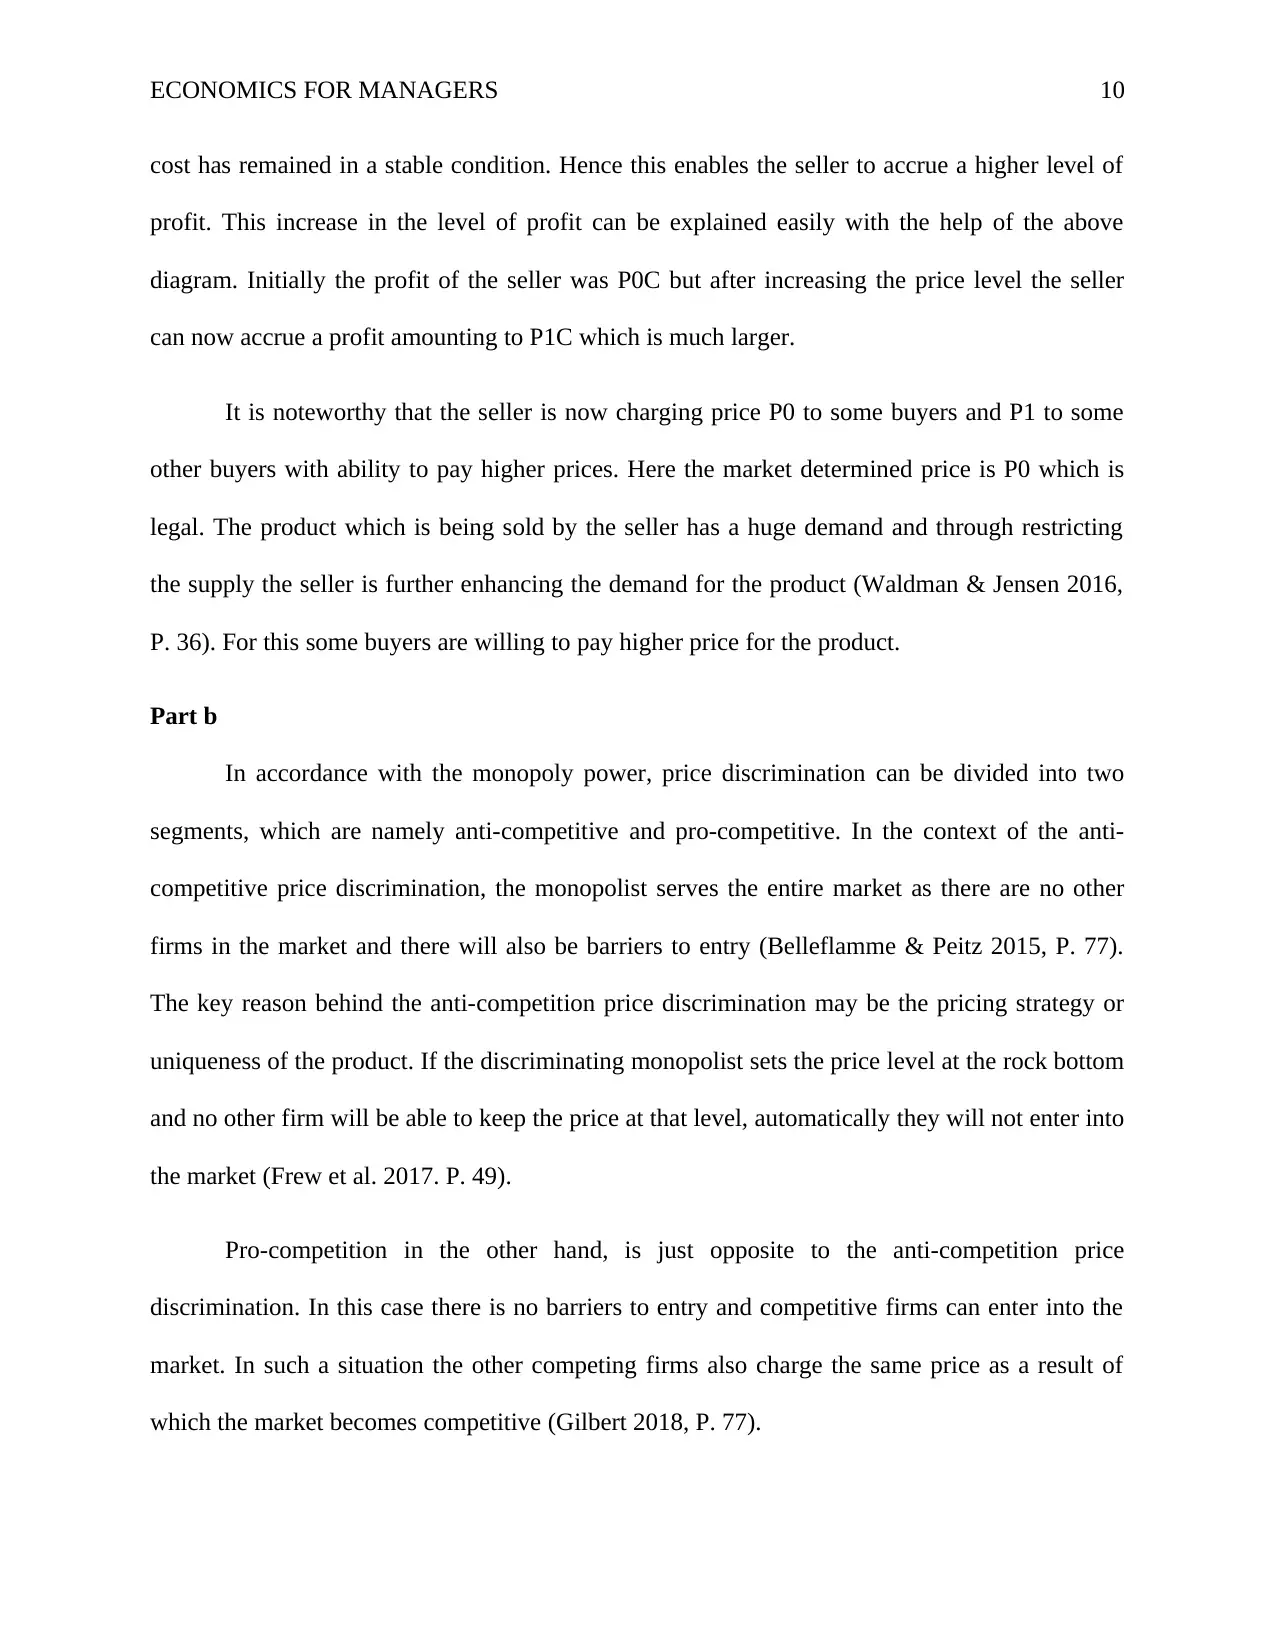
Figure 5: Discriminating Monopoly
(Source: Created by Author)
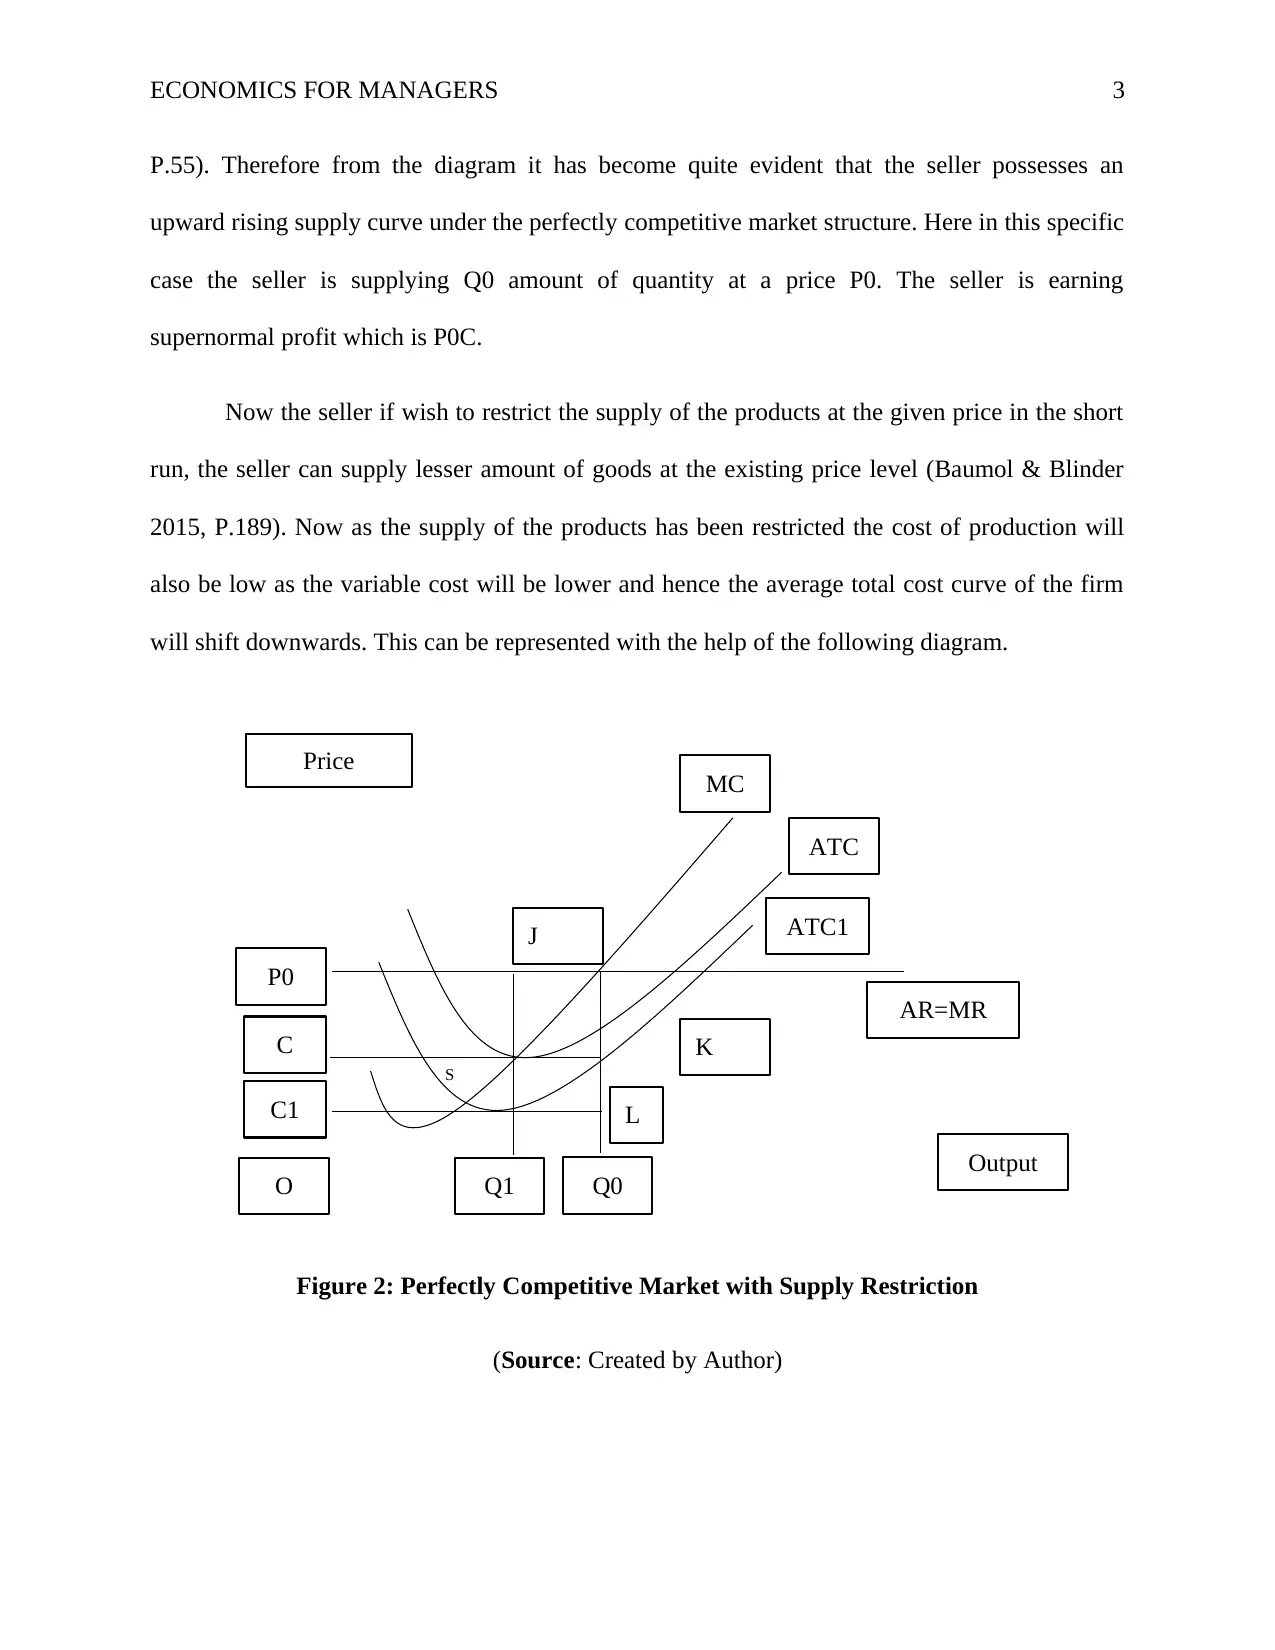
The figure above depicts the situation of a monopolist seller carrying out price
discrimination practices. As pointed out in the figure above the initial demand curve of the
discriminatory monopolist is D0 and the corresponding marginal revenue curve is MR0. The
seller will be at equilibrium at the point where the marginal revenue curve intersect the marginal
cost curve. The initial equilibrium price charged by the seller was P0 and the quantity demanded
was Q0. Moreover, it is necessary to mention that in order to produce output amounting up to
OQ0 the seller also bears certain costs which is represented with the help of the average cost
curve (Arrow 2015, P. 124). However, now as the seller has imposed a selling restriction he can
now charge a higher price which is represented by P1 through practicing price discrimination and
maintaining the same amount of output. In the context of the cost structure it can be stated that
O
P1
P0
OutputQ0
MC
D0
D1
MR0MR1
AC
C
ECONOMICS FOR MANAGERS 9
Figure 5: Discriminating Monopoly
(Source: Created by Author)
The figure above depicts the situation of a monopolist seller carrying out price
discrimination practices. As pointed out in the figure above the initial demand curve of the
discriminatory monopolist is D0 and the corresponding marginal revenue curve is MR0. The
seller will be at equilibrium at the point where the marginal revenue curve intersect the marginal
cost curve. The initial equilibrium price charged by the seller was P0 and the quantity demanded
was Q0. Moreover, it is necessary to mention that in order to produce output amounting up to
OQ0 the seller also bears certain costs which is represented with the help of the average cost
curve (Arrow 2015, P. 124). However, now as the seller has imposed a selling restriction he can
now charge a higher price which is represented by P1 through practicing price discrimination and
maintaining the same amount of output. In the context of the cost structure it can be stated that
Paraphrase This Document
Need a fresh take? Get an instant paraphrase of this document with our AI Paraphraser
ECONOMICS FOR MANAGERS 10
cost has remained in a stable condition. Hence this enables the seller to accrue a higher level of
profit. This increase in the level of profit can be explained easily with the help of the above
diagram. Initially the profit of the seller was P0C but after increasing the price level the seller
can now accrue a profit amounting to P1C which is much larger.
It is noteworthy that the seller is now charging price P0 to some buyers and P1 to some
other buyers with ability to pay higher prices. Here the market determined price is P0 which is
legal. The product which is being sold by the seller has a huge demand and through restricting
the supply the seller is further enhancing the demand for the product (Waldman & Jensen 2016,
P. 36). For this some buyers are willing to pay higher price for the product.
Part b
In accordance with the monopoly power, price discrimination can be divided into two
segments, which are namely anti-competitive and pro-competitive. In the context of the anti-
competitive price discrimination, the monopolist serves the entire market as there are no other
firms in the market and there will also be barriers to entry (Belleflamme & Peitz 2015, P. 77).
The key reason behind the anti-competition price discrimination may be the pricing strategy or
uniqueness of the product. If the discriminating monopolist sets the price level at the rock bottom
and no other firm will be able to keep the price at that level, automatically they will not enter into
the market (Frew et al. 2017. P. 49).
Pro-competition in the other hand, is just opposite to the anti-competition price
discrimination. In this case there is no barriers to entry and competitive firms can enter into the
market. In such a situation the other competing firms also charge the same price as a result of
which the market becomes competitive (Gilbert 2018, P. 77).
P0
Price
Q0 Q1
P1
Quantity
ECONOMICS FOR MANAGERS 11
In the context of the given scenario, it can be observed that the restaurant is practicing
anti-competitive price discrimination. This large and reputed restaurant is maintaining a lower
price of its products which in turn is restricting the other small firms to compete in the
marketplace. As a result of this the firm is reducing the level of competition in the market.
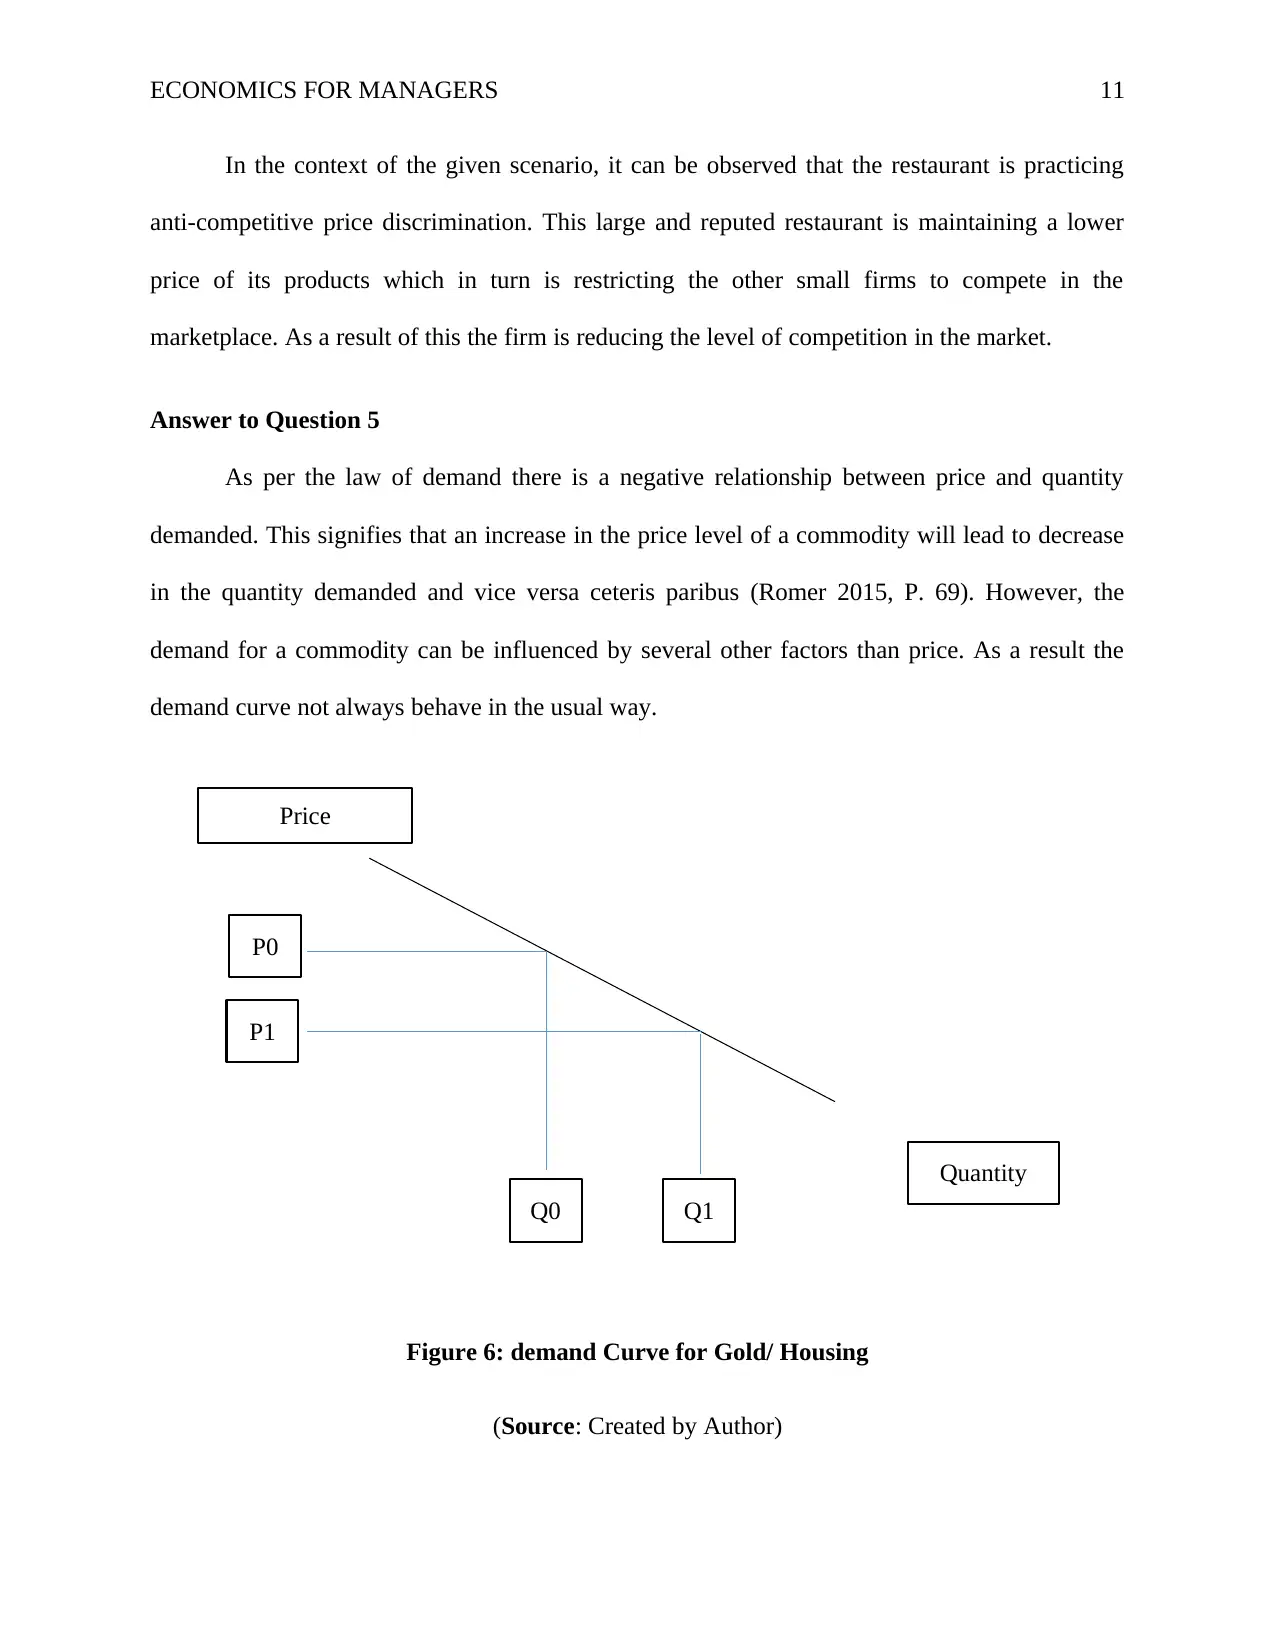
Answer to Question 5
As per the law of demand there is a negative relationship between price and quantity
demanded. This signifies that an increase in the price level of a commodity will lead to decrease
in the quantity demanded and vice versa ceteris paribus (Romer 2015, P. 69). However, the
demand for a commodity can be influenced by several other factors than price. As a result the
demand curve not always behave in the usual way.
Figure 6: demand Curve for Gold/ Housing
(Source: Created by Author)
Price
Q0 Q1
P1
Quantity
ECONOMICS FOR MANAGERS 11
In the context of the given scenario, it can be observed that the restaurant is practicing
anti-competitive price discrimination. This large and reputed restaurant is maintaining a lower
price of its products which in turn is restricting the other small firms to compete in the
marketplace. As a result of this the firm is reducing the level of competition in the market.
Answer to Question 5
As per the law of demand there is a negative relationship between price and quantity
demanded. This signifies that an increase in the price level of a commodity will lead to decrease
in the quantity demanded and vice versa ceteris paribus (Romer 2015, P. 69). However, the
demand for a commodity can be influenced by several other factors than price. As a result the
demand curve not always behave in the usual way.
Figure 6: demand Curve for Gold/ Housing
(Source: Created by Author)
⊘ This is a preview!⊘
Do you want full access?
Subscribe today to unlock all pages.
Trusted by 1+ million students worldwide
1 out of 16
Related Documents


Your All-in-One AI-Powered Toolkit for Academic Success.
+13062052269
info@desklib.com
Available 24*7 on WhatsApp / Email
![[object Object]](/_next/static/media/star-bottom.7253800d.svg)
Unlock your academic potential
Copyright © 2020–2026 A2Z Services. All Rights Reserved. Developed and managed by ZUCOL.