ECON20039: Economics for Managers Microeconomics Report
VerifiedAdded on 2022/08/30
|18
|4223
|14
Report
AI Summary
This report provides a comprehensive analysis of microeconomic concepts, specifically focusing on price elasticity of demand and market structures. It begins by defining price elasticity of demand, differentiating between own price, cross price, and income elasticities, and exploring the characteristics of elastic, inelastic, and unit elastic goods. The report then presents real-world examples of price elasticity, citing studies on soft drinks (elastic) and electricity (inelastic) to illustrate how these concepts influence business decision-making, particularly in pricing strategies. The second part of the report delves into market structures, with a detailed examination of oligopoly, including its characteristics, barriers to entry, and the impact of market power on pricing and profit. It uses the car manufacturing industry as an example, highlighting the importance of product differentiation and the potential for collusion within an oligopolistic market. The report concludes with a discussion of the implications of these market structures on resource allocation and social welfare. This assignment is a research essay for the course ECON20039- Economics for Managers Term 3, 2019.
Running head: Microeconomics
Microeconomics
Name of the Student
Name of the University
Student ID
Microeconomics
Name of the Student
Name of the University
Student ID
Paraphrase This Document
Need a fresh take? Get an instant paraphrase of this document with our AI Paraphraser
1Microeconomics
Table of Contents
Answer a..........................................................................................................................................2
Answer b..........................................................................................................................................6
Answer c..........................................................................................................................................9
Reference List................................................................................................................................12
Appendix........................................................................................................................................15
2Microeconomics
Answer a
Theory of microeconomics suggests various concepts that help firms in the market to
make price and output decisions in order to maximize revenue and sustain in the market. One of
such theories is price elasticity of demand (Jawad et al., 2018). The price elasticity of demand is
defined as the alteration in amount of quantity demanded in response to alteration in price. The
price elasticity of demand is of various types and they own price elasticity of demand and cross
price elasticity of demand.
Own price elasticity of demand is defined as the alteration in amount of quantity
demanded of a product due to alteration in its own price. Similarly, the cross price elasticity of
demand is the alteration in amount of quantity demanded of product due to variation in price of
another product (Huang et al., 2018). In this case both the product could be substitutes or
complementary to each other. Finally, income elasticity of demand is the variation in amount of
quantity demanded of a product in response to change in income of the consumers.
The price elasticity of demand could be inelastic, unit elastic or highly elastic in nature. A
product is called as inelastic if the alteration in percentage of quantity demanded of a good is
lower than the alteration in percentage of price (Miller & Alebrini, 2016). Alternatively, if the
percentage alteration in amount of quantity demanded of a product is larger than the alteration of
percentage of price then the product is called as highly elastic. Then again, if the alteration in
amount of quantity demanded of a good is same as the alteration of percentage of price then the
good is termed as unit elastic. The price elasticity of demand is dependent on the type of good
that means if the good is normal, then in most cases, the price elasticity of demand is unit elastic.
In the case of necessary and demerit goods, the price elasticity of demand is always inelastic in
⊘ This is a preview!⊘
Do you want full access?
Subscribe today to unlock all pages.
Trusted by 1+ million students worldwide
3Microeconomics
nature (Evans & Popova, 2017). Further, if inferior goods are considered then the price elasticity
of demand for such good as per the theory and empirical evidence is more than 1 that means it is
highly elastic in nature.
The above discussed concept of price elasticity of demand is an essential part of business
decision making. The notion of price elasticity of demand aids the firms or producer of goods to
understand the category of the product they produce and the kind of product their competitors
produce. It also helps to understand the tradeoff between their product and their substitute or
complementary products (Sarkar & Lee, 2017). With the use of concept of price elasticity of
demand, the firms can make the choice of the suitable price strategy. On the other hand, in the
case of firms that have complementary and substitute products it is easier to understand the
impact of price change of other product on their own product and take price decision depending
on the value of price elasticity of demand. It means that the firms has to alter its price or supply
if the product is highly elastic but if its highly inelastic then such effective strategies are not
required.
The price elasticity of demand for soft drinks, other sweetened drinks and sugary
products is area of interest for the producers of the products because business strategy and
pricing decision depends on it (Artega, Flores & Luna, 2017). Thus, a study has been conducted
in Chile regarding price elasticity of the sweetened drinks and foods. As per the journal article,
Chile is the second largest consumer of sugary drinks of the world if per capita consumption of
the drinks are considered. Researches have showed that the problem of obesity is connected with
the habit of sugary drinks consumption (Wang, Rojas & Colantuoni, 2016). Due to this, the study
has been conducted to find the responses of the consumers to the change of price of the products
in the country. The study has identified that the own price elasticity of demand in case of soft
Paraphrase This Document
Need a fresh take? Get an instant paraphrase of this document with our AI Paraphraser
4Microeconomics
drinks is -1.37 (Böcker, T. G., & Finger, 2016). From the value, it is evident that for 1% surge in
price of soft drinks the demand for the products decrease by 1.37%. Therefore, it can be said that
he soft drinks are highly price elastic because the own price elasticity of demand for soft drinks
is larger than 1. It can further be added that the price elasticity of soft drinks are high because
there are many substitutes of soft drinks and due to that reason if the soft drinks’ price increase
then the consumers have the option to switch to other products. Apart from that, soft drinks are
not necessary or luxury good and thus consumers are not bound to stick to it and can move easily
to other products or can reduce the consumption and that would not change the utility of the
consumers significantly (Yii, Geetha & Chandran, 2017). Thus, these are the reasons due to
which the price elasticity of demand for soft drink is high.
Moreover, an analysis of price elasticity of demand for electricity in the United States in
2017 found that in the short the elasticity of electricity in the US ranges between -0.1. From the
value, it is evident that the electricity in the short run is price elastic. The reason for price
inelastic behavior of demand for electricity is the category of the product. Electricity is a
necessary good and thus people tend to retain the amount of consumption even after rise in it is
price (Wakashiro, 2019). This is because in the short run, there is no substitute of electricity and
it is important because without it almost no home appliances and factory machineries would run.
Hence, the product is price inelastic.
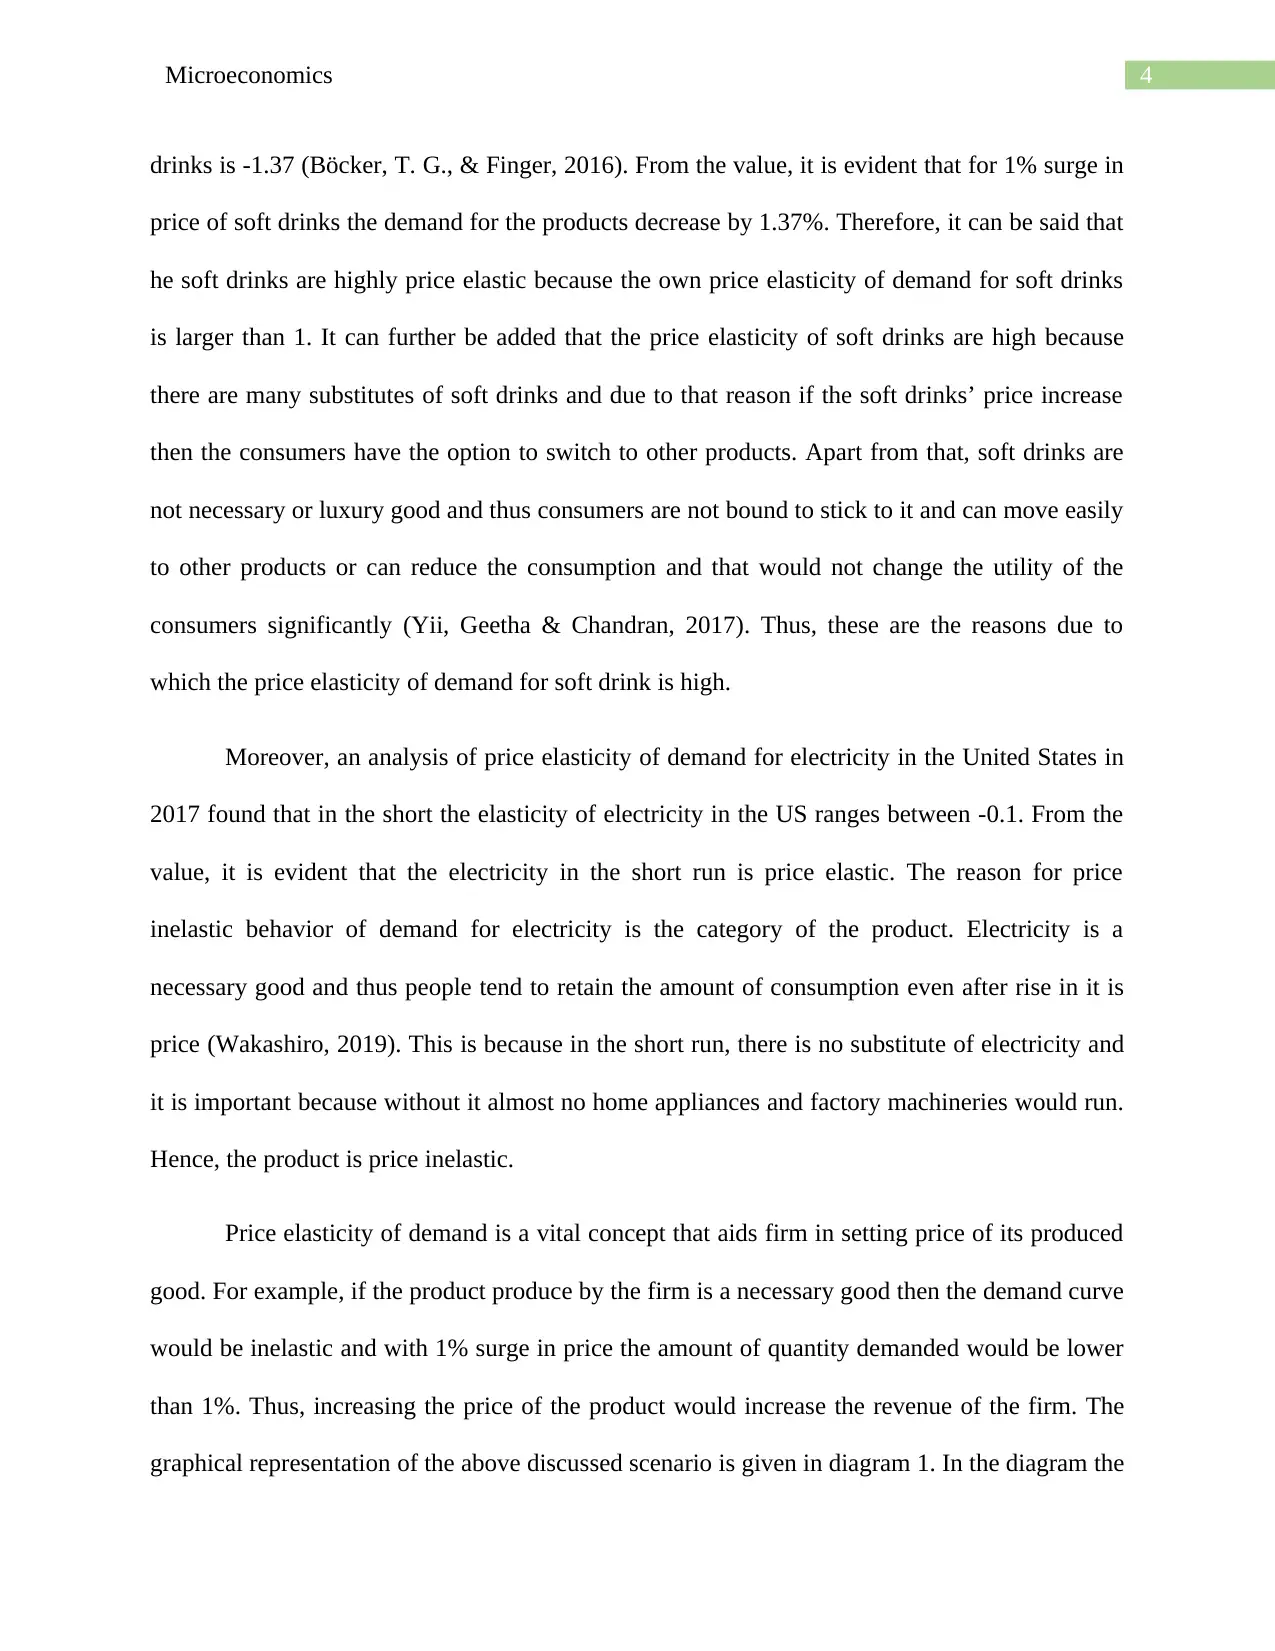
Price elasticity of demand is a vital concept that aids firm in setting price of its produced
good. For example, if the product produce by the firm is a necessary good then the demand curve
would be inelastic and with 1% surge in price the amount of quantity demanded would be lower
than 1%. Thus, increasing the price of the product would increase the revenue of the firm. The
graphical representation of the above discussed scenario is given in diagram 1. In the diagram the
drinks is -1.37 (Böcker, T. G., & Finger, 2016). From the value, it is evident that for 1% surge in
price of soft drinks the demand for the products decrease by 1.37%. Therefore, it can be said that
he soft drinks are highly price elastic because the own price elasticity of demand for soft drinks
is larger than 1. It can further be added that the price elasticity of soft drinks are high because
there are many substitutes of soft drinks and due to that reason if the soft drinks’ price increase
then the consumers have the option to switch to other products. Apart from that, soft drinks are
not necessary or luxury good and thus consumers are not bound to stick to it and can move easily
to other products or can reduce the consumption and that would not change the utility of the
consumers significantly (Yii, Geetha & Chandran, 2017). Thus, these are the reasons due to
which the price elasticity of demand for soft drink is high.
Moreover, an analysis of price elasticity of demand for electricity in the United States in
2017 found that in the short the elasticity of electricity in the US ranges between -0.1. From the
value, it is evident that the electricity in the short run is price elastic. The reason for price
inelastic behavior of demand for electricity is the category of the product. Electricity is a
necessary good and thus people tend to retain the amount of consumption even after rise in it is
price (Wakashiro, 2019). This is because in the short run, there is no substitute of electricity and
it is important because without it almost no home appliances and factory machineries would run.
Hence, the product is price inelastic.
Price elasticity of demand is a vital concept that aids firm in setting price of its produced
good. For example, if the product produce by the firm is a necessary good then the demand curve
would be inelastic and with 1% surge in price the amount of quantity demanded would be lower
than 1%. Thus, increasing the price of the product would increase the revenue of the firm. The
graphical representation of the above discussed scenario is given in diagram 1. In the diagram the
5Microeconomics
D*
D
P
P*
Quantity
Price D
D1 D
P
P1
Quantity
Price
D
value of product of P*D* is greater than the product of PD and it is evident because the area of
rectangle given by P*D* is larger than the rectangle given by PD. Thus, the revenue of eh firm
would increase if the firm increase the price it would increase the
revenue of the firm.
Diagram 1: Price inelastic necessary good
Source: (Created by the Author)
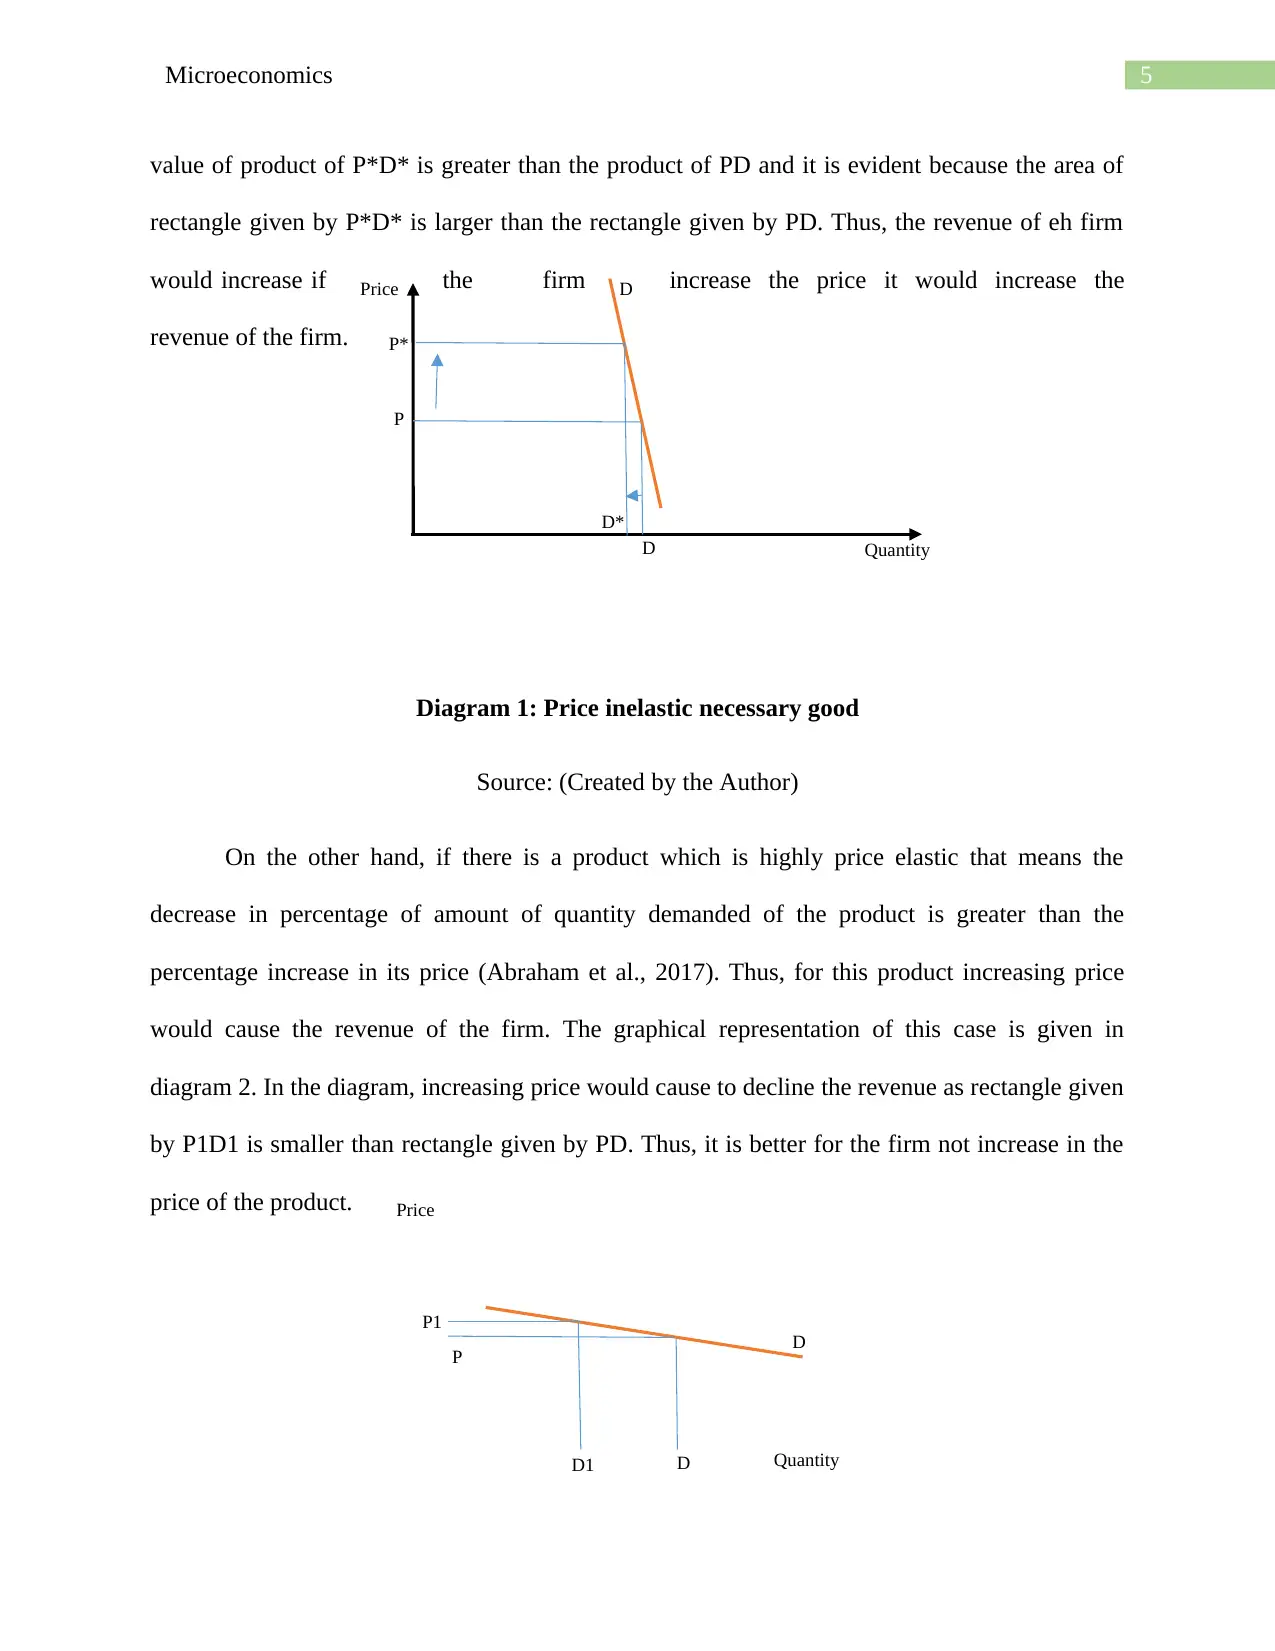
On the other hand, if there is a product which is highly price elastic that means the
decrease in percentage of amount of quantity demanded of the product is greater than the
percentage increase in its price (Abraham et al., 2017). Thus, for this product increasing price
would cause the revenue of the firm. The graphical representation of this case is given in
diagram 2. In the diagram, increasing price would cause to decline the revenue as rectangle given
by P1D1 is smaller than rectangle given by PD. Thus, it is better for the firm not increase in the
price of the product.
D*
D
P
P*
Quantity
Price D
D1 D
P
P1
Quantity
Price
D
value of product of P*D* is greater than the product of PD and it is evident because the area of
rectangle given by P*D* is larger than the rectangle given by PD. Thus, the revenue of eh firm
would increase if the firm increase the price it would increase the
revenue of the firm.
Diagram 1: Price inelastic necessary good
Source: (Created by the Author)
On the other hand, if there is a product which is highly price elastic that means the
decrease in percentage of amount of quantity demanded of the product is greater than the
percentage increase in its price (Abraham et al., 2017). Thus, for this product increasing price
would cause the revenue of the firm. The graphical representation of this case is given in
diagram 2. In the diagram, increasing price would cause to decline the revenue as rectangle given
by P1D1 is smaller than rectangle given by PD. Thus, it is better for the firm not increase in the
price of the product.
⊘ This is a preview!⊘
Do you want full access?
Subscribe today to unlock all pages.
Trusted by 1+ million students worldwide
6Microeconomics
Diagram 2: Highly price elastic normal good
Source: (Created by the Author)
Answer b
The theory of market suggest four kinds of market structure and they are monopolistic
competition, monopoly, perfect competition and oligopoly. Among all the market structures, in
oligopoly and monopoly the firms have significant market power due to which they act as price
setter. Oligopoly market structure is the main concern of discussion in this case. In oligopoly
market structure, there are few number of firms and numerous buyers and thus the firms have
significant amount of power over the market (Head & Spence, 2017). This type of market
structure has high fixed cost and thus only few firms operate in the market. A suitable example
of oligopoly industry is Telecom industry. Due to existence of high fixed cost, there is extreme
barriers to entry and exit in the market (Baptista, R., & Karaöz, 2017). Thus, firms can impact
the market by setting price and can earn supernormal profit by charging high price (Sylos-Labini,
2016). The consumers in the market are thus get exploited as they do not have many options to
bargain. The demand curve of the firms are the market demand curve in this market structure
since the market power is shared by the firms in the industry. The supernormal profit earned by
the firms is however is lower than in the case of monopoly market (Chen & Zhu, 2018).
However, it should be noted that the firms in an oligopoly market in order to increase profit can
collude with each other, charge price as high as possible, and earn supernormal profit equivalent
to monopoly firms. For example, Barclays and RBS colluded in 2010 to avid competition and
Paraphrase This Document
Need a fresh take? Get an instant paraphrase of this document with our AI Paraphraser
7Microeconomics
charge high loan prices from the professionals like accountants and lawyers (Colombo, 2016).
However, RBS was fined for the collusion activity.
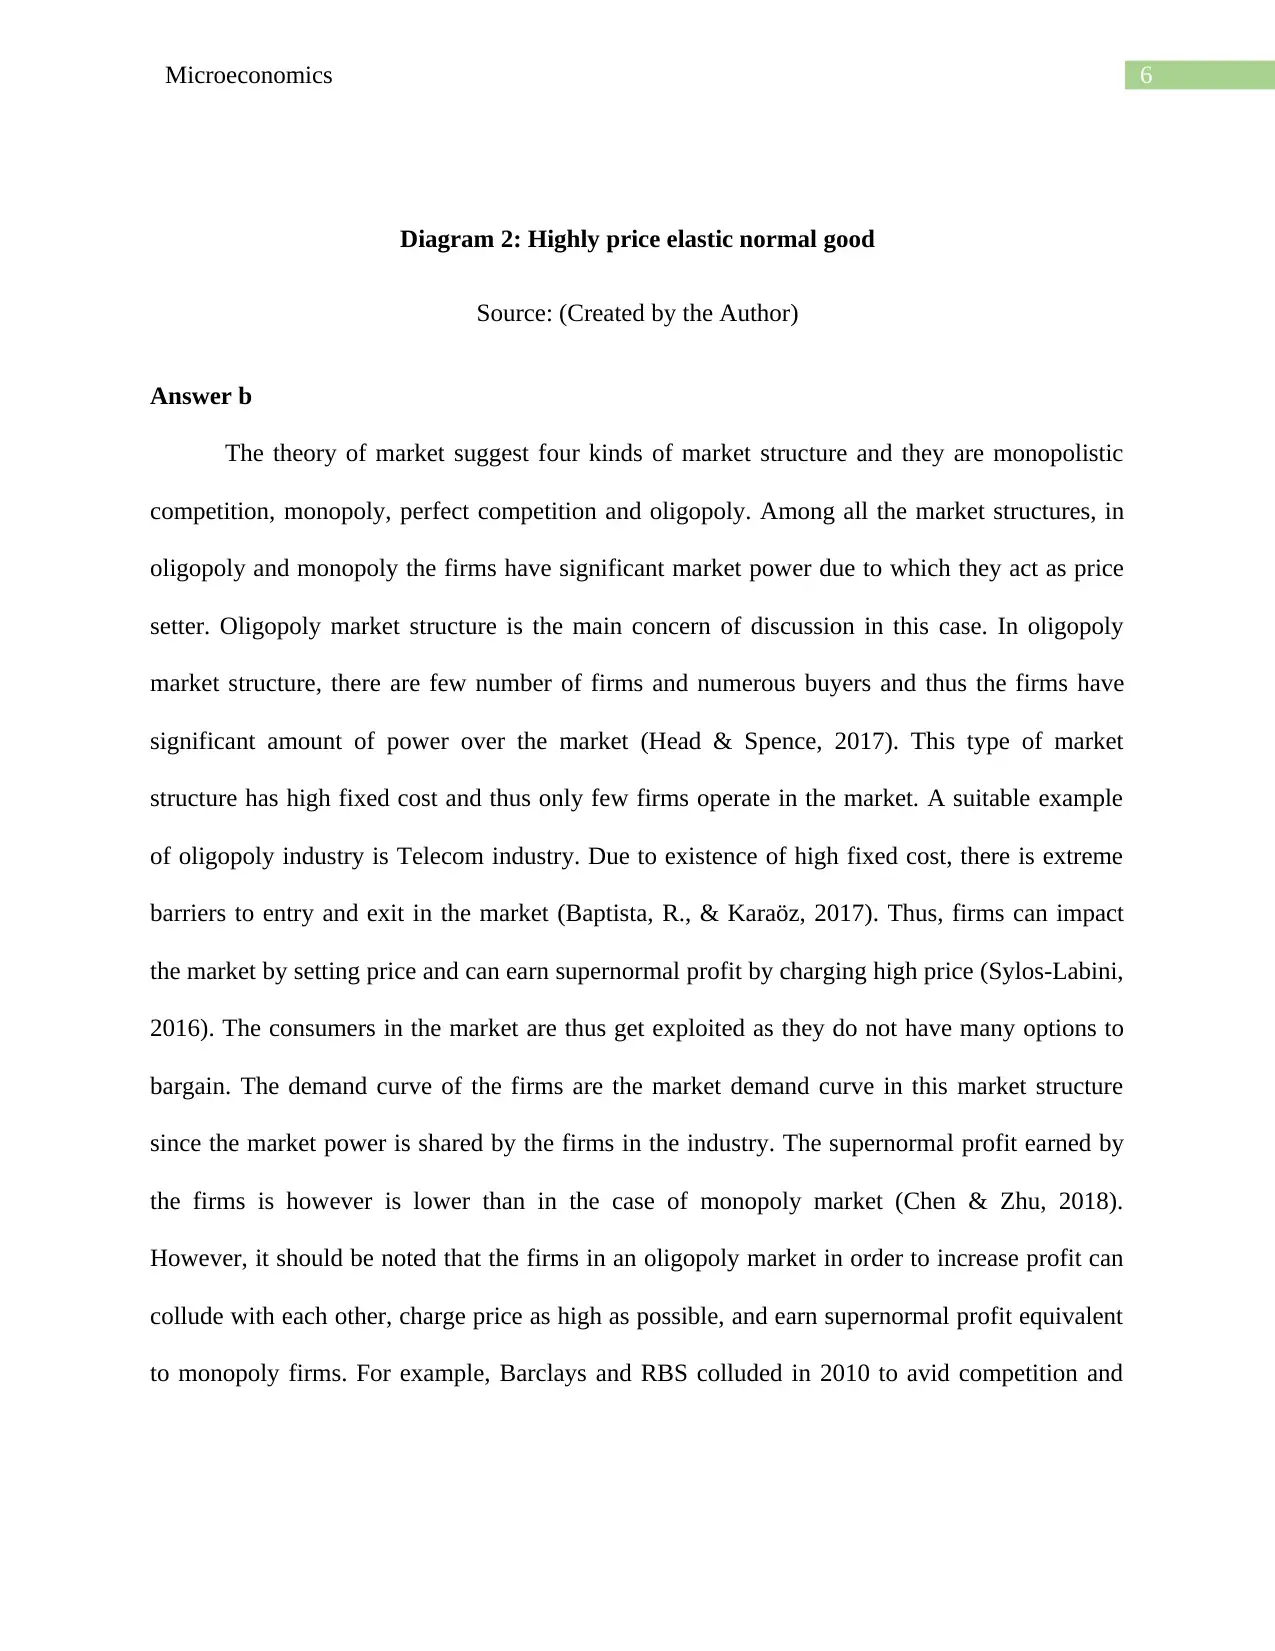
A good example of oligopolistic market structure is car manufacturing industry. It is
oligopolistic in nature because car manufacturing is a costly process and thus only few firms
engage themselves in manufacturing of cars. Thus, the industry has only few number of firms
and they dominate the car market. The car manufacturing industry has significant amount of
entry and exit barriers due to the presence of high fixed cost and few number of firms and hence
new firms face problem to enter the industry (Dadpay, Yilmaz & Xie, 2019). Thus, with market
power the car manufacturing firms can charge high price for their product and thus earn super
normal profit. However, as there more firms than monopoly market the amount of profit is lower.
Oligopoly firms has a scope of earning supernormal profit equivalent to monopoly if the firms in
the market collude with each other. Under collusion, the firms cooperate with each other and set
the highest price possible and thereby earning supernormal profit. Thus, under collusion firms in
oligopoly car manufacturing industry function as monopoly firms and earn profit as high as in
the case of monopoly markets.
charge high loan prices from the professionals like accountants and lawyers (Colombo, 2016).
However, RBS was fined for the collusion activity.
A good example of oligopolistic market structure is car manufacturing industry. It is
oligopolistic in nature because car manufacturing is a costly process and thus only few firms
engage themselves in manufacturing of cars. Thus, the industry has only few number of firms
and they dominate the car market. The car manufacturing industry has significant amount of
entry and exit barriers due to the presence of high fixed cost and few number of firms and hence
new firms face problem to enter the industry (Dadpay, Yilmaz & Xie, 2019). Thus, with market
power the car manufacturing firms can charge high price for their product and thus earn super
normal profit. However, as there more firms than monopoly market the amount of profit is lower.
Oligopoly firms has a scope of earning supernormal profit equivalent to monopoly if the firms in
the market collude with each other. Under collusion, the firms cooperate with each other and set
the highest price possible and thereby earning supernormal profit. Thus, under collusion firms in
oligopoly car manufacturing industry function as monopoly firms and earn profit as high as in
the case of monopoly markets.
8Microeconomics
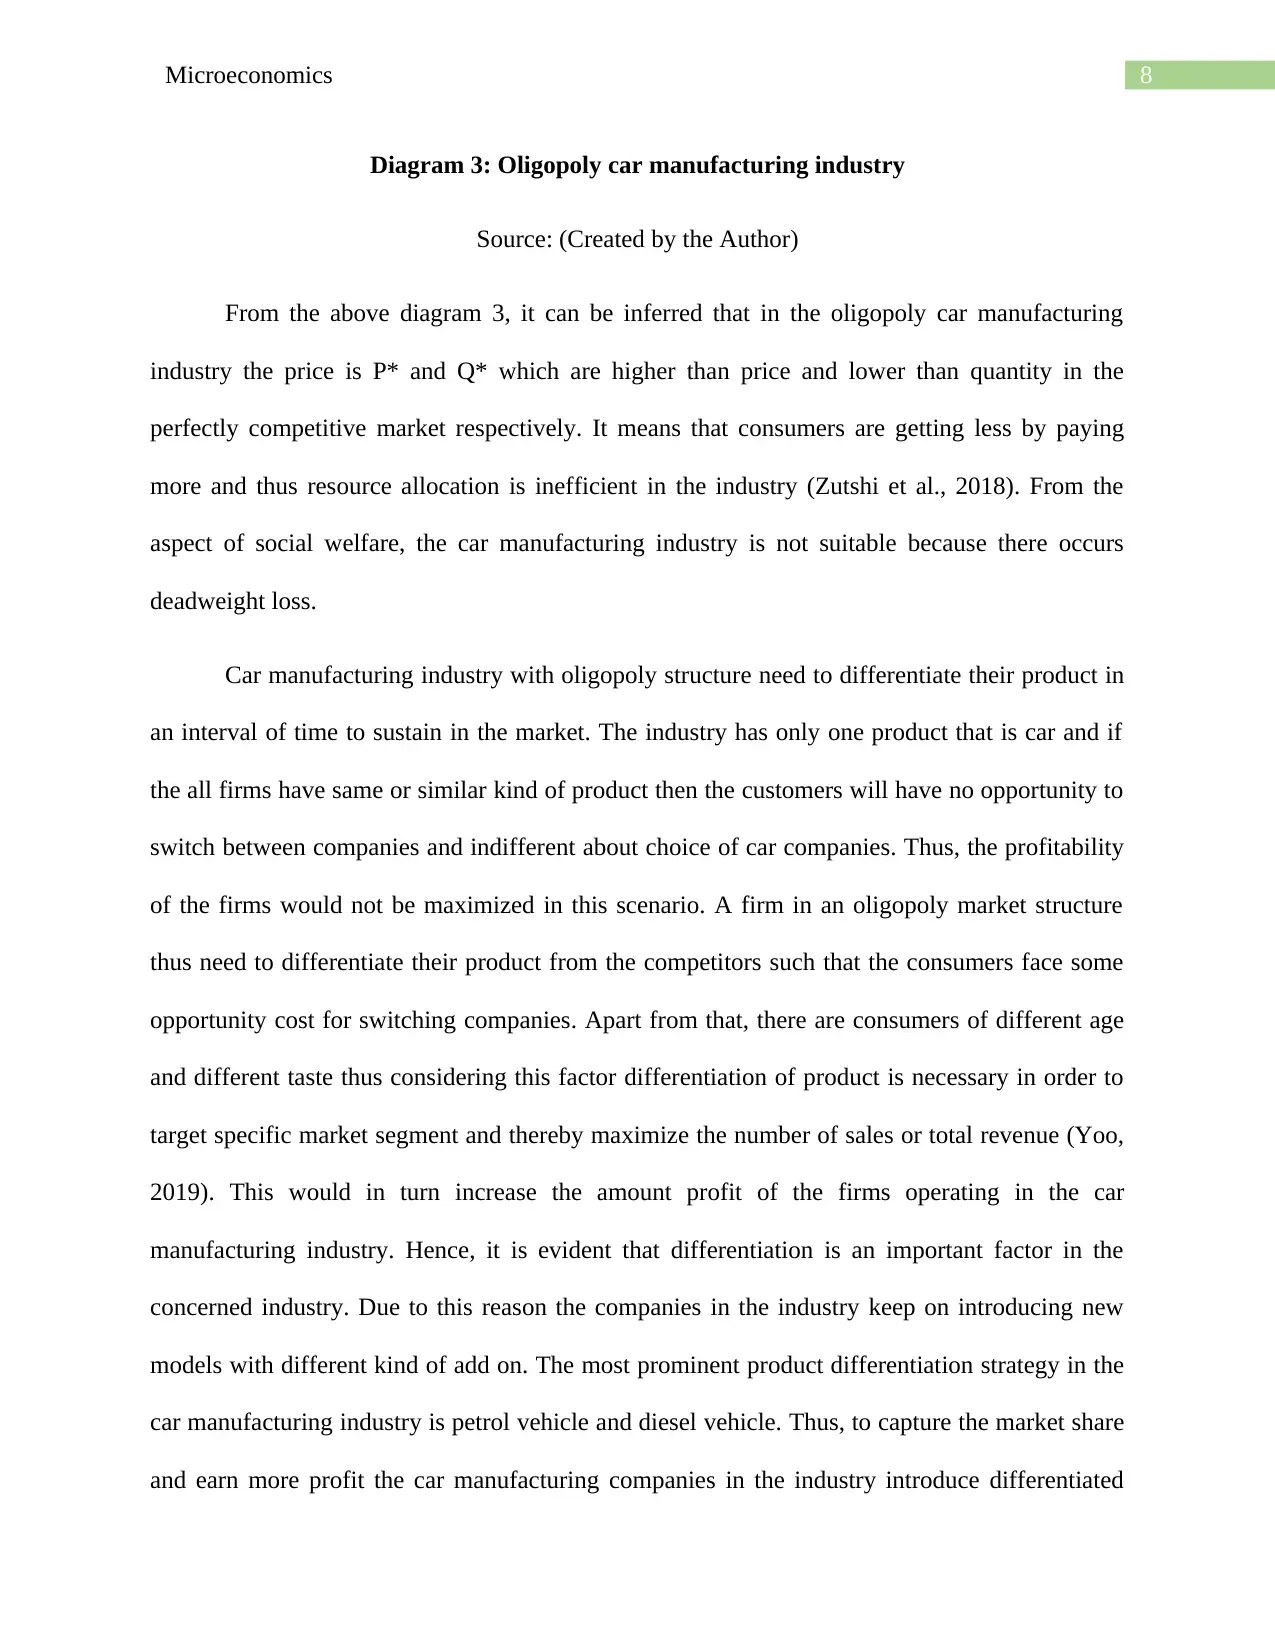
Diagram 3: Oligopoly car manufacturing industry
Source: (Created by the Author)
From the above diagram 3, it can be inferred that in the oligopoly car manufacturing
industry the price is P* and Q* which are higher than price and lower than quantity in the
perfectly competitive market respectively. It means that consumers are getting less by paying
more and thus resource allocation is inefficient in the industry (Zutshi et al., 2018). From the
aspect of social welfare, the car manufacturing industry is not suitable because there occurs
deadweight loss.
Car manufacturing industry with oligopoly structure need to differentiate their product in
an interval of time to sustain in the market. The industry has only one product that is car and if
the all firms have same or similar kind of product then the customers will have no opportunity to
switch between companies and indifferent about choice of car companies. Thus, the profitability
of the firms would not be maximized in this scenario. A firm in an oligopoly market structure
thus need to differentiate their product from the competitors such that the consumers face some
opportunity cost for switching companies. Apart from that, there are consumers of different age
and different taste thus considering this factor differentiation of product is necessary in order to
target specific market segment and thereby maximize the number of sales or total revenue (Yoo,
2019). This would in turn increase the amount profit of the firms operating in the car
manufacturing industry. Hence, it is evident that differentiation is an important factor in the
concerned industry. Due to this reason the companies in the industry keep on introducing new
models with different kind of add on. The most prominent product differentiation strategy in the
car manufacturing industry is petrol vehicle and diesel vehicle. Thus, to capture the market share
and earn more profit the car manufacturing companies in the industry introduce differentiated
⊘ This is a preview!⊘
Do you want full access?
Subscribe today to unlock all pages.
Trusted by 1+ million students worldwide
9Microeconomics
and new car models in a regular interval. Therefore, this is the main reason due to which new
models of cars get introduced in the car manufacturing industry frequently. In addition, to
product differentiation the companies in the industry use advertisements proactively. One of the
primary reasons of using advertisements is promotion of product, name of company to gain
market prominence and thereby capture the market share. Other than this, advertisements also
increase the cost of entering the market and as a result, the new firms wiling to enter the industry
would face more barriers (Mauersberger & Nagel, 2018). Advertisement is also needed in the
industry because without it the differences made in the new models cannot reach the customers
and thereby the sales would not rise as the customers remain unaware of the differentiation made
in the product. Thus, advertisement makes the industry more restricted and dynamic.
Answer c
Climate has changed all over the world and is still changing but in a negative way.
Australia being a developed country has avoided many adversities in the past but is unable to
avoid the climate change. It is a global problem now and all the countries is doing something in
order to mitigate it. The main cause of climate change is the global warming (Zehr, 2016).
Global warming causes due to emission of greenhouse gases. The emission of these greenhouse
gases occurs mainly due to use of petrol and diesel cars and manufacturing of several goods.
Climate change has significant effect on the economy of the world. Due to climate change, the
temperature of the earth has significantly, that increases the frequency of drought in agricultural
sector. Consequently, the productivity of the sector decreases by significant amount. It is evident
from the drought occurred in Australia that the productivity of the concerned sector decreased by
4% in 2018-2019. Therefore, fall in farm products in Australia has contributed in the fall of
export income from agricultural products. This has direct impact on the economy of the country
Paraphrase This Document
Need a fresh take? Get an instant paraphrase of this document with our AI Paraphraser
10Microeconomics
PMC
SMC
Q1 Q
P
P1
Quantity
Price
D
as it decreases the gross domestic product of the country. Due to climate change, many places in
the world got damaged and thus tourism sector is affected. Therefore, fall in the tourism business
affects economy adversely and causes fall in income and thereby GDP of a country.
Australia is among the largest greenhouse gas emitter in the world. The use of coal is
high in the industrial sector of the country. The country is an exporter of coal. Emissions from all
the sectors have significantly contributed in the global warming, thereby climate change, and
thus it is required for the country to implement policies that would effectively alleviate the
amount of emission and mitigates the impact of climate change. The emissions can be reduced
by several effective instruments and they are tax, subsidies, limiting emission and incentives.
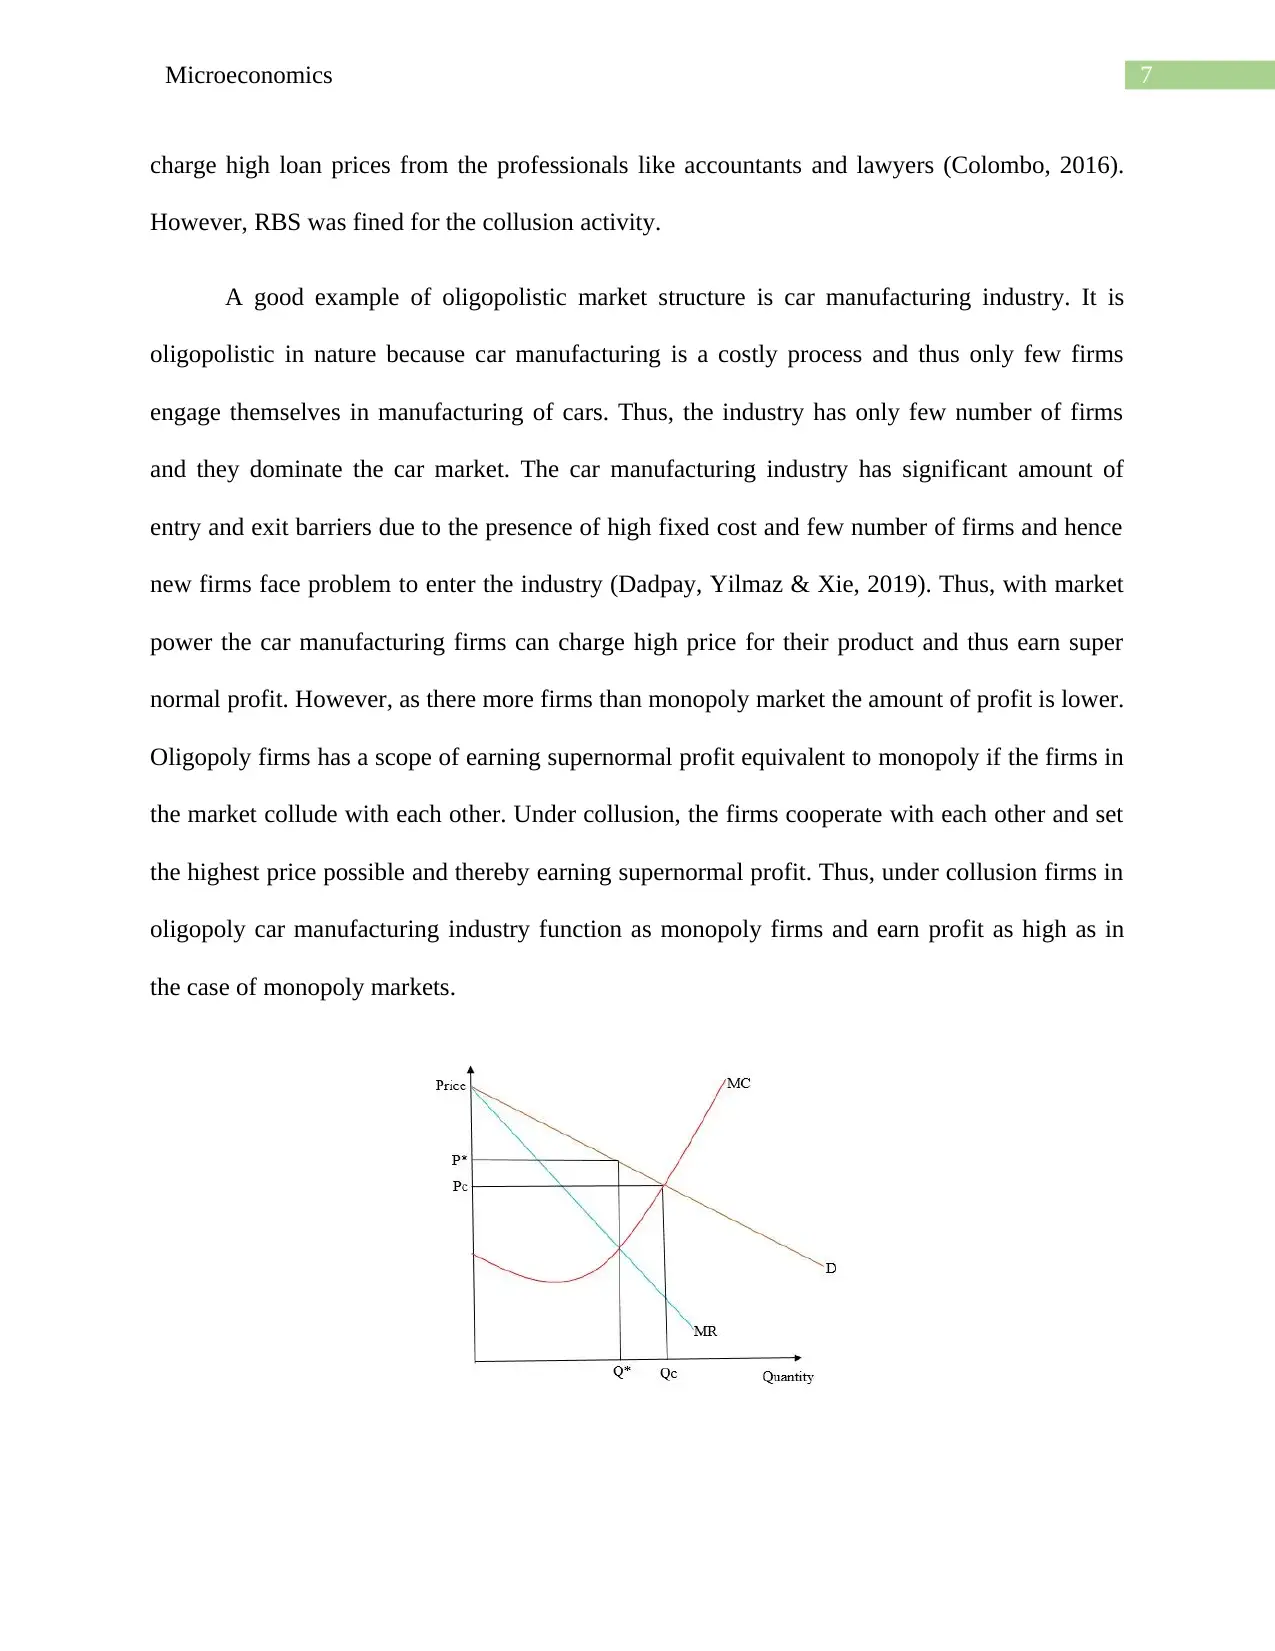
Without intervention, the economy acts as in free market scenario and thus operates at the level
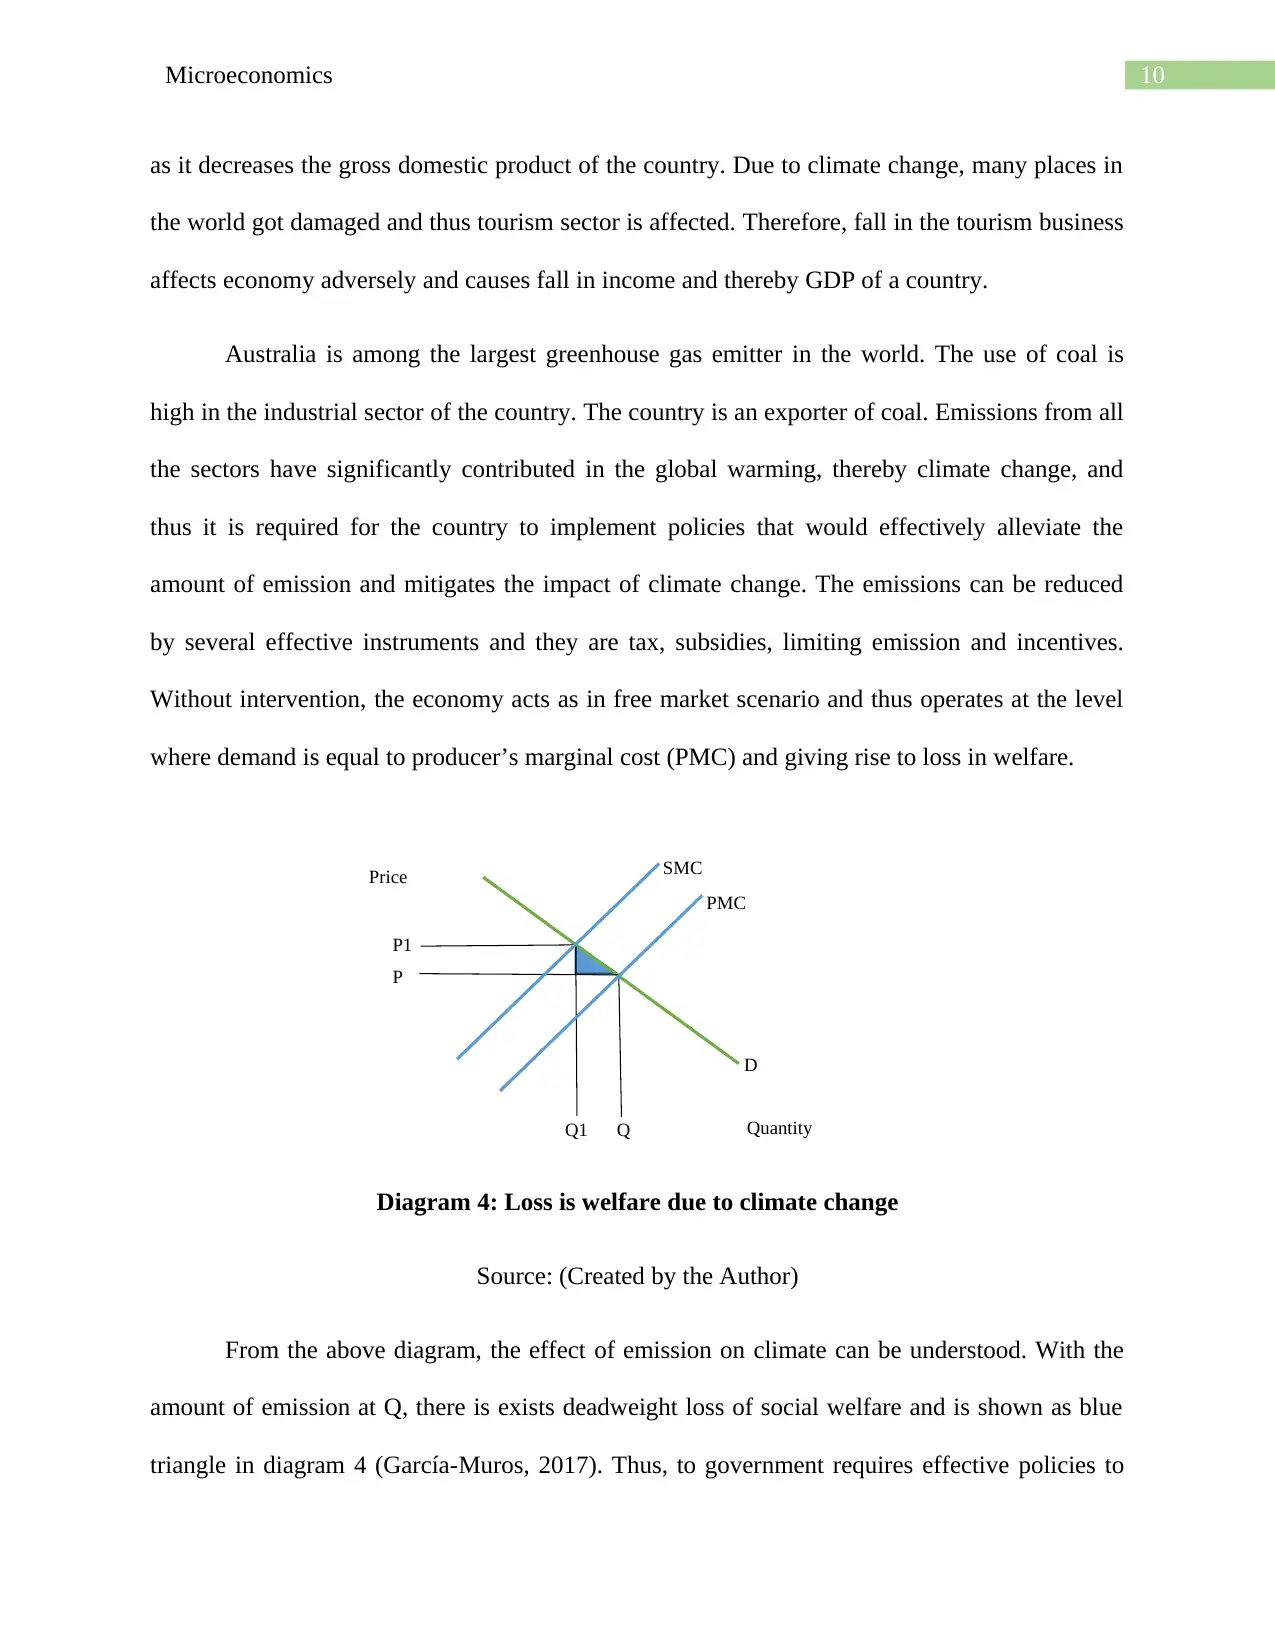
where demand is equal to producer’s marginal cost (PMC) and giving rise to loss in welfare.
Diagram 4: Loss is welfare due to climate change
Source: (Created by the Author)
From the above diagram, the effect of emission on climate can be understood. With the
amount of emission at Q, there is exists deadweight loss of social welfare and is shown as blue
triangle in diagram 4 (García-Muros, 2017). Thus, to government requires effective policies to
PMC
SMC
Q1 Q
P
P1
Quantity
Price
D
as it decreases the gross domestic product of the country. Due to climate change, many places in
the world got damaged and thus tourism sector is affected. Therefore, fall in the tourism business
affects economy adversely and causes fall in income and thereby GDP of a country.
Australia is among the largest greenhouse gas emitter in the world. The use of coal is
high in the industrial sector of the country. The country is an exporter of coal. Emissions from all
the sectors have significantly contributed in the global warming, thereby climate change, and
thus it is required for the country to implement policies that would effectively alleviate the
amount of emission and mitigates the impact of climate change. The emissions can be reduced
by several effective instruments and they are tax, subsidies, limiting emission and incentives.
Without intervention, the economy acts as in free market scenario and thus operates at the level
where demand is equal to producer’s marginal cost (PMC) and giving rise to loss in welfare.
Diagram 4: Loss is welfare due to climate change
Source: (Created by the Author)
From the above diagram, the effect of emission on climate can be understood. With the
amount of emission at Q, there is exists deadweight loss of social welfare and is shown as blue
triangle in diagram 4 (García-Muros, 2017). Thus, to government requires effective policies to
11Microeconomics
reduce the amount of emission to Q1, which is socially desirable. The government of Australia
thus introduced sector specific policies but all the policies are of subsidy and incentive oriented.
All the policies are under Emission Reduction Fund (BBC News, 2020). The companies that
would use newer technology that reduces emission will be provided subsidy on purchase
machine or equipment. The government is implementing this policy through Australian
Renewable Energy Agency (ARENA) and Clean Energy Finance Corporation (CEFC). The
government of Australia has discounted the users of cars that emits less and the users of electric
vehicles. In order to reduce the amount of emission of greenhouse gases the government has
provided many benefits to the agricultural sector such as grants and research development funds.
Further, the policies has not found to be as effective as required and it can be supported
by the evident on the change in amount of emission in the country has not reduced significantly
and only achieved 16% of its actual target of emission reduction . Thus, the country has been
ranked 57 in emission reduction in the world (The Guardian, 2020). Considering, the fact the
government of Australia has revised their target for 2030. However, the country will keep on
using the ERF policy as the mother of the all policies and it would reduce the emission by 26%
to 28%. Therefore, from the above discussion it is clear that he ERF policy is not working for
Australia and thus it should focus on some other polices that might be more effective than the
current policy are carbon tax policy and tradable permit policy (Aph.gov.au, 2020). The
solutions that Australia have used are all incentive based and policies that penalizes directly the
firms or individual that causes the emission is not in the list of the government of Australia.
Therefore, it would be better for the country if it considers other policies as well and implement
to attain the target of emission reduction of 2030. Those would possibly be more effective as
they directly penalizes the both the firms and individuals and as a result there would be fall in
⊘ This is a preview!⊘
Do you want full access?
Subscribe today to unlock all pages.
Trusted by 1+ million students worldwide
1 out of 18
Related Documents


Your All-in-One AI-Powered Toolkit for Academic Success.
+13062052269
info@desklib.com
Available 24*7 on WhatsApp / Email
![[object Object]](/_next/static/media/star-bottom.7253800d.svg)
Unlock your academic potential
Copyright © 2020–2026 A2Z Services. All Rights Reserved. Developed and managed by ZUCOL.