Deakin University: Economics for Managers - MPE781 Assignment Solution
VerifiedAdded on 2022/10/06
|19
|4156
|5
Homework Assignment
AI Summary
This economics assignment analyzes the issue of road congestion in Australia, referencing a report by the Australian Automobile Association. The assignment explores the causes and consequences of traffic congestion, including its impact on economic costs, environmental degradation, and quality of life. It then delves into economic concepts such as supply and demand in a competitive market, and how road space can be considered a public good, leading to excess demand when provided freely. The solution discusses the impact of taxes on fuel and cars as a potential solution to reduce congestion, and the implications of building more roads. Finally, the assignment touches upon road pricing systems, examining their effectiveness in managing traffic congestion and reducing environmental impacts. The analysis incorporates diagrams and examples to illustrate economic principles and real-world applications, providing a comprehensive overview of the topic.
Running head: ECONOMICS
Economics
Name of the Student:
Name of the University:
Author note:
Economics
Name of the Student:
Name of the University:
Author note:
Paraphrase This Document
Need a fresh take? Get an instant paraphrase of this document with our AI Paraphraser

1ECONOMICS
Table of Contents
Answer to Question 1......................................................................................................................2
Answer to Question 2......................................................................................................................5
Answer to Question 3....................................................................................................................10
Answer to Question 4....................................................................................................................14
References......................................................................................................................................16
2ECONOMICS
Answer to Question 1
Summary of “Road Congestion in Australia”
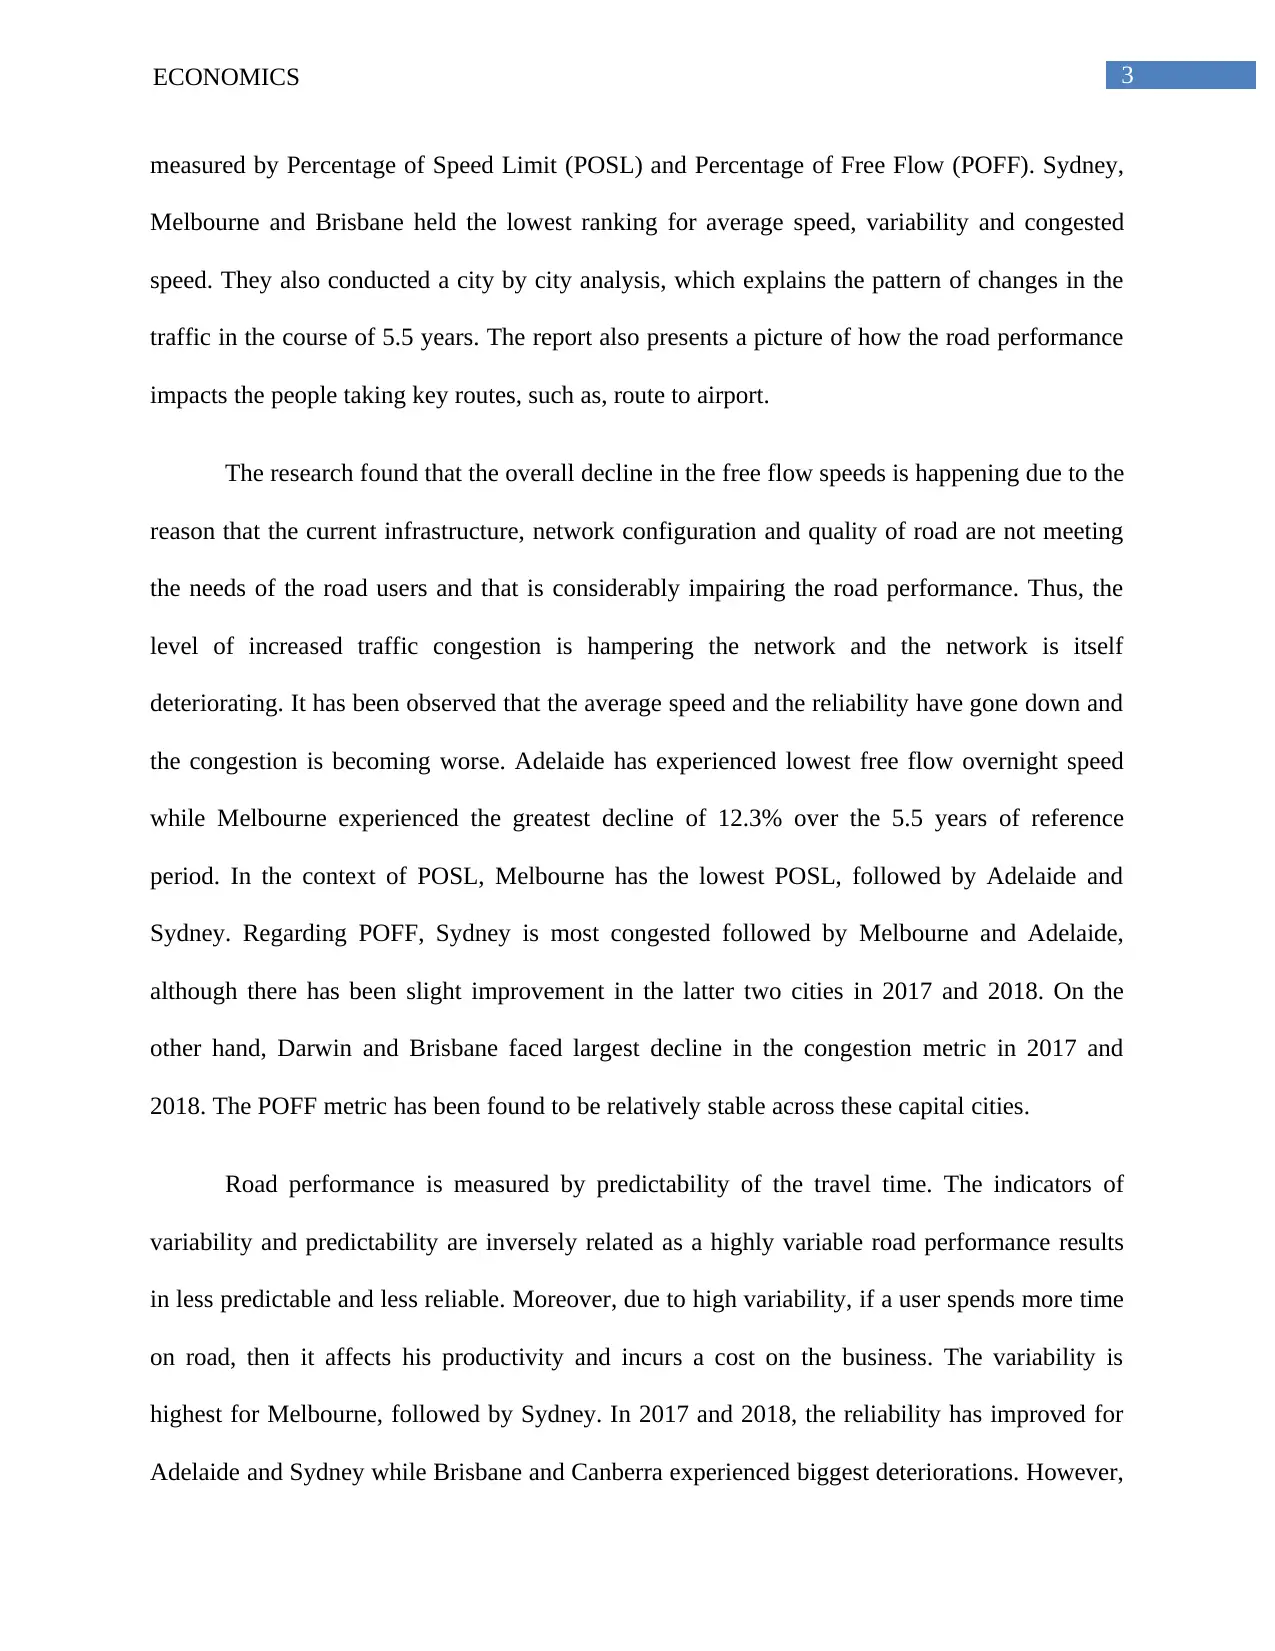
The article ‘Road Congestion in Australia’ is published by Australian Automobile
Association in 2018. The report presents an overview of the traffic condition on the Australian
roads in the reference period of 5.5 years, from January 1, 2013 to June 30, 2018. It discusses
how the traffic congestion in Australia has increased and has been contributing in the
environmental degradation and increasing costs for the economy. The aim of this report is to help
the government to design solution to the congestion problem by presenting the facts about the
issue in a summarized manner.
It has been seen that the traffic congestion increased in the capital cities due to a
significant fall in the average driving speeds, such as, it fell by 3.6% in Sydney, 3.7% in
Brisbane and maximum in Melbourne, 8.2%. Traffic jams are bad for the economic health as
well as environment of a nation. As people are stuck in traffic for more time, the quality of life
falls due to increased emission and pollution and loss of valuable time, costs of business
increases and productivity decreases. The increased business costs are passed onto the consumers
and cost of living increases. According to the Bureau of Infrastructure, Transport and Regional
Economics, in 2015, the congestion cost was A$16.5 billion. If policies are not changed to curtail
the congestion, the costs are estimated to go up to A$27.7 billion to A$37.3 billion by 2030.
The Australian Automobile Association measured three indicators, namely, average
speed, congested speed (% of free flow) and variability in all the major cities of Australia, such
as, Darwin, Perth, Sydney, Canberra, Melbourne, Adelaide, Hobart, and Brisbane, and produced
the rankings of these cities as per the three indicators mentioned above. The congested speed is
Answer to Question 1
Summary of “Road Congestion in Australia”
The article ‘Road Congestion in Australia’ is published by Australian Automobile
Association in 2018. The report presents an overview of the traffic condition on the Australian
roads in the reference period of 5.5 years, from January 1, 2013 to June 30, 2018. It discusses
how the traffic congestion in Australia has increased and has been contributing in the
environmental degradation and increasing costs for the economy. The aim of this report is to help
the government to design solution to the congestion problem by presenting the facts about the
issue in a summarized manner.
It has been seen that the traffic congestion increased in the capital cities due to a
significant fall in the average driving speeds, such as, it fell by 3.6% in Sydney, 3.7% in
Brisbane and maximum in Melbourne, 8.2%. Traffic jams are bad for the economic health as
well as environment of a nation. As people are stuck in traffic for more time, the quality of life
falls due to increased emission and pollution and loss of valuable time, costs of business
increases and productivity decreases. The increased business costs are passed onto the consumers
and cost of living increases. According to the Bureau of Infrastructure, Transport and Regional
Economics, in 2015, the congestion cost was A$16.5 billion. If policies are not changed to curtail
the congestion, the costs are estimated to go up to A$27.7 billion to A$37.3 billion by 2030.
The Australian Automobile Association measured three indicators, namely, average
speed, congested speed (% of free flow) and variability in all the major cities of Australia, such
as, Darwin, Perth, Sydney, Canberra, Melbourne, Adelaide, Hobart, and Brisbane, and produced
the rankings of these cities as per the three indicators mentioned above. The congested speed is
⊘ This is a preview!⊘
Do you want full access?
Subscribe today to unlock all pages.
Trusted by 1+ million students worldwide
3ECONOMICS
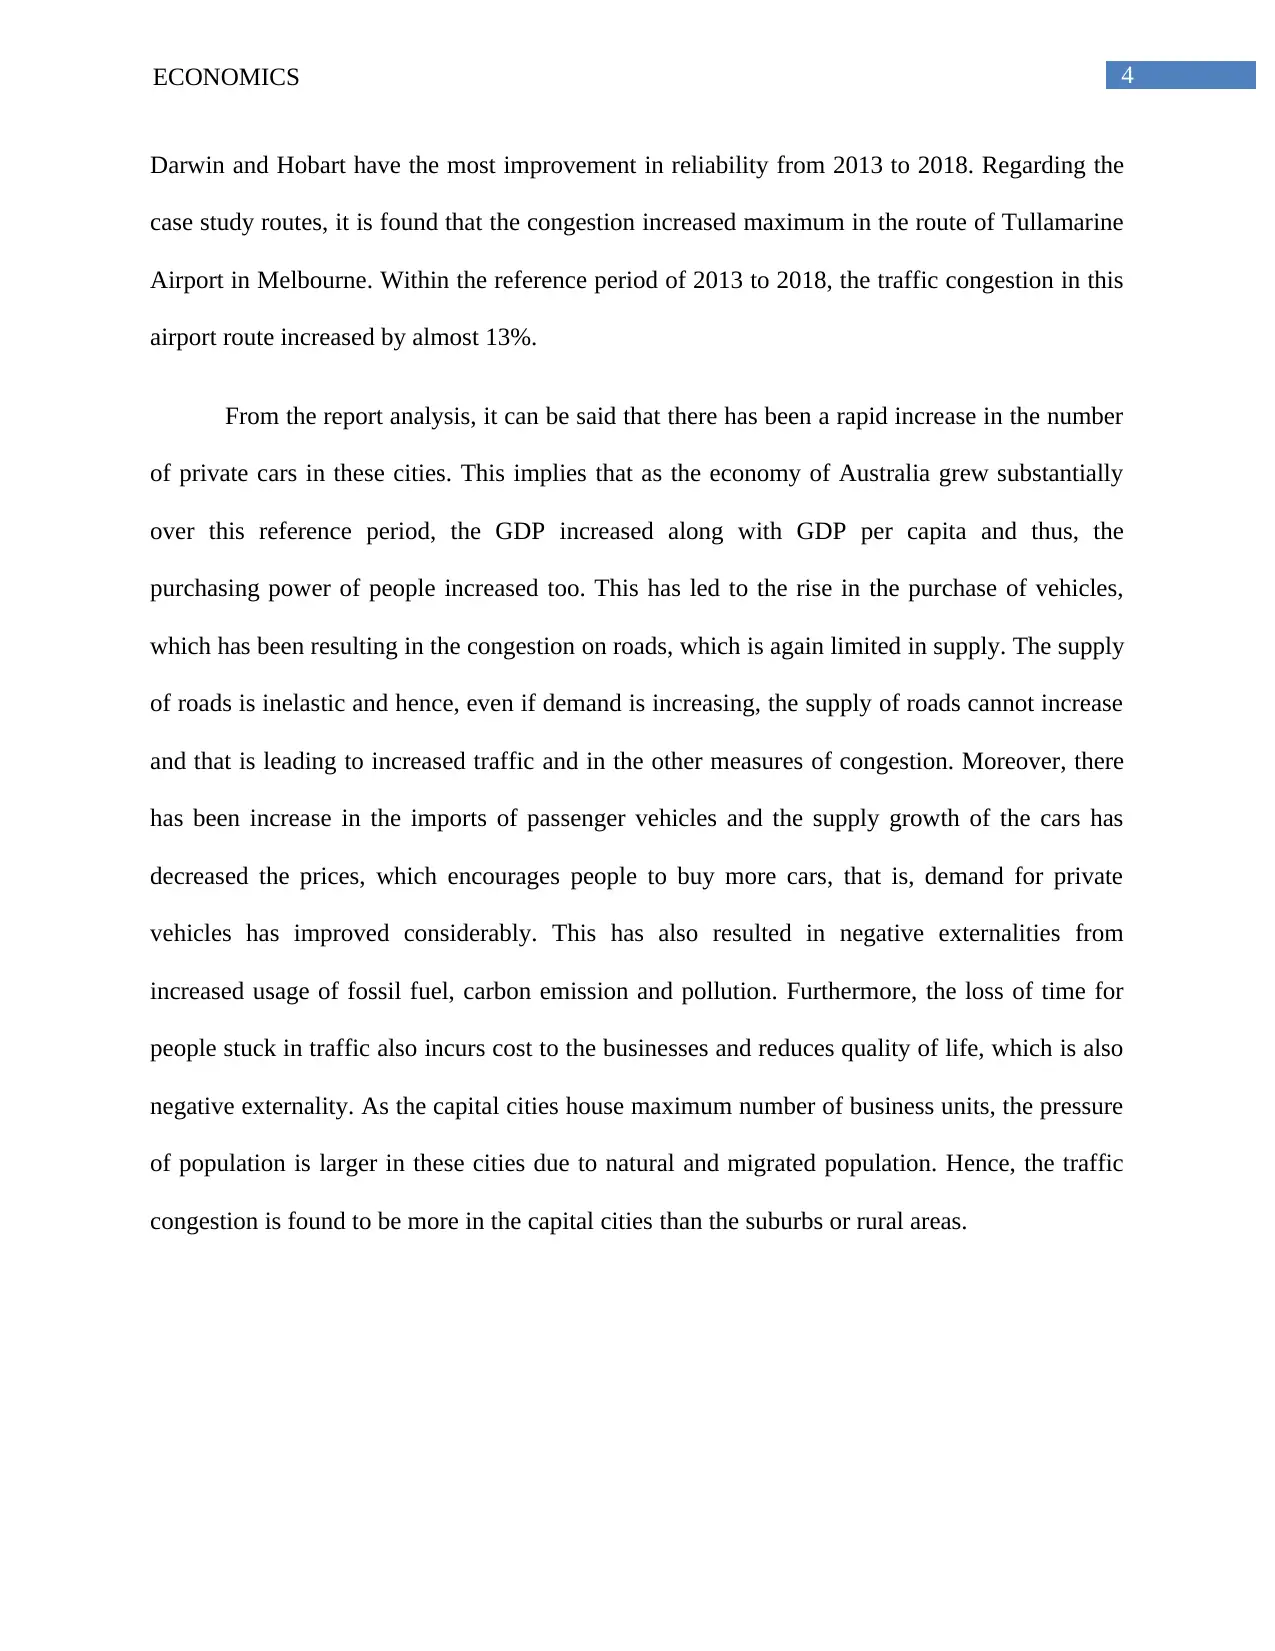
measured by Percentage of Speed Limit (POSL) and Percentage of Free Flow (POFF). Sydney,
Melbourne and Brisbane held the lowest ranking for average speed, variability and congested
speed. They also conducted a city by city analysis, which explains the pattern of changes in the
traffic in the course of 5.5 years. The report also presents a picture of how the road performance
impacts the people taking key routes, such as, route to airport.
The research found that the overall decline in the free flow speeds is happening due to the
reason that the current infrastructure, network configuration and quality of road are not meeting
the needs of the road users and that is considerably impairing the road performance. Thus, the
level of increased traffic congestion is hampering the network and the network is itself
deteriorating. It has been observed that the average speed and the reliability have gone down and
the congestion is becoming worse. Adelaide has experienced lowest free flow overnight speed
while Melbourne experienced the greatest decline of 12.3% over the 5.5 years of reference
period. In the context of POSL, Melbourne has the lowest POSL, followed by Adelaide and
Sydney. Regarding POFF, Sydney is most congested followed by Melbourne and Adelaide,
although there has been slight improvement in the latter two cities in 2017 and 2018. On the
other hand, Darwin and Brisbane faced largest decline in the congestion metric in 2017 and
2018. The POFF metric has been found to be relatively stable across these capital cities.
Road performance is measured by predictability of the travel time. The indicators of
variability and predictability are inversely related as a highly variable road performance results
in less predictable and less reliable. Moreover, due to high variability, if a user spends more time
on road, then it affects his productivity and incurs a cost on the business. The variability is
highest for Melbourne, followed by Sydney. In 2017 and 2018, the reliability has improved for
Adelaide and Sydney while Brisbane and Canberra experienced biggest deteriorations. However,
Paraphrase This Document
Need a fresh take? Get an instant paraphrase of this document with our AI Paraphraser
4ECONOMICS
Darwin and Hobart have the most improvement in reliability from 2013 to 2018. Regarding the
case study routes, it is found that the congestion increased maximum in the route of Tullamarine
Airport in Melbourne. Within the reference period of 2013 to 2018, the traffic congestion in this
airport route increased by almost 13%.
From the report analysis, it can be said that there has been a rapid increase in the number
of private cars in these cities. This implies that as the economy of Australia grew substantially
over this reference period, the GDP increased along with GDP per capita and thus, the
purchasing power of people increased too. This has led to the rise in the purchase of vehicles,
which has been resulting in the congestion on roads, which is again limited in supply. The supply
of roads is inelastic and hence, even if demand is increasing, the supply of roads cannot increase
and that is leading to increased traffic and in the other measures of congestion. Moreover, there
has been increase in the imports of passenger vehicles and the supply growth of the cars has
decreased the prices, which encourages people to buy more cars, that is, demand for private
vehicles has improved considerably. This has also resulted in negative externalities from
increased usage of fossil fuel, carbon emission and pollution. Furthermore, the loss of time for
people stuck in traffic also incurs cost to the businesses and reduces quality of life, which is also
negative externality. As the capital cities house maximum number of business units, the pressure
of population is larger in these cities due to natural and migrated population. Hence, the traffic
congestion is found to be more in the capital cities than the suburbs or rural areas.
5ECONOMICS
D2
S
P1
P2
D1
Quantity of road space
Price of road space
Q*
Answer to Question 2
Answer (a)
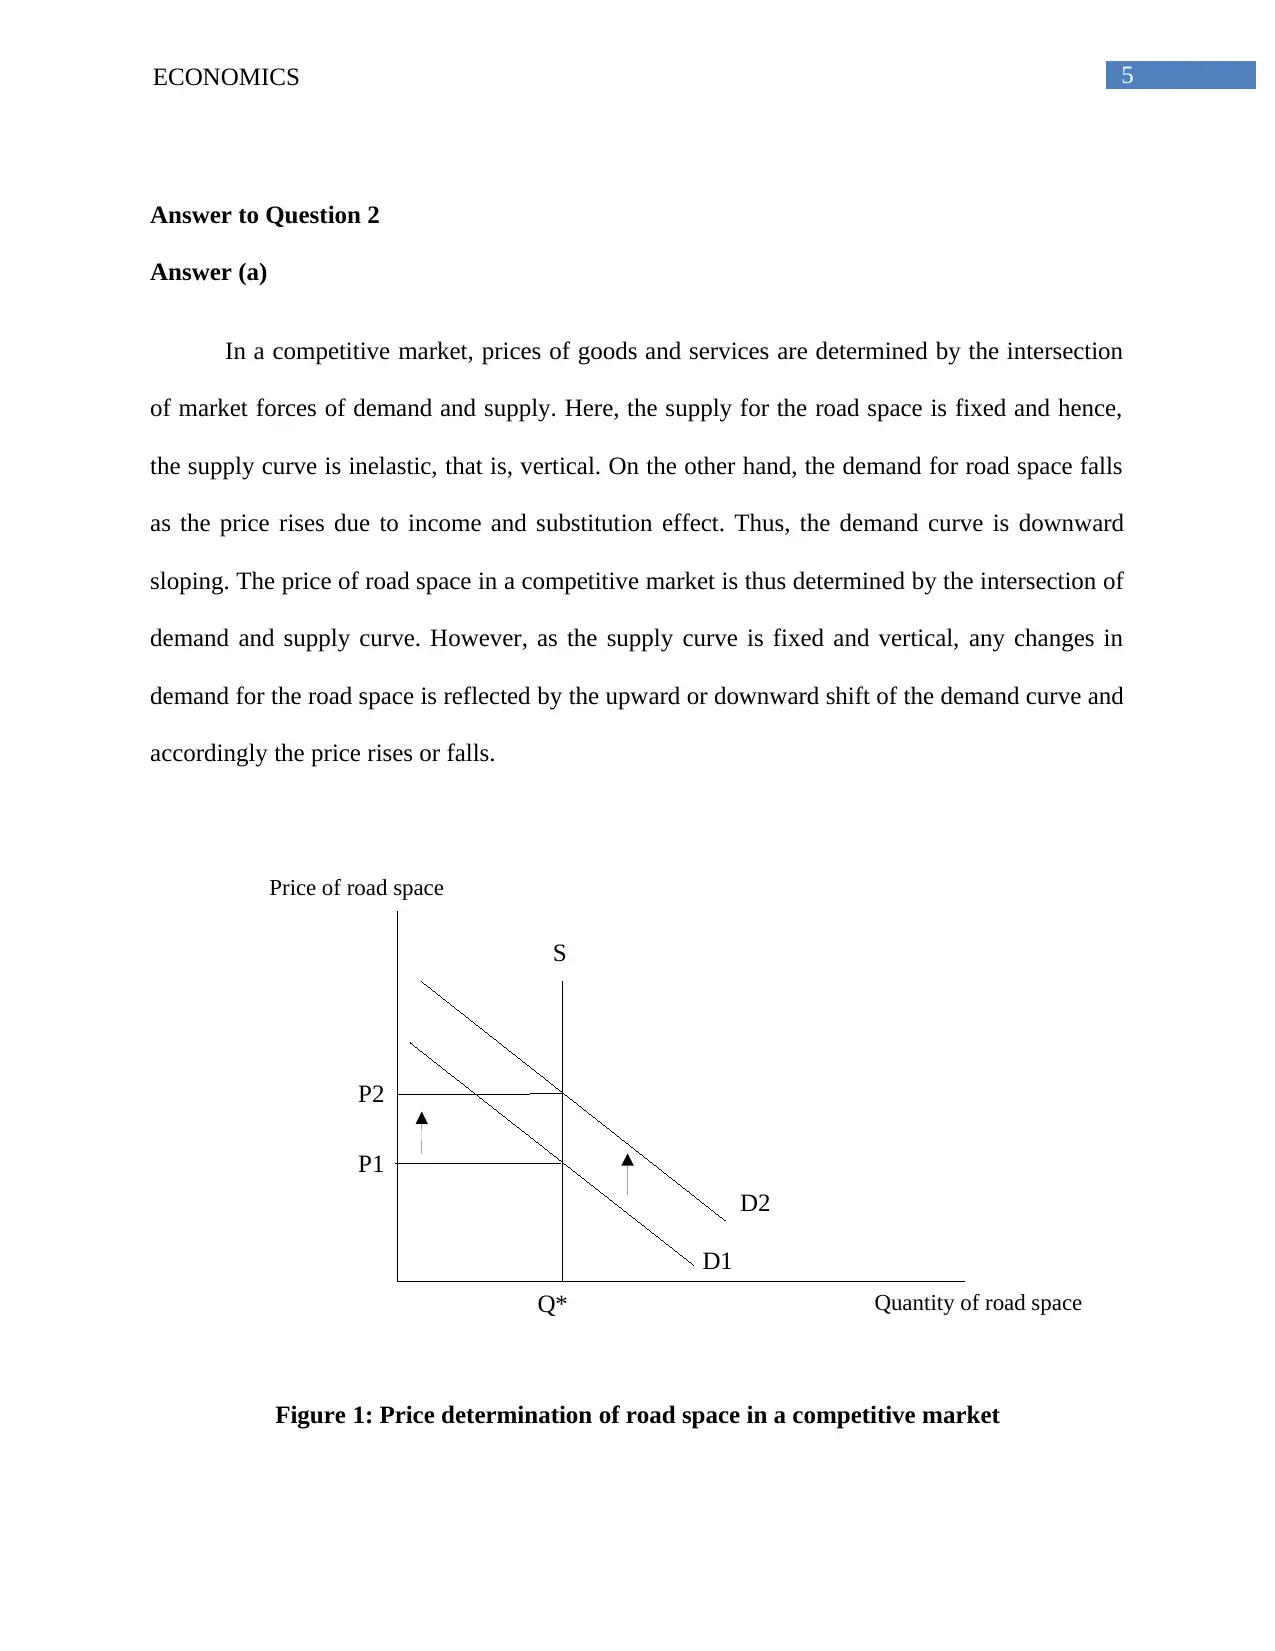
In a competitive market, prices of goods and services are determined by the intersection
of market forces of demand and supply. Here, the supply for the road space is fixed and hence,
the supply curve is inelastic, that is, vertical. On the other hand, the demand for road space falls
as the price rises due to income and substitution effect. Thus, the demand curve is downward
sloping. The price of road space in a competitive market is thus determined by the intersection of
demand and supply curve. However, as the supply curve is fixed and vertical, any changes in
demand for the road space is reflected by the upward or downward shift of the demand curve and
accordingly the price rises or falls.
Figure 1: Price determination of road space in a competitive market
D2
S
P1
P2
D1
Quantity of road space
Price of road space
Q*
Answer to Question 2
Answer (a)
In a competitive market, prices of goods and services are determined by the intersection
of market forces of demand and supply. Here, the supply for the road space is fixed and hence,
the supply curve is inelastic, that is, vertical. On the other hand, the demand for road space falls
as the price rises due to income and substitution effect. Thus, the demand curve is downward
sloping. The price of road space in a competitive market is thus determined by the intersection of
demand and supply curve. However, as the supply curve is fixed and vertical, any changes in
demand for the road space is reflected by the upward or downward shift of the demand curve and
accordingly the price rises or falls.
Figure 1: Price determination of road space in a competitive market
⊘ This is a preview!⊘
Do you want full access?
Subscribe today to unlock all pages.
Trusted by 1+ million students worldwide
6ECONOMICS
Q*
S
P*
P1
D
Quantity of road space
Price of road space
0
E
Excess demand for road space
Answer (b)
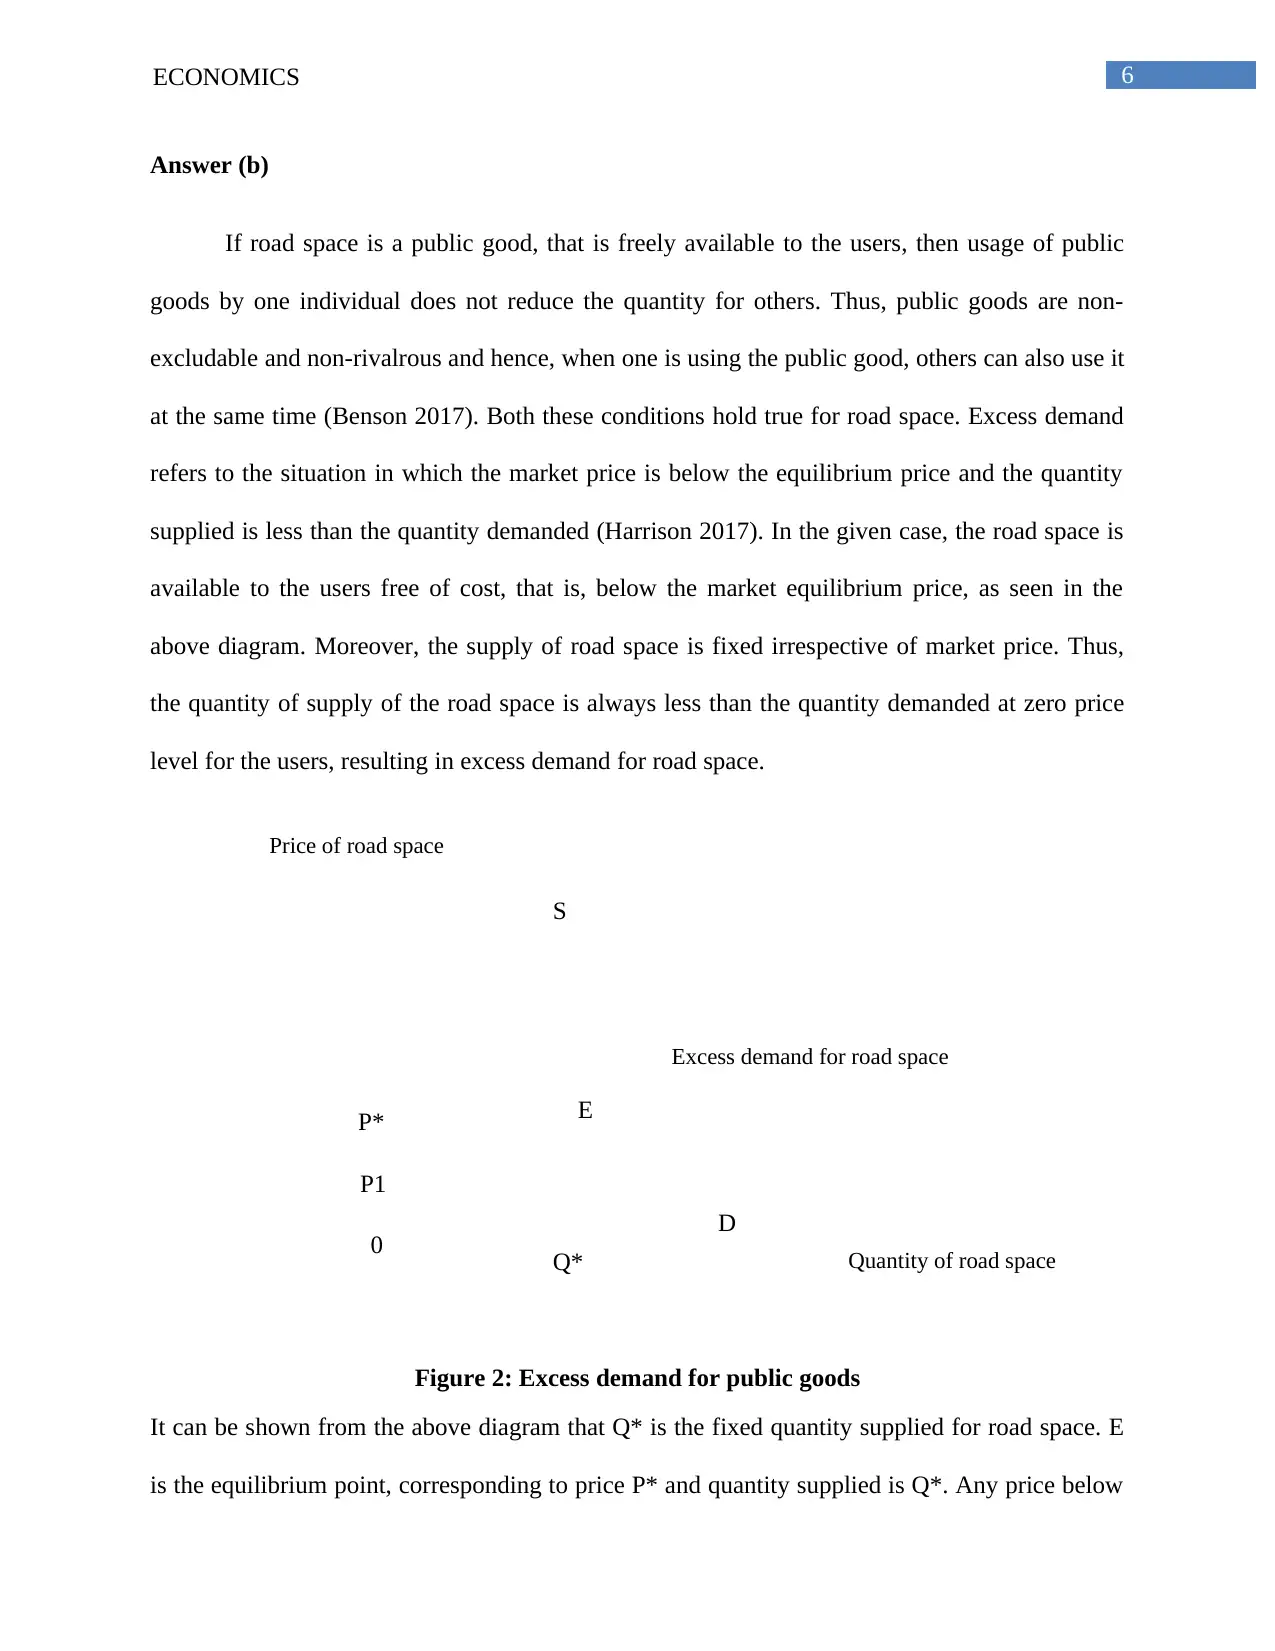
If road space is a public good, that is freely available to the users, then usage of public
goods by one individual does not reduce the quantity for others. Thus, public goods are non-
excludable and non-rivalrous and hence, when one is using the public good, others can also use it
at the same time (Benson 2017). Both these conditions hold true for road space. Excess demand
refers to the situation in which the market price is below the equilibrium price and the quantity
supplied is less than the quantity demanded (Harrison 2017). In the given case, the road space is
available to the users free of cost, that is, below the market equilibrium price, as seen in the
above diagram. Moreover, the supply of road space is fixed irrespective of market price. Thus,
the quantity of supply of the road space is always less than the quantity demanded at zero price
level for the users, resulting in excess demand for road space.
Figure 2: Excess demand for public goods
It can be shown from the above diagram that Q* is the fixed quantity supplied for road space. E
is the equilibrium point, corresponding to price P* and quantity supplied is Q*. Any price below
Q*
S
P*
P1
D
Quantity of road space
Price of road space
0
E
Excess demand for road space
Answer (b)
If road space is a public good, that is freely available to the users, then usage of public
goods by one individual does not reduce the quantity for others. Thus, public goods are non-
excludable and non-rivalrous and hence, when one is using the public good, others can also use it
at the same time (Benson 2017). Both these conditions hold true for road space. Excess demand
refers to the situation in which the market price is below the equilibrium price and the quantity
supplied is less than the quantity demanded (Harrison 2017). In the given case, the road space is
available to the users free of cost, that is, below the market equilibrium price, as seen in the
above diagram. Moreover, the supply of road space is fixed irrespective of market price. Thus,
the quantity of supply of the road space is always less than the quantity demanded at zero price
level for the users, resulting in excess demand for road space.
Figure 2: Excess demand for public goods
It can be shown from the above diagram that Q* is the fixed quantity supplied for road space. E
is the equilibrium point, corresponding to price P* and quantity supplied is Q*. Any price below
Paraphrase This Document
Need a fresh take? Get an instant paraphrase of this document with our AI Paraphraser
7ECONOMICS
the equilibrium price P* results in excess demand for road space as the quantity supplied remains
fixed, but demand increases due to low price. It is shown by the area EQ*D. Hence, at price level
0, there is excess demand for road space in the market.
Answer (c)
Taxes are imposed by the government to earn revenue. Imposition of tax on any goods or
services increases its price. In the given case study, amount of road space and its excess demand
cannot be measured by specific units. As the road space is a public good and available free of
cost, thus, the excess demand is reflected through increase number of vehicles and congestion on
road. Thus, road congestion is measured by excess demand of road space. However, imposition
of taxes on road space is not possible, hence, to mitigate the incidence of road congestion, taxes
can be imposed on the fuel and cars. This measure will increase the price of fuel and cars
respectively by the amount of tax imposed. Increased prices for the cars as well as for the fuel
reduce the demand for private vehicles and the road congestion will decrease (Enami, Lustig and
Aranda 2017).
8ECONOMICS
D1
S
P*
P1
D
Quantity of road space
Price of road space
Q*
T
Tax revenue from fuel and cars, collected by the government
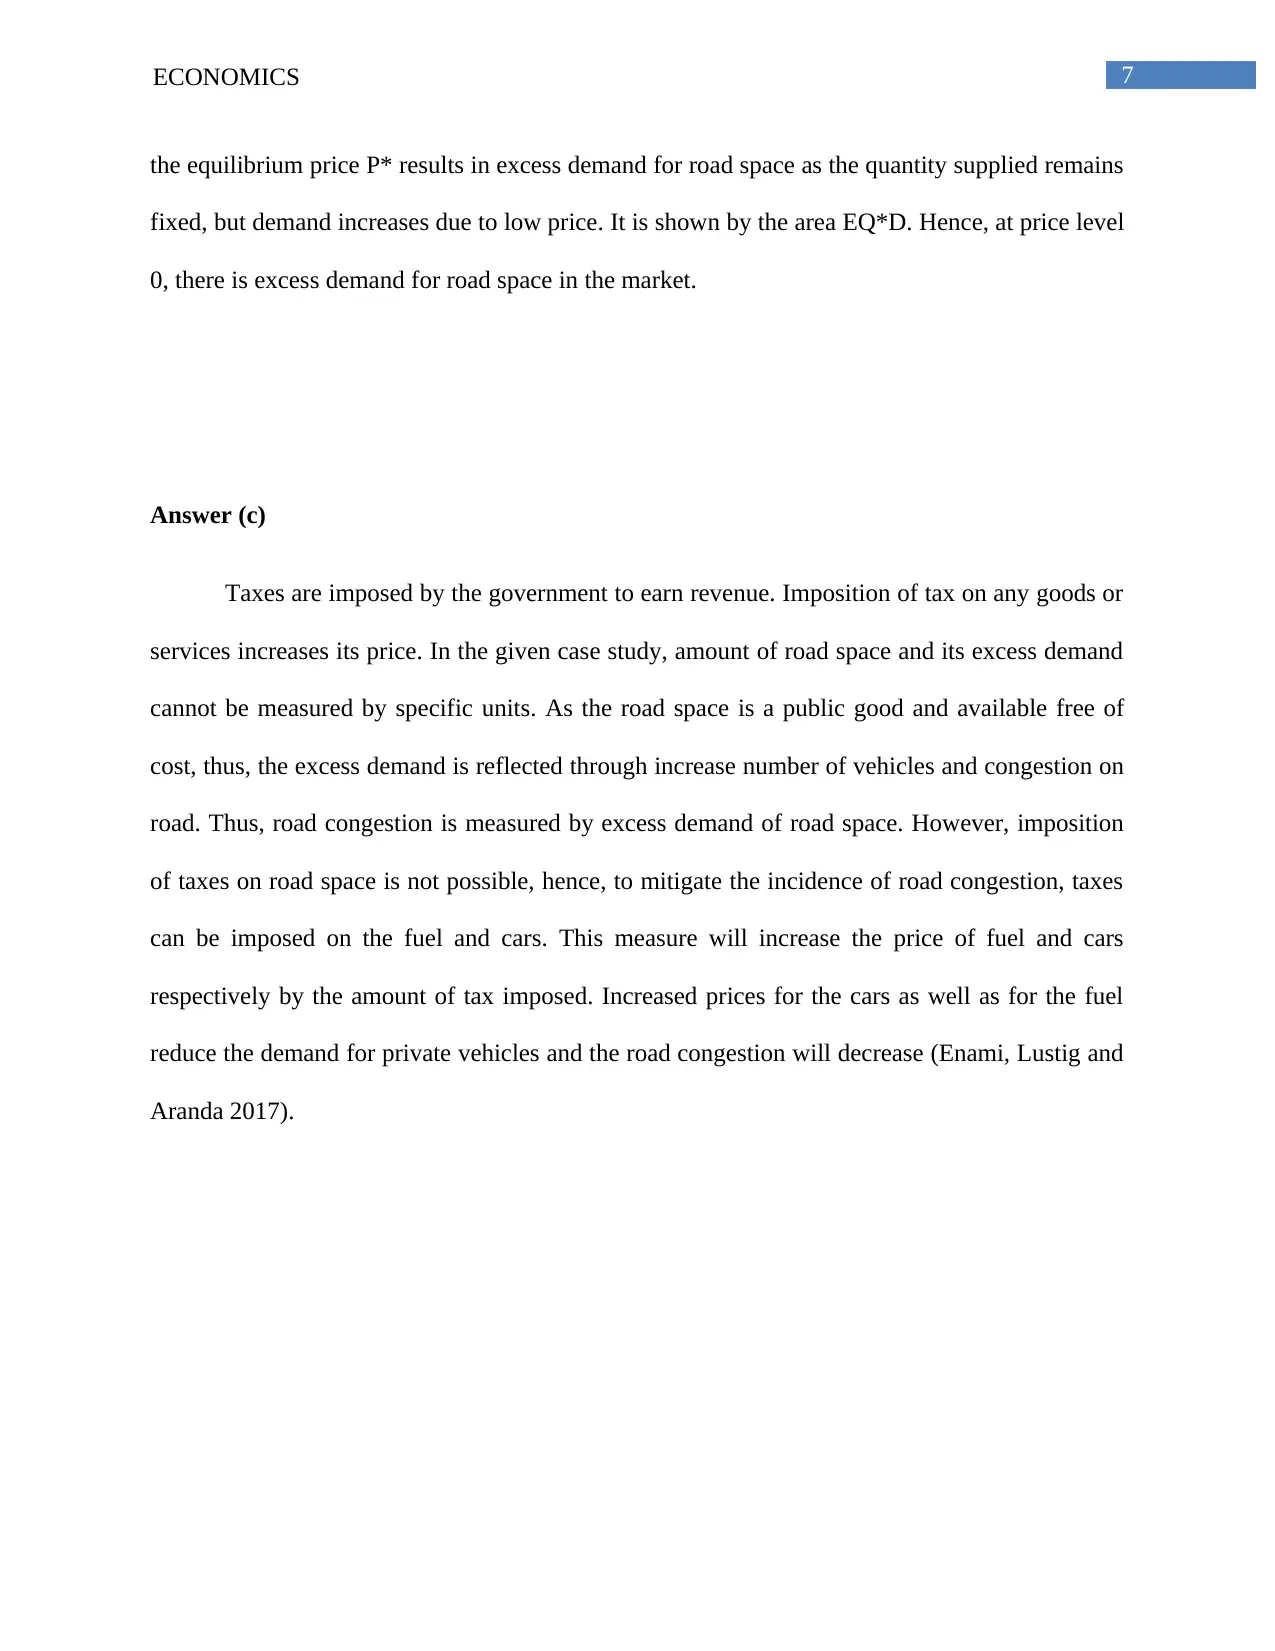
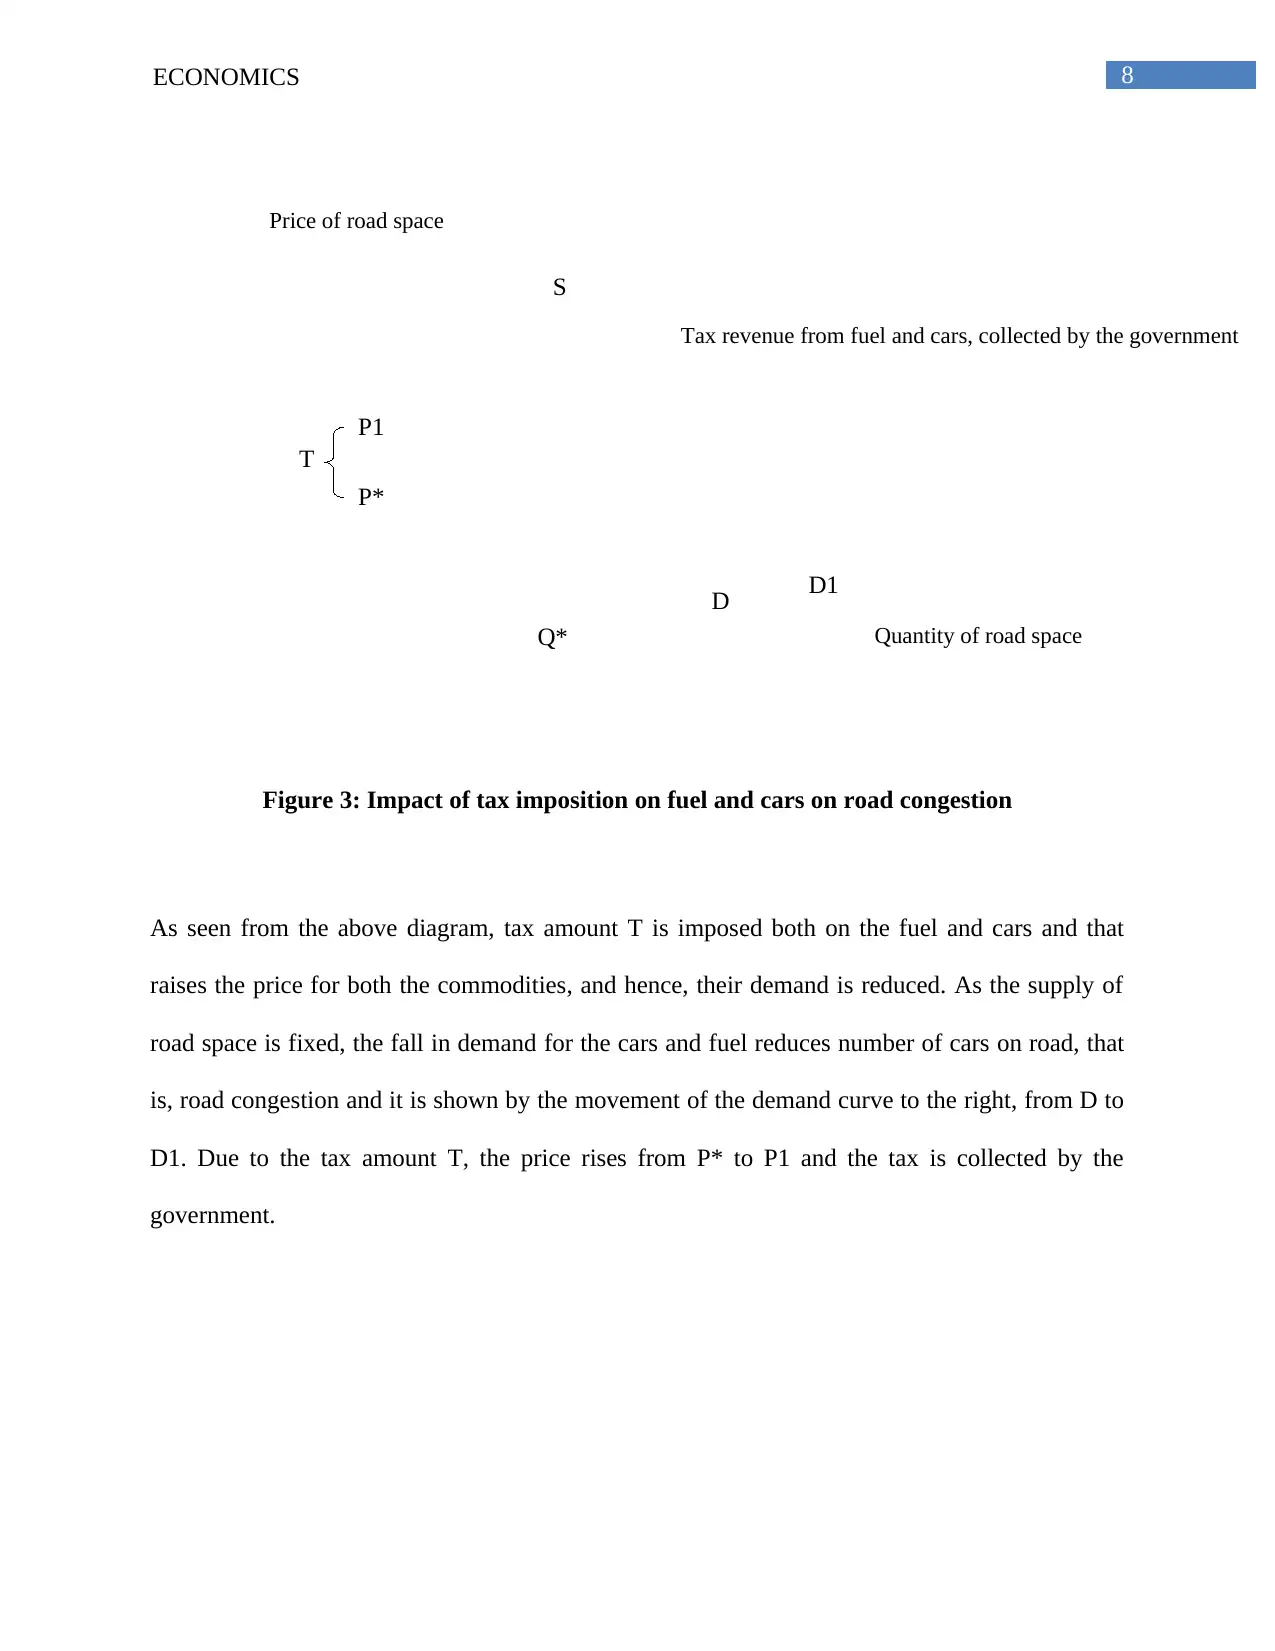
Figure 3: Impact of tax imposition on fuel and cars on road congestion
As seen from the above diagram, tax amount T is imposed both on the fuel and cars and that
raises the price for both the commodities, and hence, their demand is reduced. As the supply of
road space is fixed, the fall in demand for the cars and fuel reduces number of cars on road, that
is, road congestion and it is shown by the movement of the demand curve to the right, from D to
D1. Due to the tax amount T, the price rises from P* to P1 and the tax is collected by the
government.
D1
S
P*
P1
D
Quantity of road space
Price of road space
Q*
T
Tax revenue from fuel and cars, collected by the government
Figure 3: Impact of tax imposition on fuel and cars on road congestion
As seen from the above diagram, tax amount T is imposed both on the fuel and cars and that
raises the price for both the commodities, and hence, their demand is reduced. As the supply of
road space is fixed, the fall in demand for the cars and fuel reduces number of cars on road, that
is, road congestion and it is shown by the movement of the demand curve to the right, from D to
D1. Due to the tax amount T, the price rises from P* to P1 and the tax is collected by the
government.
⊘ This is a preview!⊘
Do you want full access?
Subscribe today to unlock all pages.
Trusted by 1+ million students worldwide
9ECONOMICS
Answer (d)
Building more roads implies increase in supply of roads, and it might reduce congestion
on roads. If the demand for cars and their usage remain unchanged then increase in the road
supply will reduce congestion on road. This is termed as induced demand or generated demand.
Increasing road traffic capacity is known as induced traffic. Road space is a public good and is
already free for the individuals, hence increase in the supply of road space will distribute the
unchanged number of cars on the new roads and is expected to reduce congestion.
On the other hand, due to induced demand, with increased supply of roads, the demand
for cars will increase further and the individuals will be encouraged to drive more. The new road
space will attract more cars on road and the impact on road congestion will be mitigated.
Paraphrase This Document
Need a fresh take? Get an instant paraphrase of this document with our AI Paraphraser
10ECONOMICS
Answer to Question 3
Road pricing system is now-a-days being adopted by many countries to reduce the traffic
congestion on road, as well as reduce the environmental impact of carbon emission. As stated by
Saleh and Sammer (2016), road charges are the direct charges which are levied by the
government for the use of roads. Examples of road pricing are the toll taxes for availing a new
highway or a new bridge etc., time or distance based fees, congestion charges or charges
imposed for discouraging the usage of certain types of vehicles generating pollutions or fuel
sources (van Wee et al. 2014). These types of road pricing are used for revenue generation for
the government, and these revenues are primarily used in infrastructure development and also for
transportation demand management to reduce the peak hour travel rush and congestion. The road
pricing system is most prominent in the toll tunnels, toll roads and toll bridges (Pronello and
Rappazzo 2014). The road pricing system is effective in many developed countries, such as,
Singapore’s Electronic Road Pricing, London’s congestion charge, Stockholm’s congestion tax,
Ecopass, Milan Area C and Gothenburg congestion tax (Bouchelaghem and Omar 2018).
Congestion charge or congestion pricing also comes under road pricing system. As stated by
Cavallaro, Giaretta and Nocera (2018), the purpose of congestion charge is to establish a system
of surcharging the users of the public goods which are subject to congestion due to excess
demand and thereby these help to regulate demand without increasing the actual supply of the
good.
The advantages of road pricing system are:
It discourages people to own and use more private vehicles. It is often found that single
families own more than one car and this adds up to the pollution level.
11ECONOMICS
More number of private vehicles increases congestion on road and affect the mobility in
the urban areas. The government and transport departments of many countries are
providing efficient, reliable and affordable public transport to encourage people to use the
public transport than using individual private cars. This would reduce congestion on road
and increase mobility. The revenue collected through road pricing system is used for the
infrastructural development (Santos 2019).
Congestion charges discourage people to use more private cars and thus, the number of
accidents gets reduced too. Thus, road safety increases along with quality of life.
Increase in the mobility of people ensures that less amount of valuable time is lost during
travel to and from office. Hence, it leads to increase in the productivity of the people,
which is reflected in their performance. Hence, Bouchelaghem and Omar (2018) argued
that congestion tax can act as a river of growth for the economies.
A major positive argument for the road pricing system is the reduction in the pollution
level. Charges for congestion or any other road pricing system will ensure a regulated
growth of demand for the private vehicles and reduction in the number of cars on road
also ensures decrease in carbon emission and pollution (Solé-Ribalta, Gómez and Arenas
2018).
There are some disadvantages of road pricing system also:
Milenković, Glavić and Mladenović (2018) argued that these types of taxes are vertically
inequitable and regressive in nature. The richer people pay a lower percentage of their
income as congestion charge or tax while people will lower income pay a higher
proportion of their income, and this makes the system highly inequitable and it promotes
social inequality, which is not desired for balanced growth of the economy.
⊘ This is a preview!⊘
Do you want full access?
Subscribe today to unlock all pages.
Trusted by 1+ million students worldwide
1 out of 19
Related Documents


Your All-in-One AI-Powered Toolkit for Academic Success.
+13062052269
info@desklib.com
Available 24*7 on WhatsApp / Email
![[object Object]](/_next/static/media/star-bottom.7253800d.svg)
Unlock your academic potential
Copyright © 2020–2026 A2Z Services. All Rights Reserved. Developed and managed by ZUCOL.