MBA Economics Assignment - Semester 1, University Name
VerifiedAdded on 2021/11/19
|27
|5204
|103
Homework Assignment
AI Summary
This MBA economics assignment delves into microeconomic principles, analyzing various market scenarios using supply and demand frameworks. The assignment explores how changes in factors such as journalist salaries, news events, the popularity of products like T-shirts and bagels, and textbook requirements affect market equilibrium. It examines perfectly competitive markets, outlining their characteristics and providing examples. Furthermore, the assignment investigates the labor market, explaining the point at which a firm stops hiring workers based on marginal cost and marginal revenue product. The analysis includes graphical representations to illustrate these economic concepts, offering a comprehensive understanding of market dynamics and firm behavior.

Running head: ECONOMICS ASSIGNMENT MBA
Economics assignment MBA
Name of the student
Name of the University
Author Note
Economics assignment MBA
Name of the student
Name of the University
Author Note
Paraphrase This Document
Need a fresh take? Get an instant paraphrase of this document with our AI Paraphraser
1ECONOMICS ASSIGNMENT MBA
Table of Contents
SECTION “A”...........................................................................................................................2
Answer 1:...................................................................................................................................2
Answer 2:.................................................................................................................................10
Answer 3:.................................................................................................................................12
Answer 4:.................................................................................................................................13
Answer 5:.................................................................................................................................15
SECTION “B”..........................................................................................................................17
Answer 1..................................................................................................................................17
Answer 2..................................................................................................................................22
References:...............................................................................................................................24
2
S0
S1
D
Price of Newspaper
O
P0
P1
Amount of newspaperQ0Q1
ECONOMICS ASSIGNMENT MBA
SECTION “A”
Answer 1:
1.
a
This section describes newspaper market through providing two Case studies:
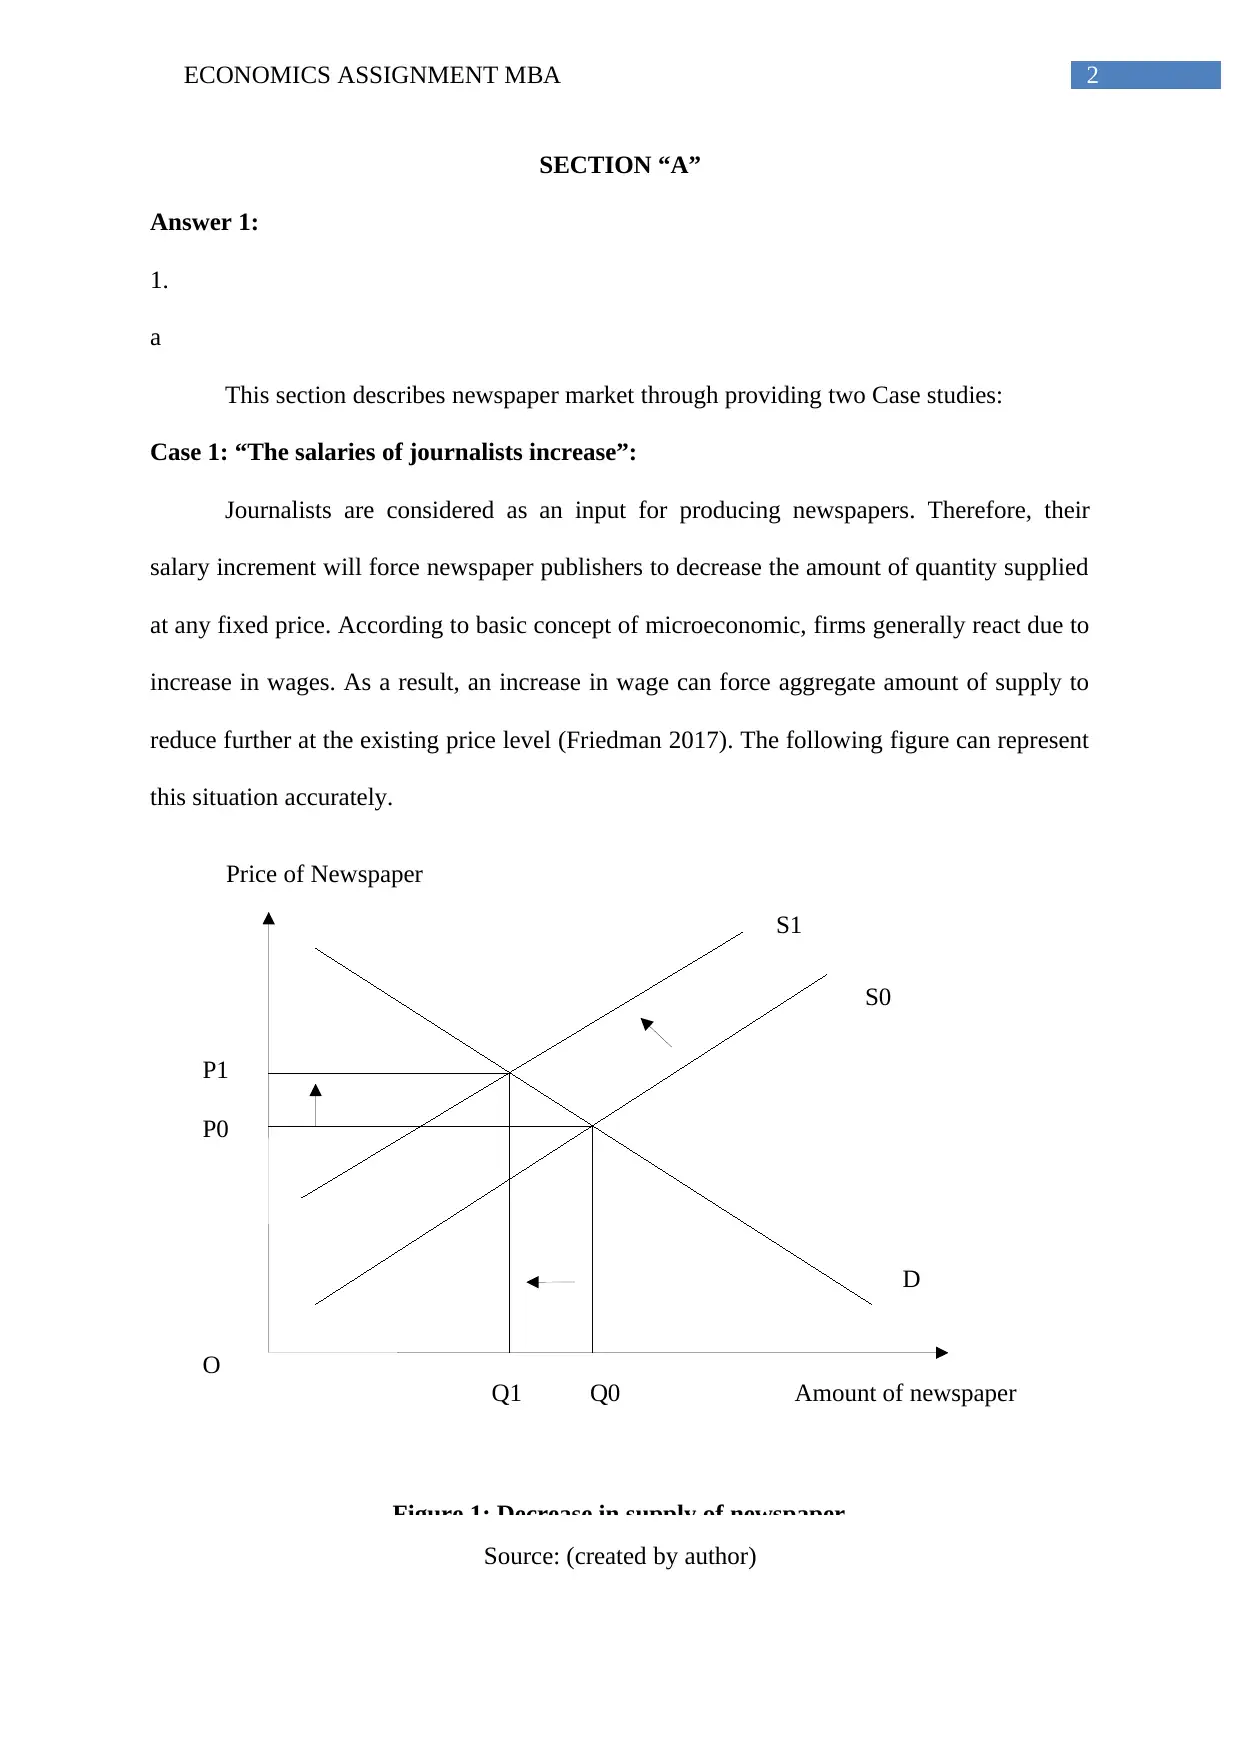
Case 1: “The salaries of journalists increase”:
Journalists are considered as an input for producing newspapers. Therefore, their
salary increment will force newspaper publishers to decrease the amount of quantity supplied
at any fixed price. According to basic concept of microeconomic, firms generally react due to
increase in wages. As a result, an increase in wage can force aggregate amount of supply to
reduce further at the existing price level (Friedman 2017). The following figure can represent
this situation accurately.
Source: (created by author)
Figure 1: Decrease in supply of newspaper
S0
S1
D
Price of Newspaper
O
P0
P1
Amount of newspaperQ0Q1
ECONOMICS ASSIGNMENT MBA
SECTION “A”
Answer 1:
1.
a
This section describes newspaper market through providing two Case studies:
Case 1: “The salaries of journalists increase”:
Journalists are considered as an input for producing newspapers. Therefore, their
salary increment will force newspaper publishers to decrease the amount of quantity supplied
at any fixed price. According to basic concept of microeconomic, firms generally react due to
increase in wages. As a result, an increase in wage can force aggregate amount of supply to
reduce further at the existing price level (Friedman 2017). The following figure can represent
this situation accurately.
Source: (created by author)
Figure 1: Decrease in supply of newspaper
⊘ This is a preview!⊘
Do you want full access?
Subscribe today to unlock all pages.
Trusted by 1+ million students worldwide
3ECONOMICS ASSIGNMENT MBA
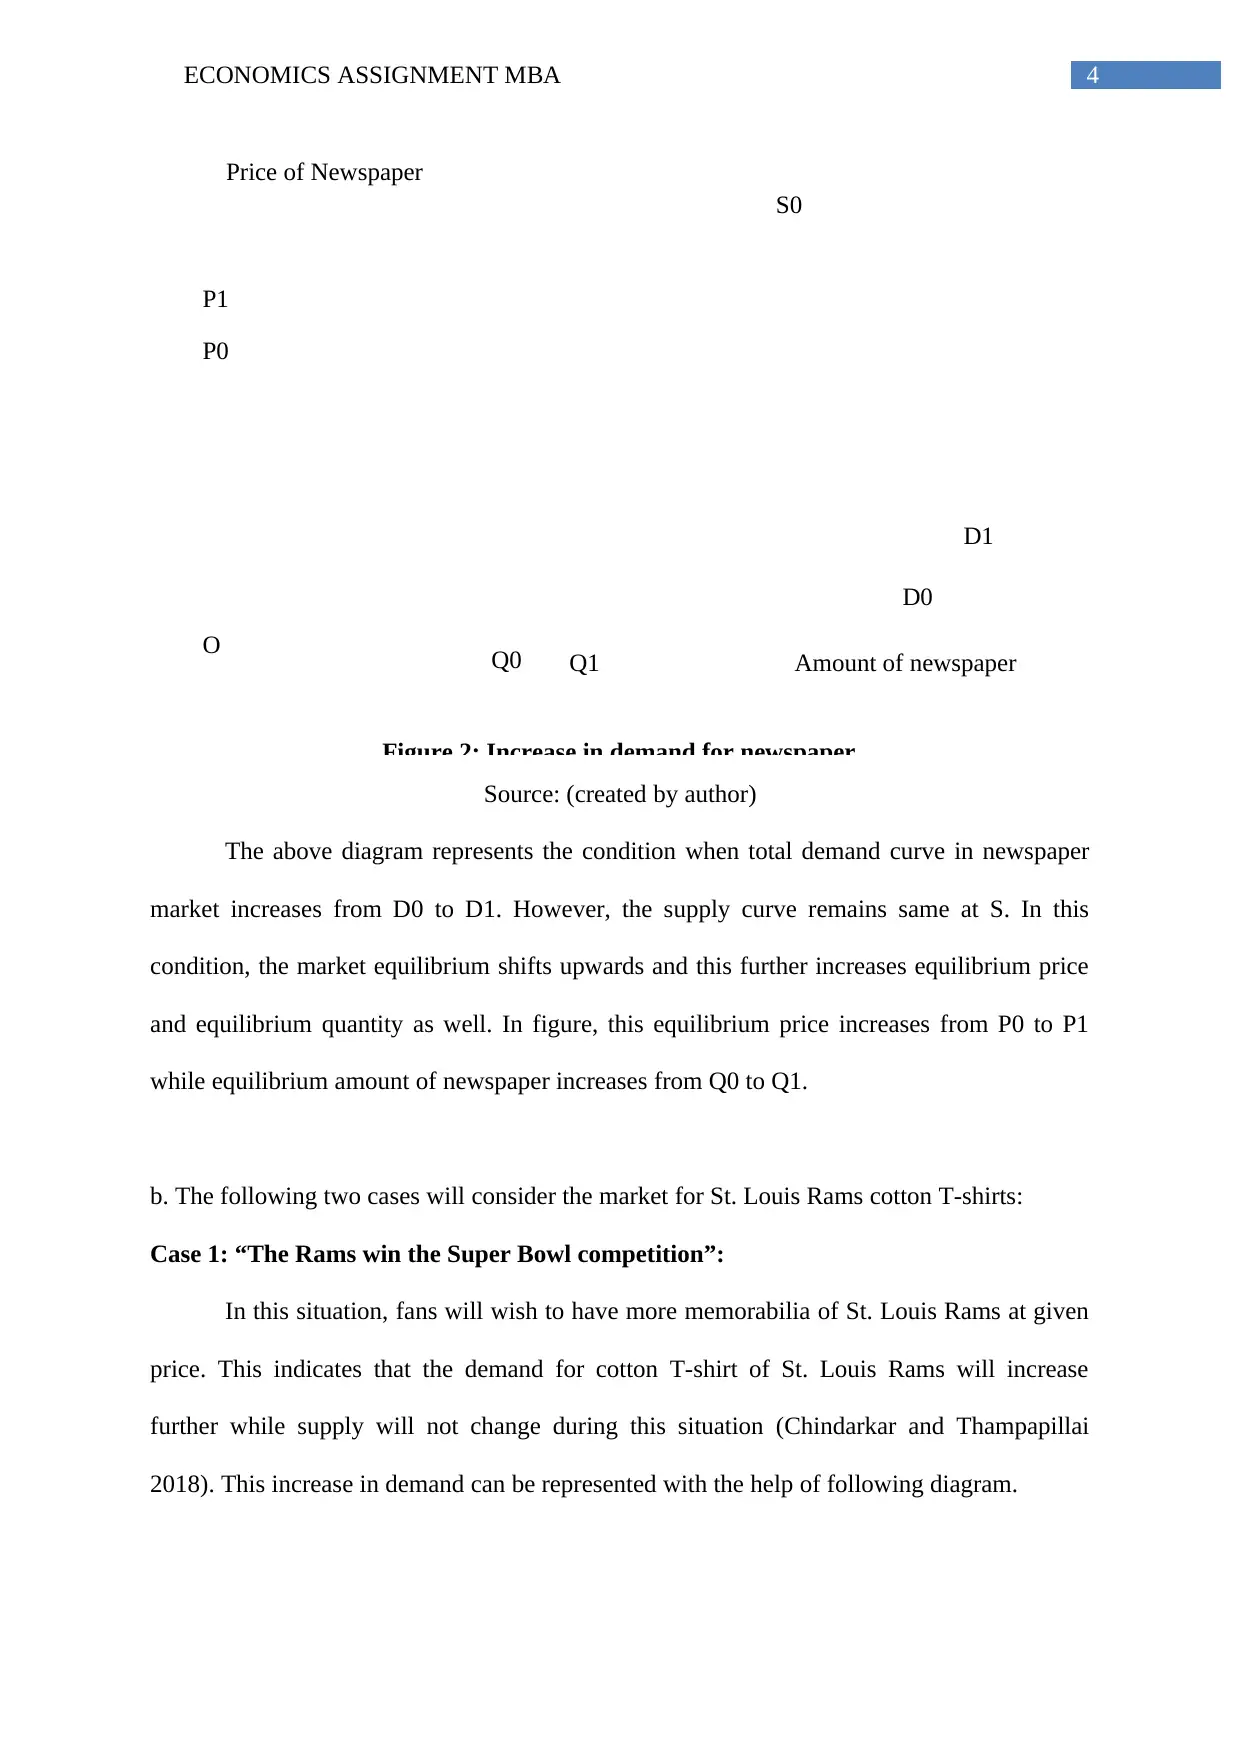
In above figure, D represents demand for newspaper in market. Initially, the market
supplied S0 amount of newspaper. However, after salary increment of journalists, publishers
reduce their publication and consequently the supply curve shifts towards left (Cowell 2018).
The new supply curve becomes S1. However, the demand for this product remains at its
initial position. Therefore, the equilibrium point shifts towards left. After this shifting,
equilibrium price increases from P0 to P1 while equilibrium amount of newspaper decreases
from Q0 to Q1. This implies that publishers will produce comparatively less amount of
newspaper and charge higher price than before.
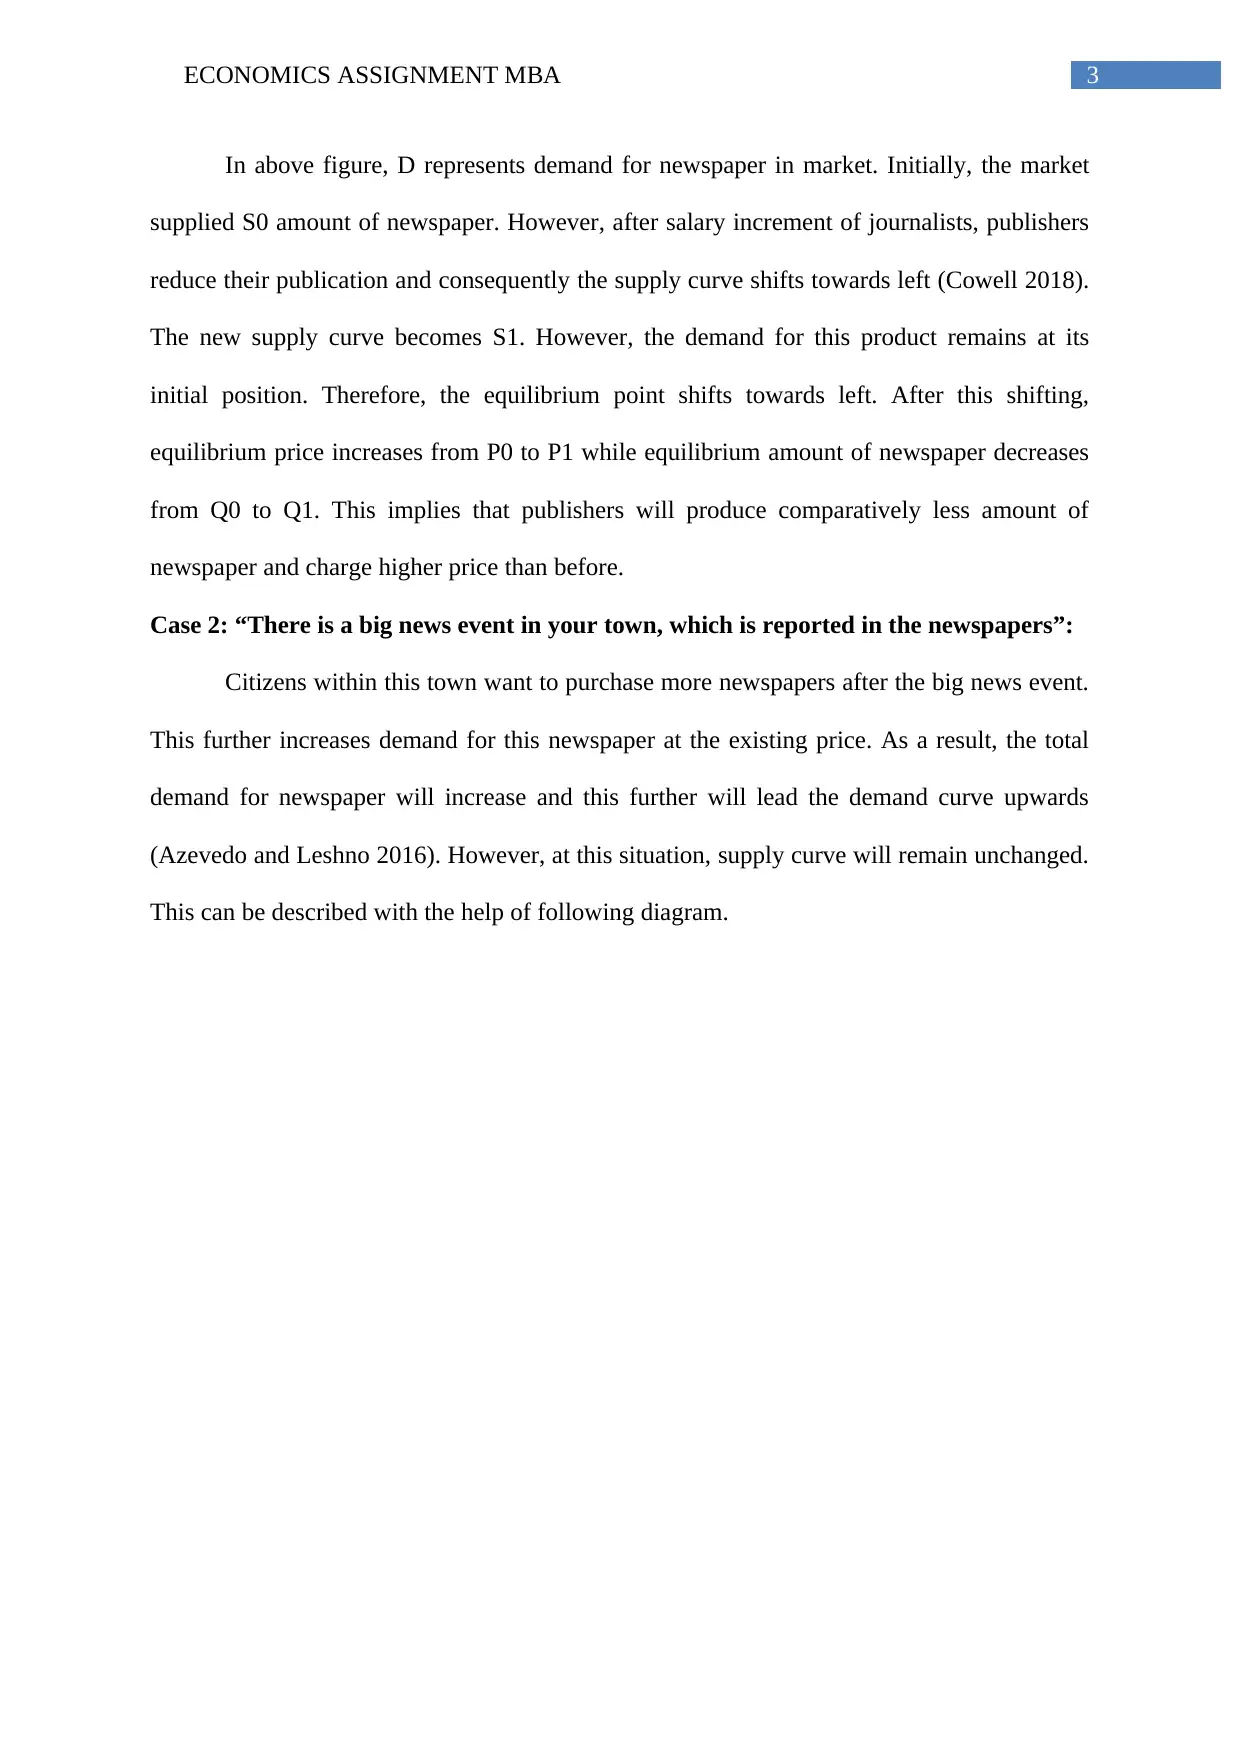
Case 2: “There is a big news event in your town, which is reported in the newspapers”:
Citizens within this town want to purchase more newspapers after the big news event.
This further increases demand for this newspaper at the existing price. As a result, the total
demand for newspaper will increase and this further will lead the demand curve upwards
(Azevedo and Leshno 2016). However, at this situation, supply curve will remain unchanged.
This can be described with the help of following diagram.
In above figure, D represents demand for newspaper in market. Initially, the market
supplied S0 amount of newspaper. However, after salary increment of journalists, publishers
reduce their publication and consequently the supply curve shifts towards left (Cowell 2018).
The new supply curve becomes S1. However, the demand for this product remains at its
initial position. Therefore, the equilibrium point shifts towards left. After this shifting,
equilibrium price increases from P0 to P1 while equilibrium amount of newspaper decreases
from Q0 to Q1. This implies that publishers will produce comparatively less amount of
newspaper and charge higher price than before.
Case 2: “There is a big news event in your town, which is reported in the newspapers”:
Citizens within this town want to purchase more newspapers after the big news event.
This further increases demand for this newspaper at the existing price. As a result, the total
demand for newspaper will increase and this further will lead the demand curve upwards
(Azevedo and Leshno 2016). However, at this situation, supply curve will remain unchanged.
This can be described with the help of following diagram.
Paraphrase This Document
Need a fresh take? Get an instant paraphrase of this document with our AI Paraphraser
4ECONOMICS ASSIGNMENT MBA
S0
D0
Price of Newspaper
O
P0
P1
Amount of newspaperQ1Q0
D1
Source: (created by author)
The above diagram represents the condition when total demand curve in newspaper
market increases from D0 to D1. However, the supply curve remains same at S. In this
condition, the market equilibrium shifts upwards and this further increases equilibrium price
and equilibrium quantity as well. In figure, this equilibrium price increases from P0 to P1
while equilibrium amount of newspaper increases from Q0 to Q1.
b. The following two cases will consider the market for St. Louis Rams cotton T-shirts:
Case 1: “The Rams win the Super Bowl competition”:
In this situation, fans will wish to have more memorabilia of St. Louis Rams at given
price. This indicates that the demand for cotton T-shirt of St. Louis Rams will increase
further while supply will not change during this situation (Chindarkar and Thampapillai
2018). This increase in demand can be represented with the help of following diagram.
Figure 2: Increase in demand for newspaper
5ECONOMICS ASSIGNMENT MBA
S0
D0
Price of T-shirt
O
P0
P1
Amount of T-shirtQ1Q0
D1
Source: (created by author)
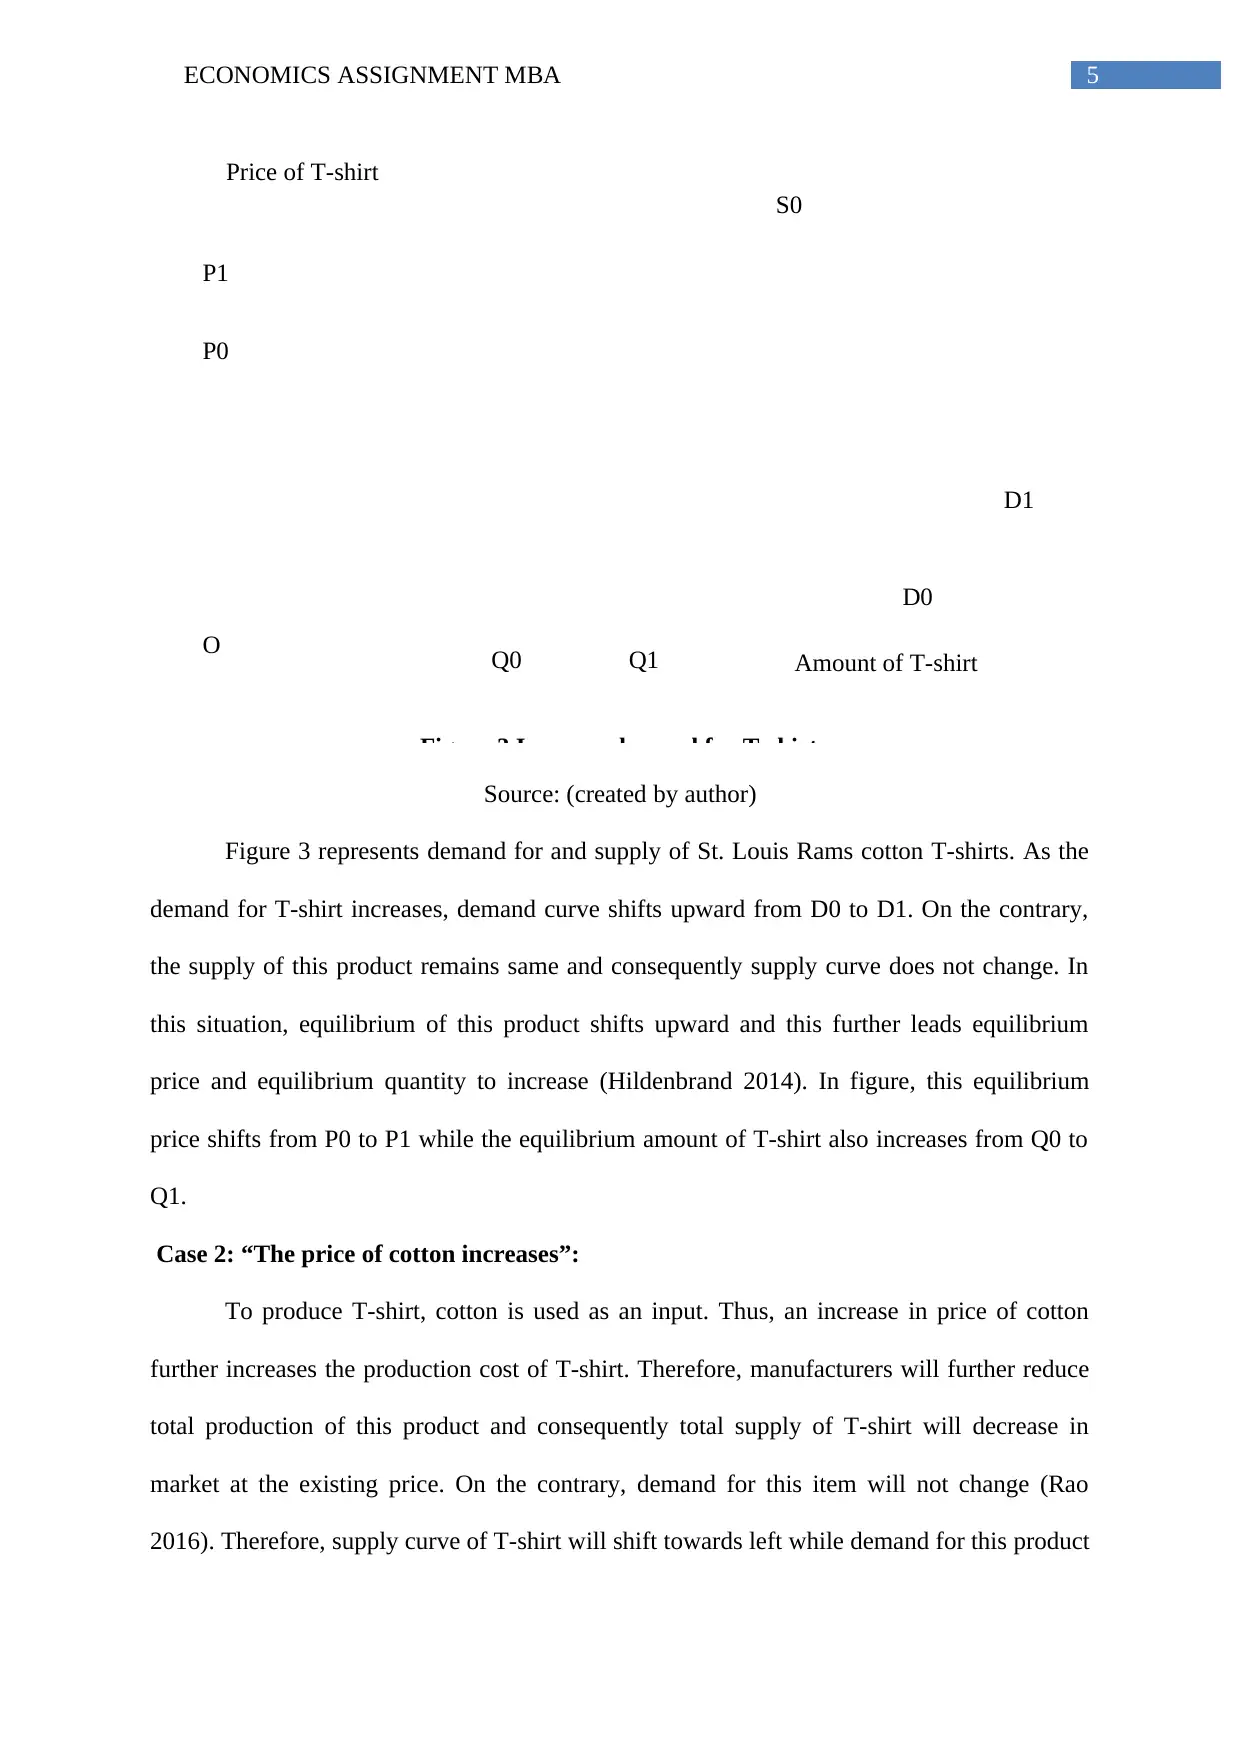
Figure 3 represents demand for and supply of St. Louis Rams cotton T-shirts. As the
demand for T-shirt increases, demand curve shifts upward from D0 to D1. On the contrary,
the supply of this product remains same and consequently supply curve does not change. In
this situation, equilibrium of this product shifts upward and this further leads equilibrium
price and equilibrium quantity to increase (Hildenbrand 2014). In figure, this equilibrium
price shifts from P0 to P1 while the equilibrium amount of T-shirt also increases from Q0 to
Q1.
Case 2: “The price of cotton increases”:
To produce T-shirt, cotton is used as an input. Thus, an increase in price of cotton
further increases the production cost of T-shirt. Therefore, manufacturers will further reduce
total production of this product and consequently total supply of T-shirt will decrease in
market at the existing price. On the contrary, demand for this item will not change (Rao
2016). Therefore, supply curve of T-shirt will shift towards left while demand for this product
Figure 3 Increase demand for T-shirt
S0
D0
Price of T-shirt
O
P0
P1
Amount of T-shirtQ1Q0
D1
Source: (created by author)
Figure 3 represents demand for and supply of St. Louis Rams cotton T-shirts. As the
demand for T-shirt increases, demand curve shifts upward from D0 to D1. On the contrary,
the supply of this product remains same and consequently supply curve does not change. In
this situation, equilibrium of this product shifts upward and this further leads equilibrium
price and equilibrium quantity to increase (Hildenbrand 2014). In figure, this equilibrium
price shifts from P0 to P1 while the equilibrium amount of T-shirt also increases from Q0 to
Q1.
Case 2: “The price of cotton increases”:
To produce T-shirt, cotton is used as an input. Thus, an increase in price of cotton
further increases the production cost of T-shirt. Therefore, manufacturers will further reduce
total production of this product and consequently total supply of T-shirt will decrease in
market at the existing price. On the contrary, demand for this item will not change (Rao
2016). Therefore, supply curve of T-shirt will shift towards left while demand for this product
Figure 3 Increase demand for T-shirt
⊘ This is a preview!⊘
Do you want full access?
Subscribe today to unlock all pages.
Trusted by 1+ million students worldwide
6ECONOMICS ASSIGNMENT MBA
S0
S1
D
Price of T-shirt
O
P0
P1
Amount of T-shirtQ0Q1
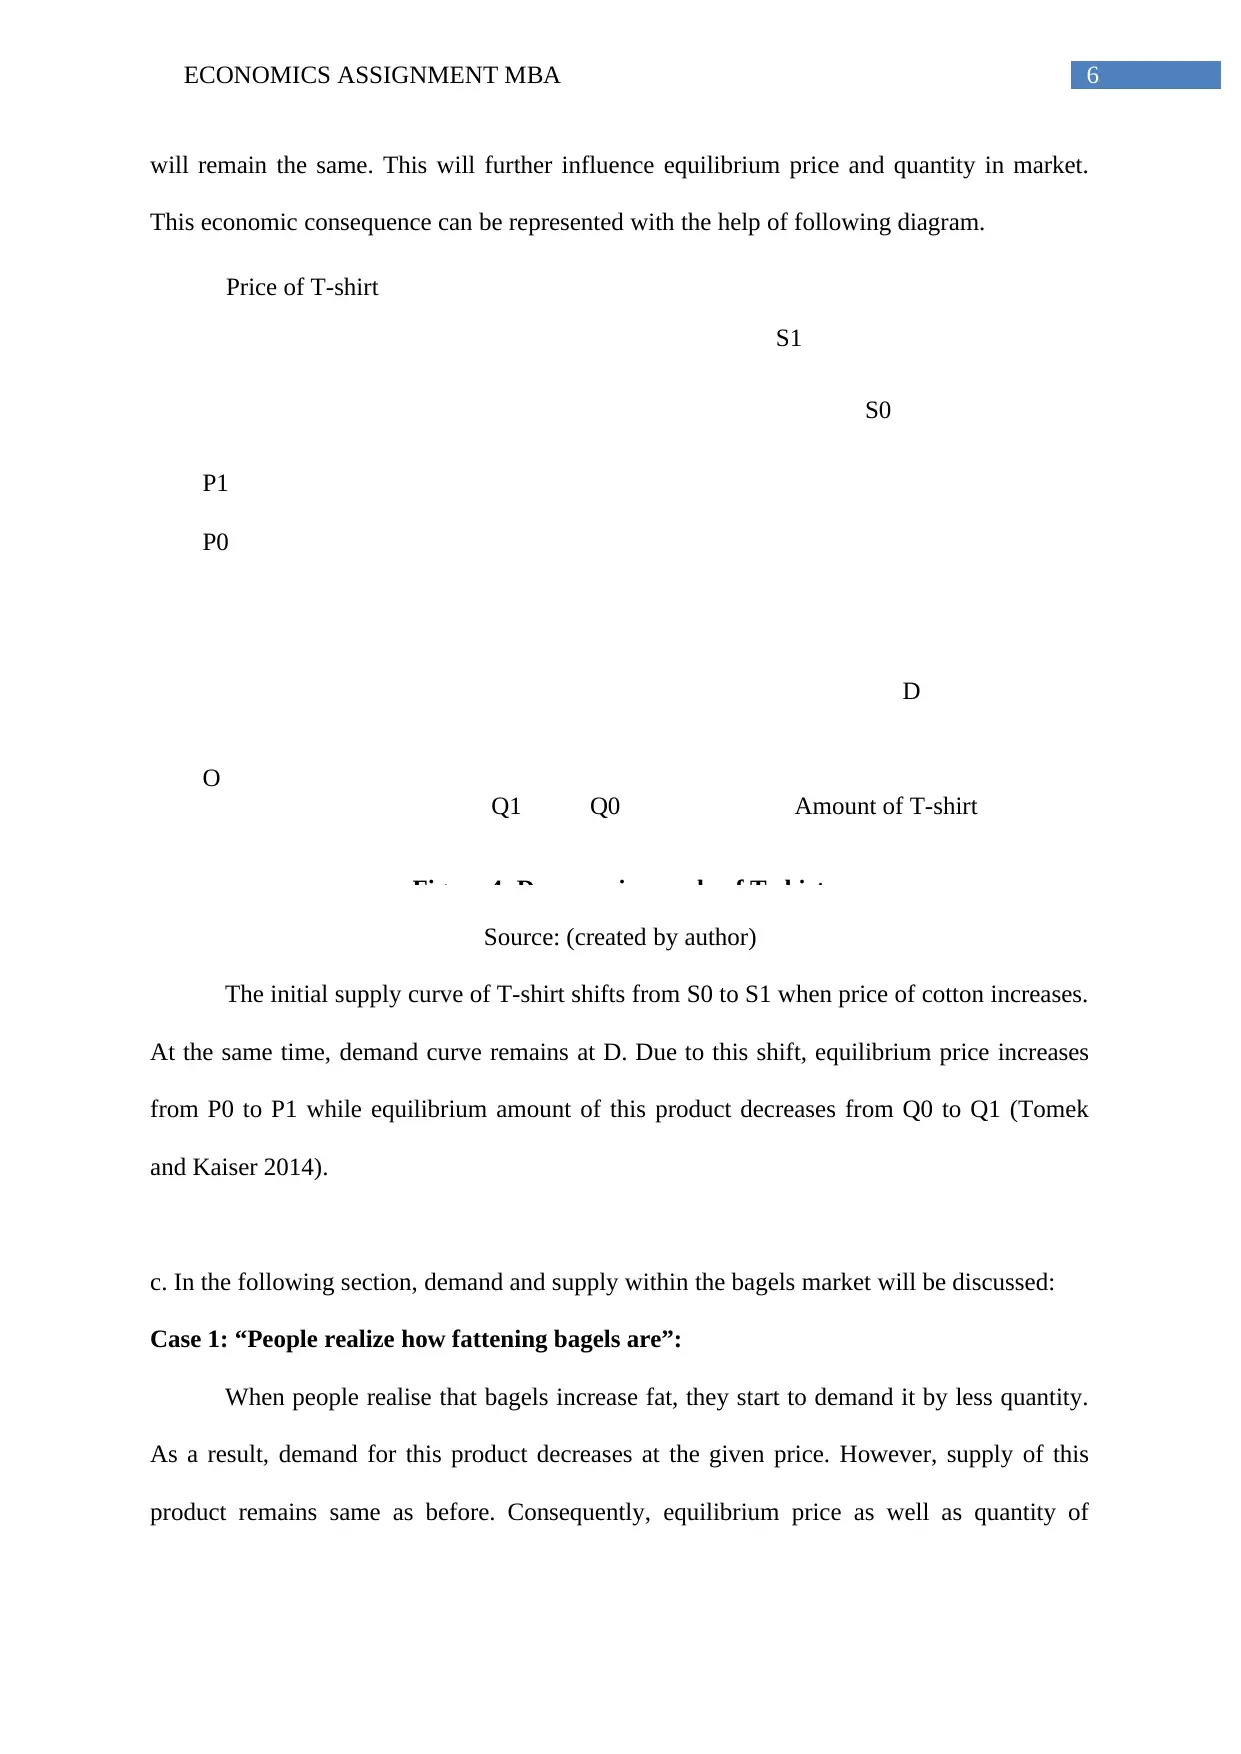
will remain the same. This will further influence equilibrium price and quantity in market.
This economic consequence can be represented with the help of following diagram.
Source: (created by author)
The initial supply curve of T-shirt shifts from S0 to S1 when price of cotton increases.
At the same time, demand curve remains at D. Due to this shift, equilibrium price increases
from P0 to P1 while equilibrium amount of this product decreases from Q0 to Q1 (Tomek
and Kaiser 2014).
c. In the following section, demand and supply within the bagels market will be discussed:
Case 1: “People realize how fattening bagels are”:
When people realise that bagels increase fat, they start to demand it by less quantity.
As a result, demand for this product decreases at the given price. However, supply of this
product remains same as before. Consequently, equilibrium price as well as quantity of
Figure 4: Decrease in supply of T-shirt
S0
S1
D
Price of T-shirt
O
P0
P1
Amount of T-shirtQ0Q1
will remain the same. This will further influence equilibrium price and quantity in market.
This economic consequence can be represented with the help of following diagram.
Source: (created by author)
The initial supply curve of T-shirt shifts from S0 to S1 when price of cotton increases.
At the same time, demand curve remains at D. Due to this shift, equilibrium price increases
from P0 to P1 while equilibrium amount of this product decreases from Q0 to Q1 (Tomek
and Kaiser 2014).
c. In the following section, demand and supply within the bagels market will be discussed:
Case 1: “People realize how fattening bagels are”:
When people realise that bagels increase fat, they start to demand it by less quantity.
As a result, demand for this product decreases at the given price. However, supply of this
product remains same as before. Consequently, equilibrium price as well as quantity of
Figure 4: Decrease in supply of T-shirt
Paraphrase This Document
Need a fresh take? Get an instant paraphrase of this document with our AI Paraphraser
7ECONOMICS ASSIGNMENT MBA
S0
D1
Price of bagels
O
P1
P0
Amount of bagelsQ0Q1
D0
bagels changes within the market (Lee and Brown 2016). With the help of following diagram,
this situation can be described precisely.
Source: (created by author)
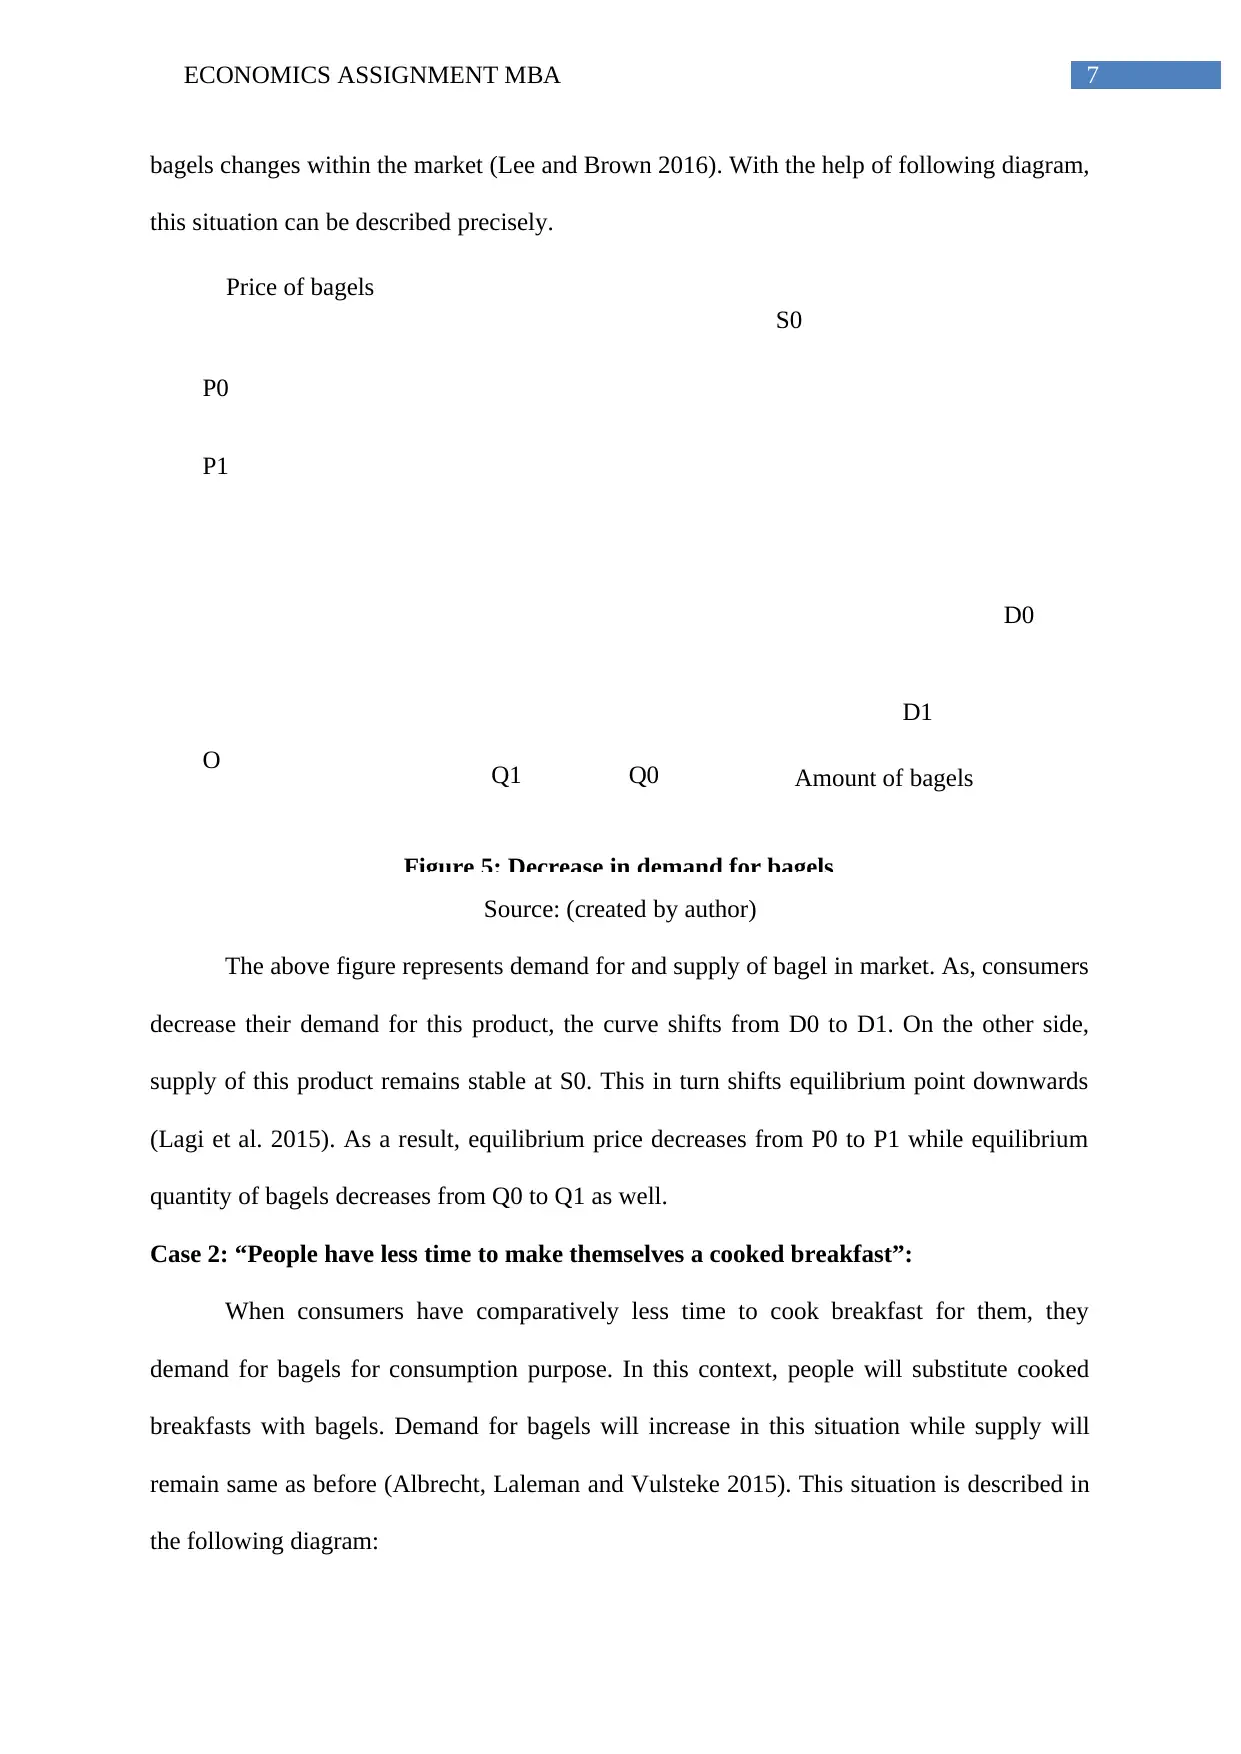
The above figure represents demand for and supply of bagel in market. As, consumers
decrease their demand for this product, the curve shifts from D0 to D1. On the other side,
supply of this product remains stable at S0. This in turn shifts equilibrium point downwards
(Lagi et al. 2015). As a result, equilibrium price decreases from P0 to P1 while equilibrium
quantity of bagels decreases from Q0 to Q1 as well.
Case 2: “People have less time to make themselves a cooked breakfast”:
When consumers have comparatively less time to cook breakfast for them, they
demand for bagels for consumption purpose. In this context, people will substitute cooked
breakfasts with bagels. Demand for bagels will increase in this situation while supply will
remain same as before (Albrecht, Laleman and Vulsteke 2015). This situation is described in
the following diagram:
Figure 5: Decrease in demand for bagels
S0
D1
Price of bagels
O
P1
P0
Amount of bagelsQ0Q1
D0
bagels changes within the market (Lee and Brown 2016). With the help of following diagram,
this situation can be described precisely.
Source: (created by author)
The above figure represents demand for and supply of bagel in market. As, consumers
decrease their demand for this product, the curve shifts from D0 to D1. On the other side,
supply of this product remains stable at S0. This in turn shifts equilibrium point downwards
(Lagi et al. 2015). As a result, equilibrium price decreases from P0 to P1 while equilibrium
quantity of bagels decreases from Q0 to Q1 as well.
Case 2: “People have less time to make themselves a cooked breakfast”:
When consumers have comparatively less time to cook breakfast for them, they
demand for bagels for consumption purpose. In this context, people will substitute cooked
breakfasts with bagels. Demand for bagels will increase in this situation while supply will
remain same as before (Albrecht, Laleman and Vulsteke 2015). This situation is described in
the following diagram:
Figure 5: Decrease in demand for bagels
8ECONOMICS ASSIGNMENT MBA
S0
D0
Price of bagel
O
P0
P1
Amount of bagelQ1Q0
D1
Source: (created by author)
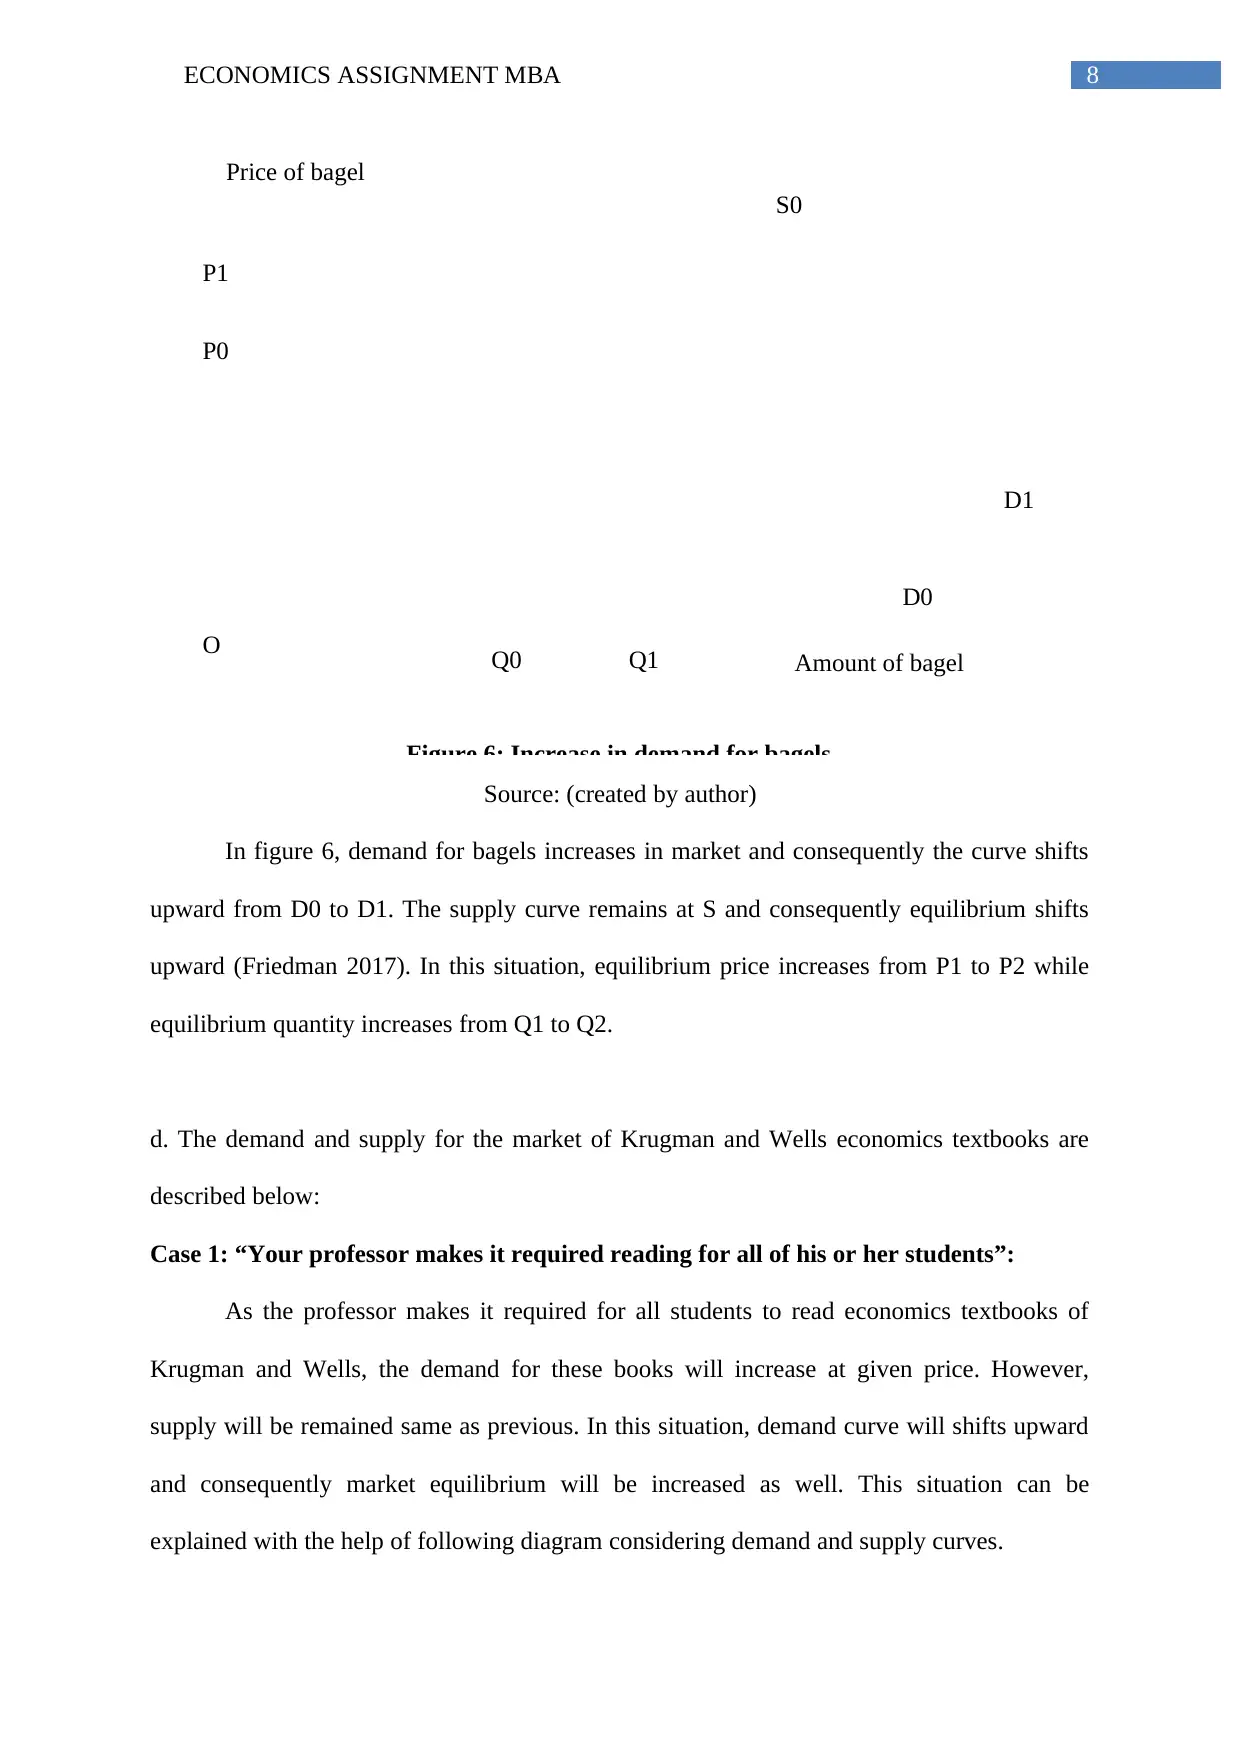
In figure 6, demand for bagels increases in market and consequently the curve shifts
upward from D0 to D1. The supply curve remains at S and consequently equilibrium shifts
upward (Friedman 2017). In this situation, equilibrium price increases from P1 to P2 while
equilibrium quantity increases from Q1 to Q2.
d. The demand and supply for the market of Krugman and Wells economics textbooks are
described below:
Case 1: “Your professor makes it required reading for all of his or her students”:
As the professor makes it required for all students to read economics textbooks of
Krugman and Wells, the demand for these books will increase at given price. However,
supply will be remained same as previous. In this situation, demand curve will shifts upward
and consequently market equilibrium will be increased as well. This situation can be
explained with the help of following diagram considering demand and supply curves.
Figure 6: Increase in demand for bagels
S0
D0
Price of bagel
O
P0
P1
Amount of bagelQ1Q0
D1
Source: (created by author)
In figure 6, demand for bagels increases in market and consequently the curve shifts
upward from D0 to D1. The supply curve remains at S and consequently equilibrium shifts
upward (Friedman 2017). In this situation, equilibrium price increases from P1 to P2 while
equilibrium quantity increases from Q1 to Q2.
d. The demand and supply for the market of Krugman and Wells economics textbooks are
described below:
Case 1: “Your professor makes it required reading for all of his or her students”:
As the professor makes it required for all students to read economics textbooks of
Krugman and Wells, the demand for these books will increase at given price. However,
supply will be remained same as previous. In this situation, demand curve will shifts upward
and consequently market equilibrium will be increased as well. This situation can be
explained with the help of following diagram considering demand and supply curves.
Figure 6: Increase in demand for bagels
⊘ This is a preview!⊘
Do you want full access?
Subscribe today to unlock all pages.
Trusted by 1+ million students worldwide
9ECONOMICS ASSIGNMENT MBA
S0
D0
Price of economics textbooks
O
P0
P1
Amount of economics textbooksQ1Q0
D1
Source: (created by author)
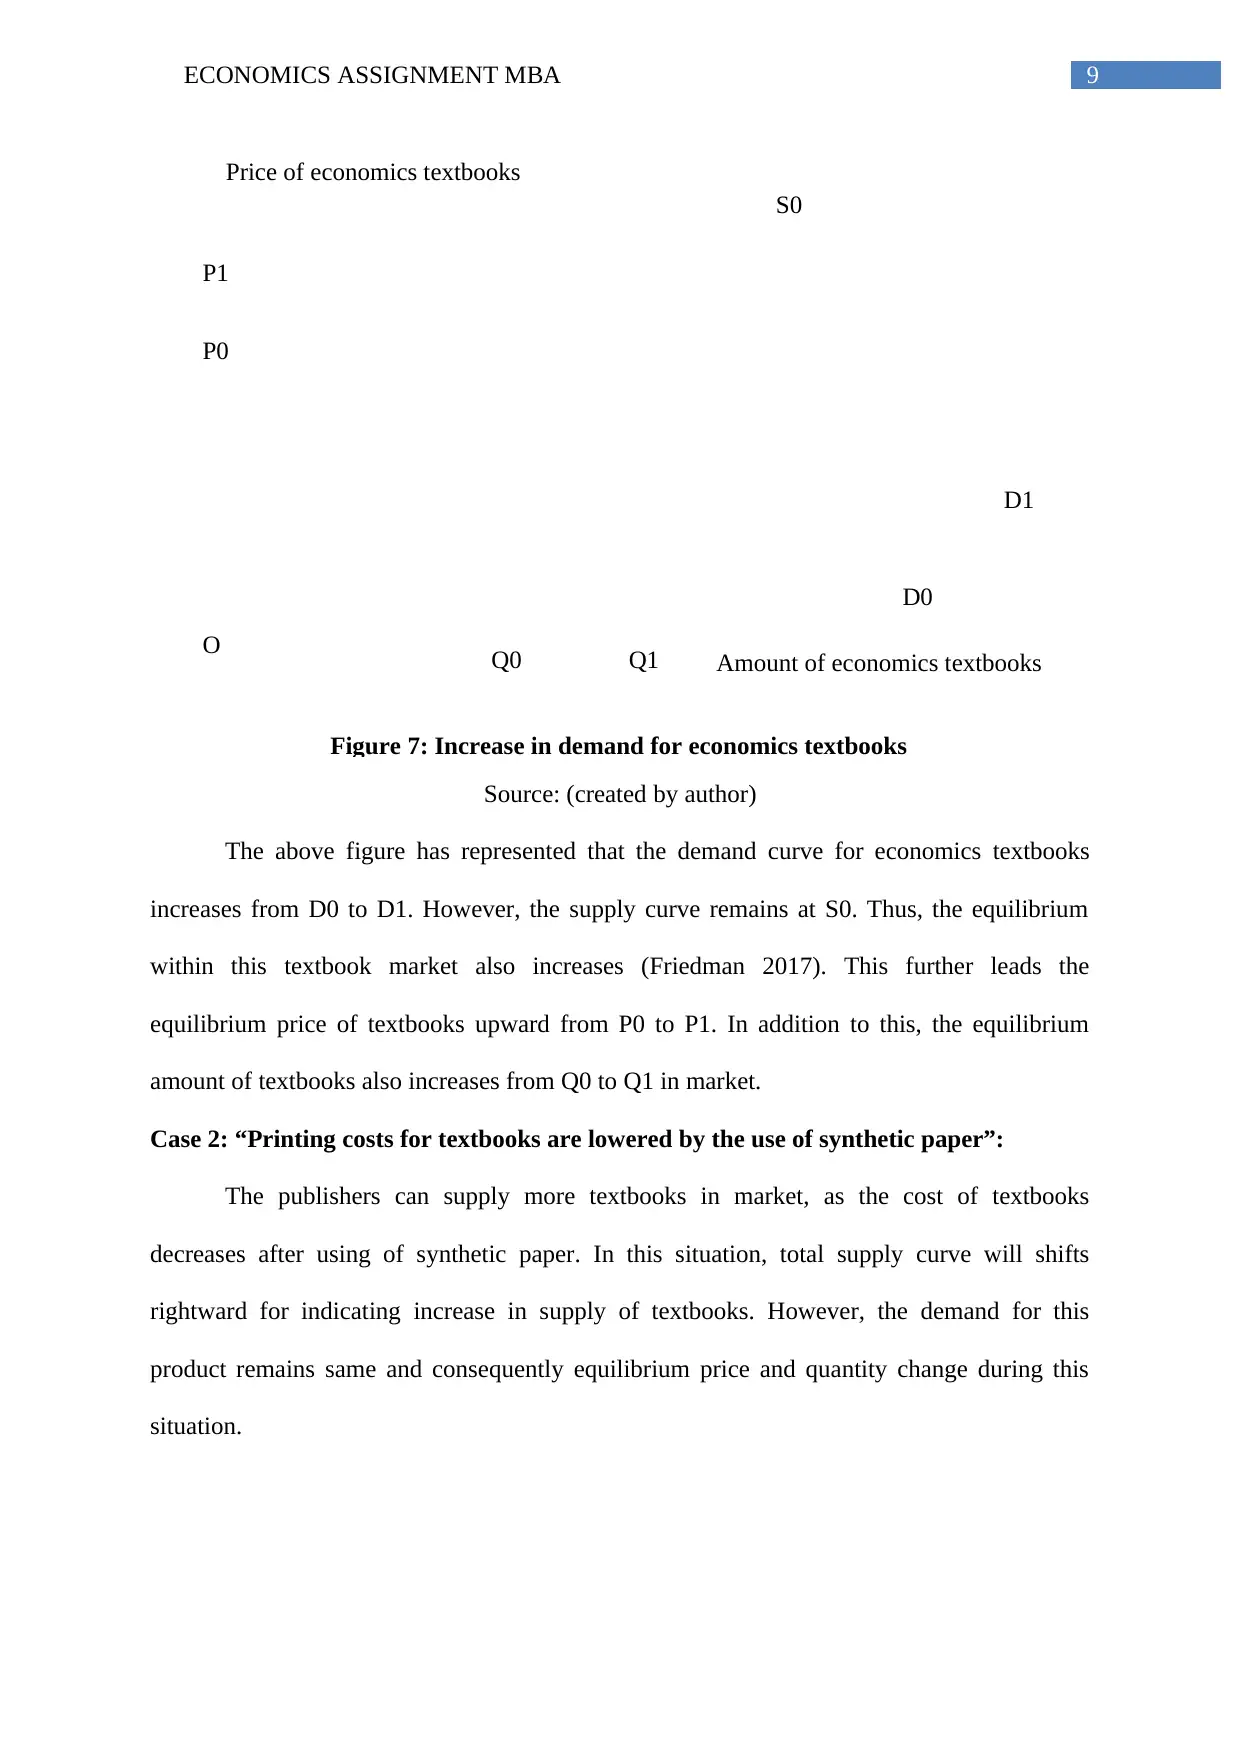
The above figure has represented that the demand curve for economics textbooks
increases from D0 to D1. However, the supply curve remains at S0. Thus, the equilibrium
within this textbook market also increases (Friedman 2017). This further leads the
equilibrium price of textbooks upward from P0 to P1. In addition to this, the equilibrium
amount of textbooks also increases from Q0 to Q1 in market.
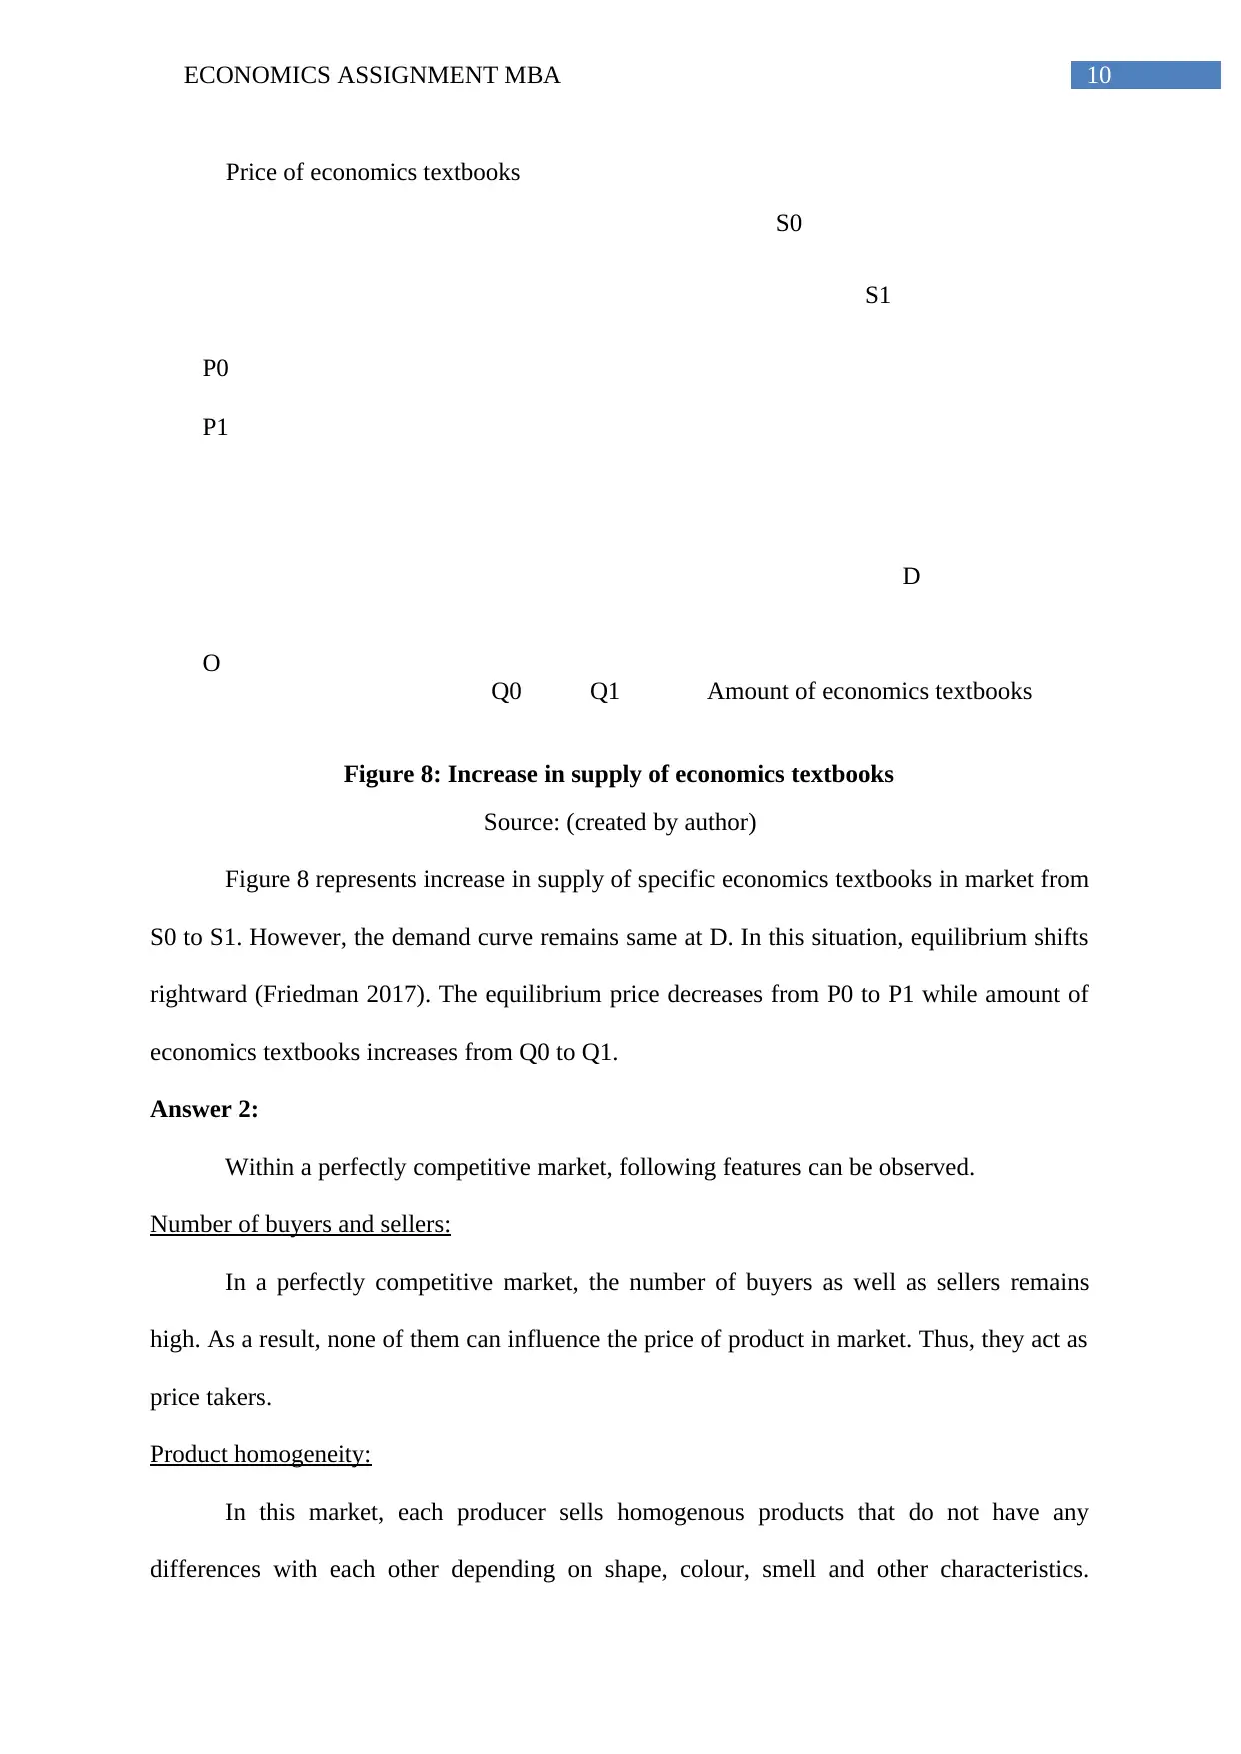
Case 2: “Printing costs for textbooks are lowered by the use of synthetic paper”:
The publishers can supply more textbooks in market, as the cost of textbooks
decreases after using of synthetic paper. In this situation, total supply curve will shifts
rightward for indicating increase in supply of textbooks. However, the demand for this
product remains same and consequently equilibrium price and quantity change during this
situation.
Figure 7: Increase in demand for economics textbooks
S0
D0
Price of economics textbooks
O
P0
P1
Amount of economics textbooksQ1Q0
D1
Source: (created by author)
The above figure has represented that the demand curve for economics textbooks
increases from D0 to D1. However, the supply curve remains at S0. Thus, the equilibrium
within this textbook market also increases (Friedman 2017). This further leads the
equilibrium price of textbooks upward from P0 to P1. In addition to this, the equilibrium
amount of textbooks also increases from Q0 to Q1 in market.
Case 2: “Printing costs for textbooks are lowered by the use of synthetic paper”:
The publishers can supply more textbooks in market, as the cost of textbooks
decreases after using of synthetic paper. In this situation, total supply curve will shifts
rightward for indicating increase in supply of textbooks. However, the demand for this
product remains same and consequently equilibrium price and quantity change during this
situation.
Figure 7: Increase in demand for economics textbooks
Paraphrase This Document
Need a fresh take? Get an instant paraphrase of this document with our AI Paraphraser
10ECONOMICS ASSIGNMENT MBA
S1
S0
D
Price of economics textbooks
O
P1
P0
Amount of economics textbooksQ1Q0
Source: (created by author)
Figure 8 represents increase in supply of specific economics textbooks in market from
S0 to S1. However, the demand curve remains same at D. In this situation, equilibrium shifts
rightward (Friedman 2017). The equilibrium price decreases from P0 to P1 while amount of
economics textbooks increases from Q0 to Q1.
Answer 2:
Within a perfectly competitive market, following features can be observed.
Number of buyers and sellers:
In a perfectly competitive market, the number of buyers as well as sellers remains
high. As a result, none of them can influence the price of product in market. Thus, they act as
price takers.
Product homogeneity:
In this market, each producer sells homogenous products that do not have any
differences with each other depending on shape, colour, smell and other characteristics.
Figure 8: Increase in supply of economics textbooks
11ECONOMICS ASSIGNMENT MBA
Therefore, purchasers cannot show any preferences at the time of purchasing any product. In
this situation, price also remains same across the market.
Perfect market knowledge:
In the perfectly competitive market, both buyers and sellers have complete knowledge
of prices through which they can purchase and sell products (Bagwell and Staiger 2015). At
the same time, they also know about the price at which they want to purchase and sell this
product. This process helps the market to maintain uniformity in product prices.
Free entry and exit of firms:
In this market, each firm can feel free to enter into the market when existing firms
experience excess profit during short-run. On the contrary, existing firms can exit from the
market if they incur loss during short-run (Ali et al. 2015). This further can help the
competitive market to maintain uniform prices.
Factors can move freely:
Within a perfectly competitive market, factors of production can move freely from
one firm to another without any constraint (Mankiw 2016). This further helps the market to
maintain factor-price equalisation across the market.
Absence of price control:
In this market, the government does not interfere in any business activity. An invisible
hand operates here to maintain stable equilibrium condition.
To explain this situation, agricultural market can be considered as an example. Within
this market, large number of farmers sells similar products like fruits and other vegetables to
large number of consumers (Çakır and Nolan 2015). In this context, consumers cannot
differentiate agricultural products and the price of these products remains almost same across
the market.
⊘ This is a preview!⊘
Do you want full access?
Subscribe today to unlock all pages.
Trusted by 1+ million students worldwide
1 out of 27
Related Documents


Your All-in-One AI-Powered Toolkit for Academic Success.
+13062052269
info@desklib.com
Available 24*7 on WhatsApp / Email
![[object Object]](/_next/static/media/star-bottom.7253800d.svg)
Unlock your academic potential
Copyright © 2020–2026 A2Z Services. All Rights Reserved. Developed and managed by ZUCOL.