Business Economics Report: Market Analysis and Policy Impacts

Verified

Added on  2022/08/24

|13
|2028
|36
Report
AI Summary
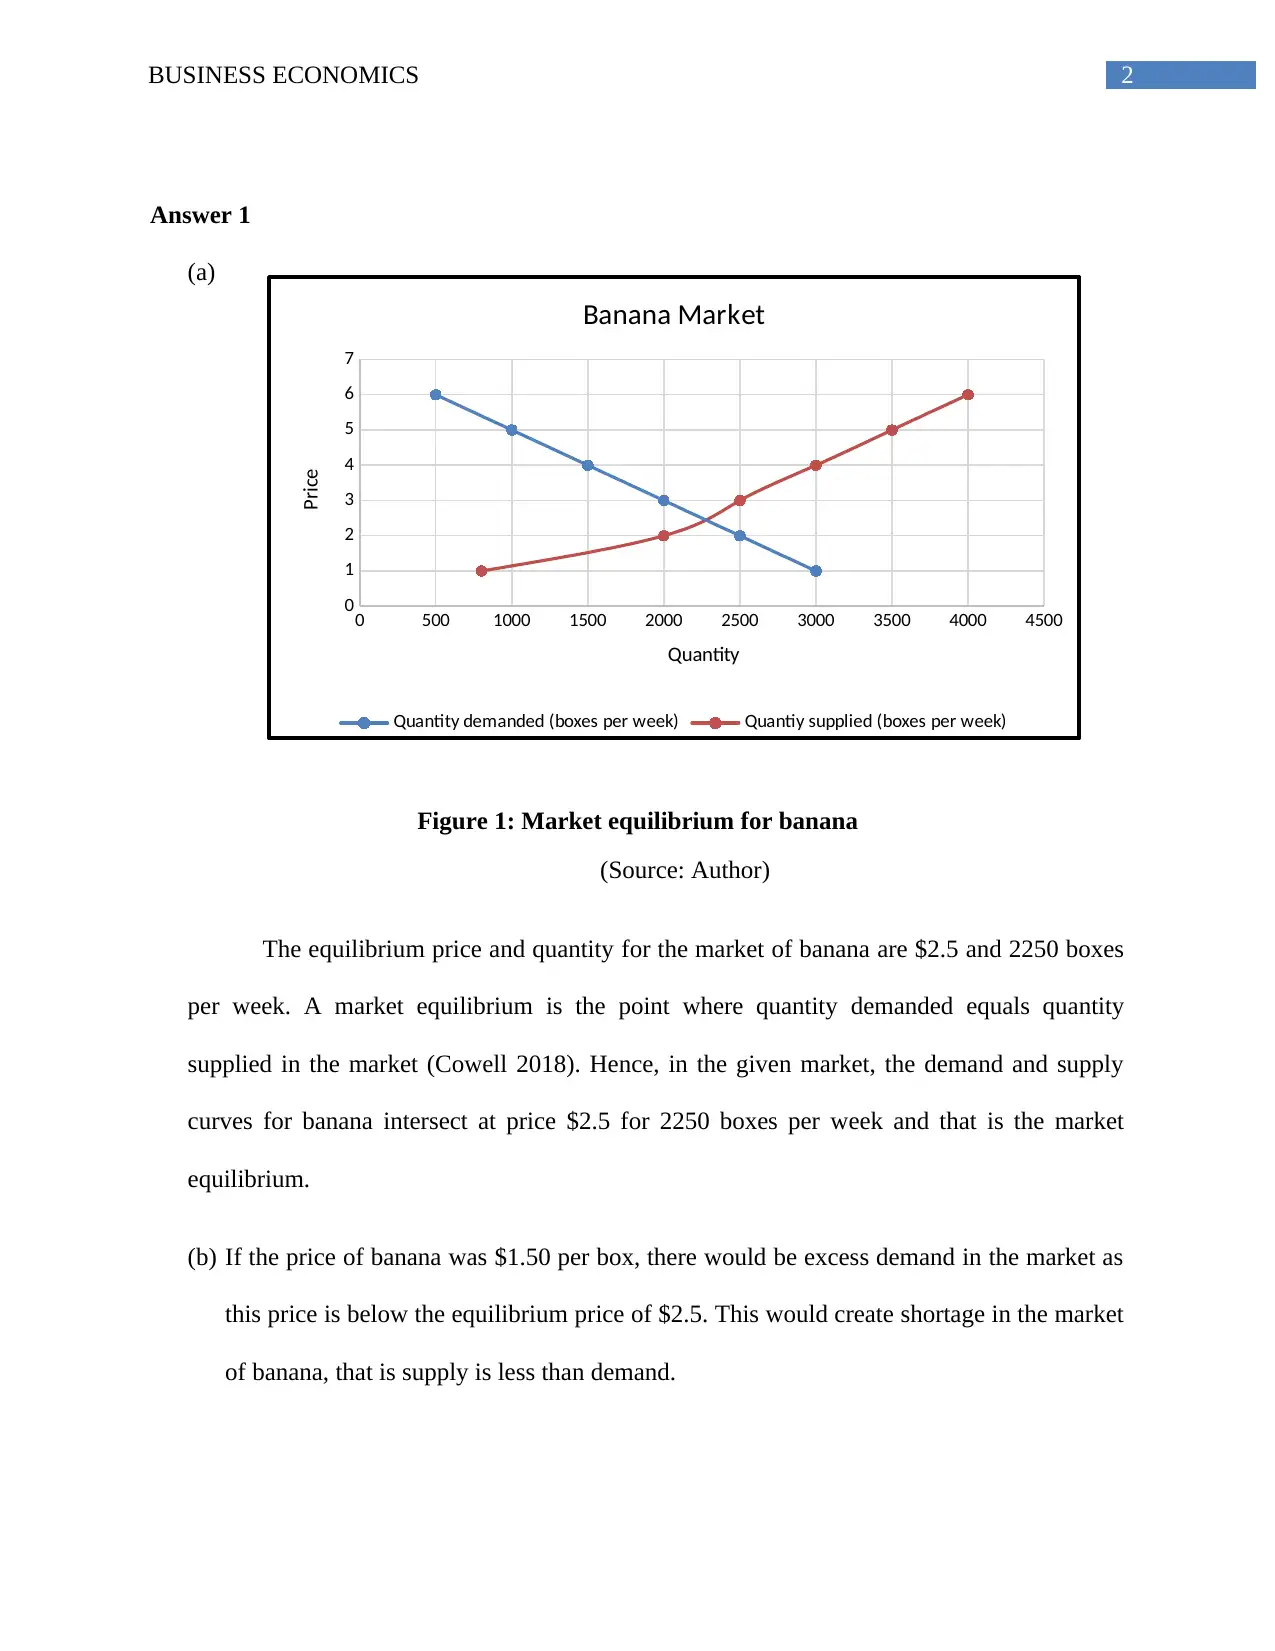
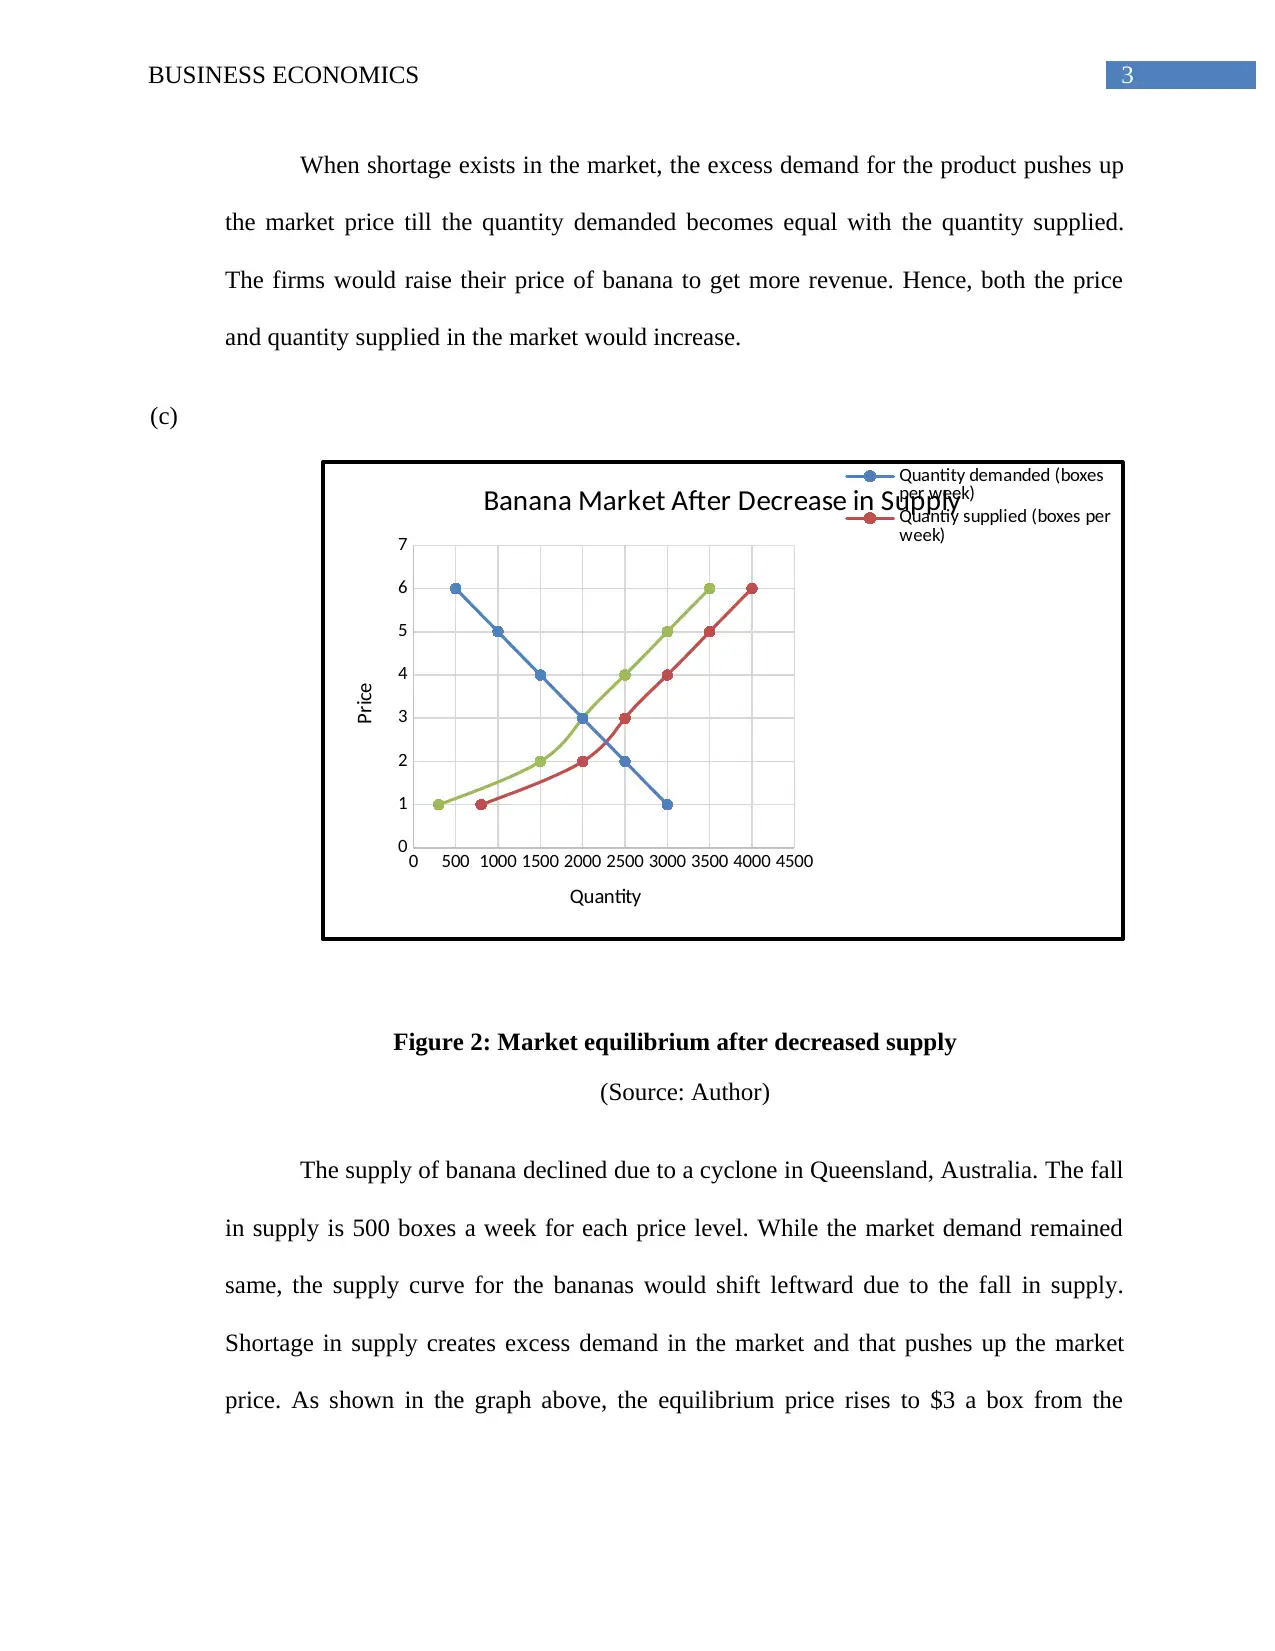
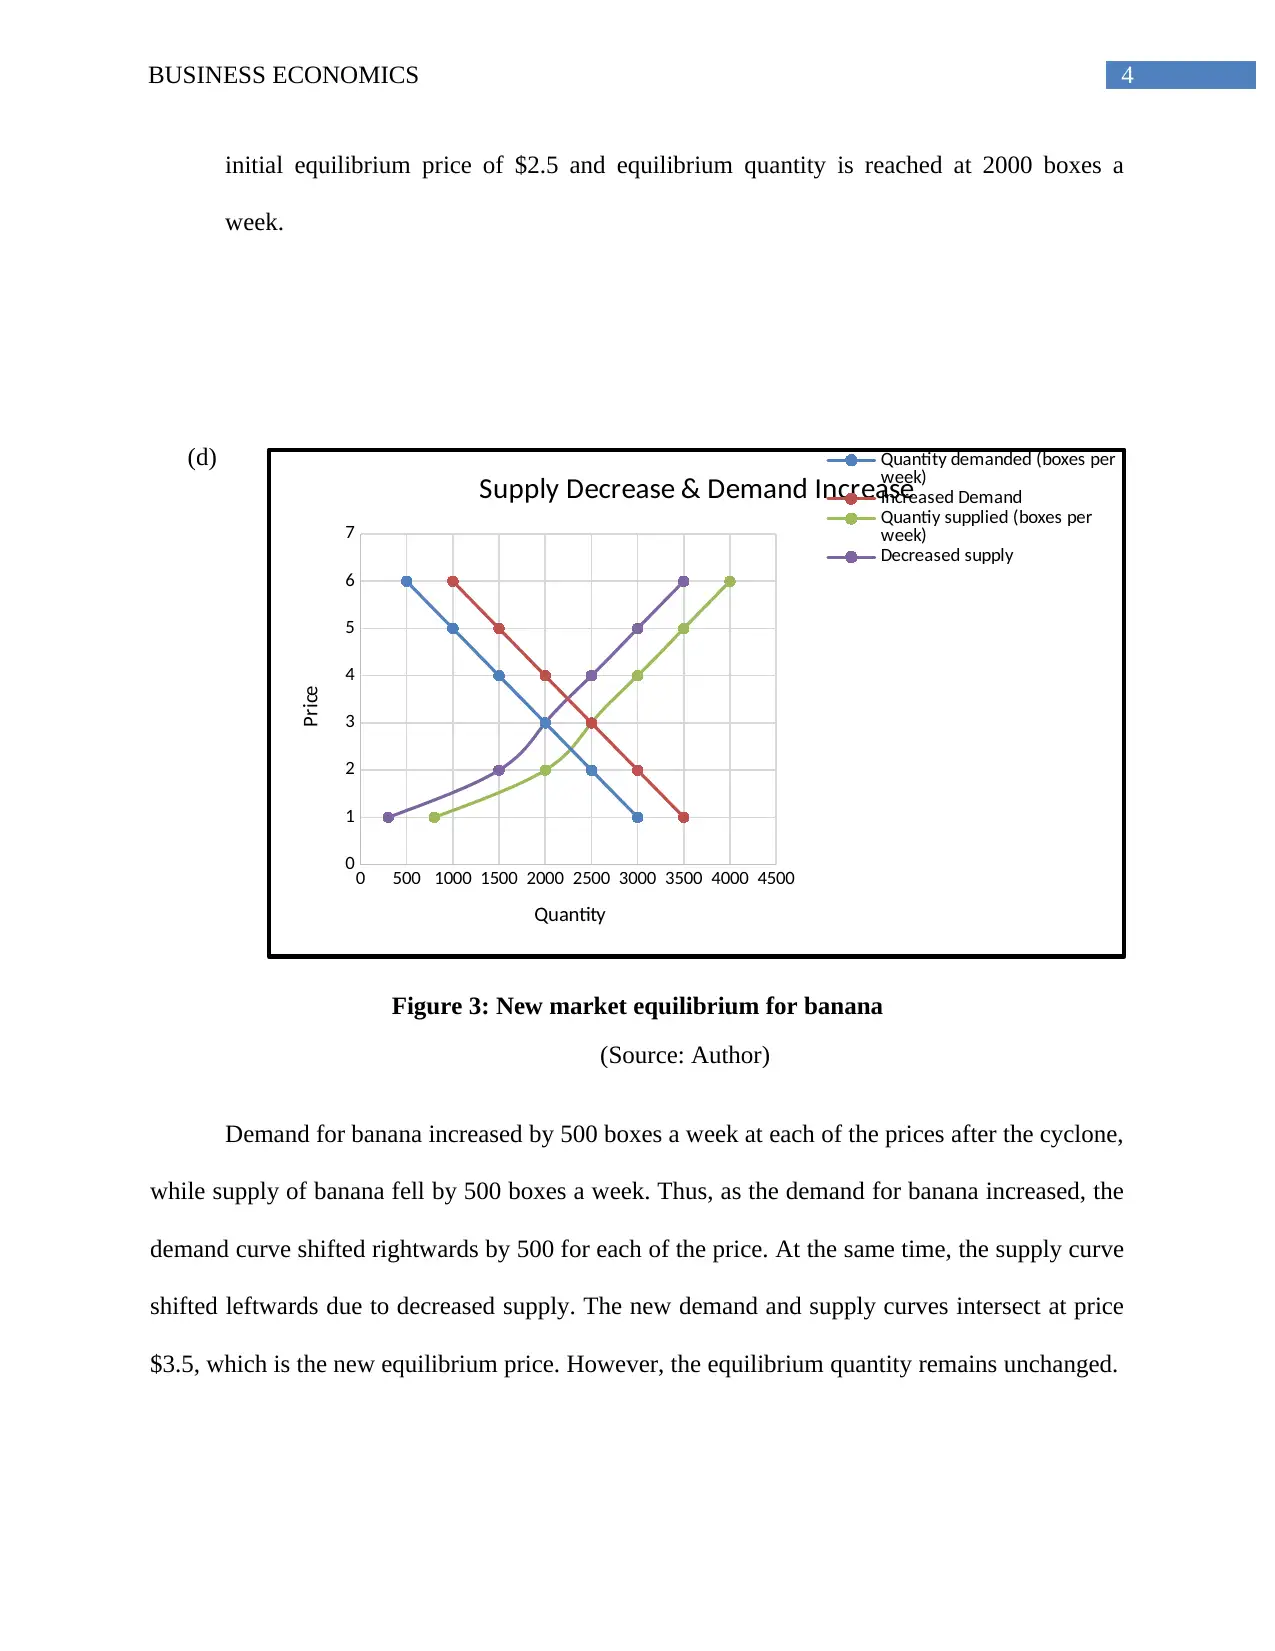
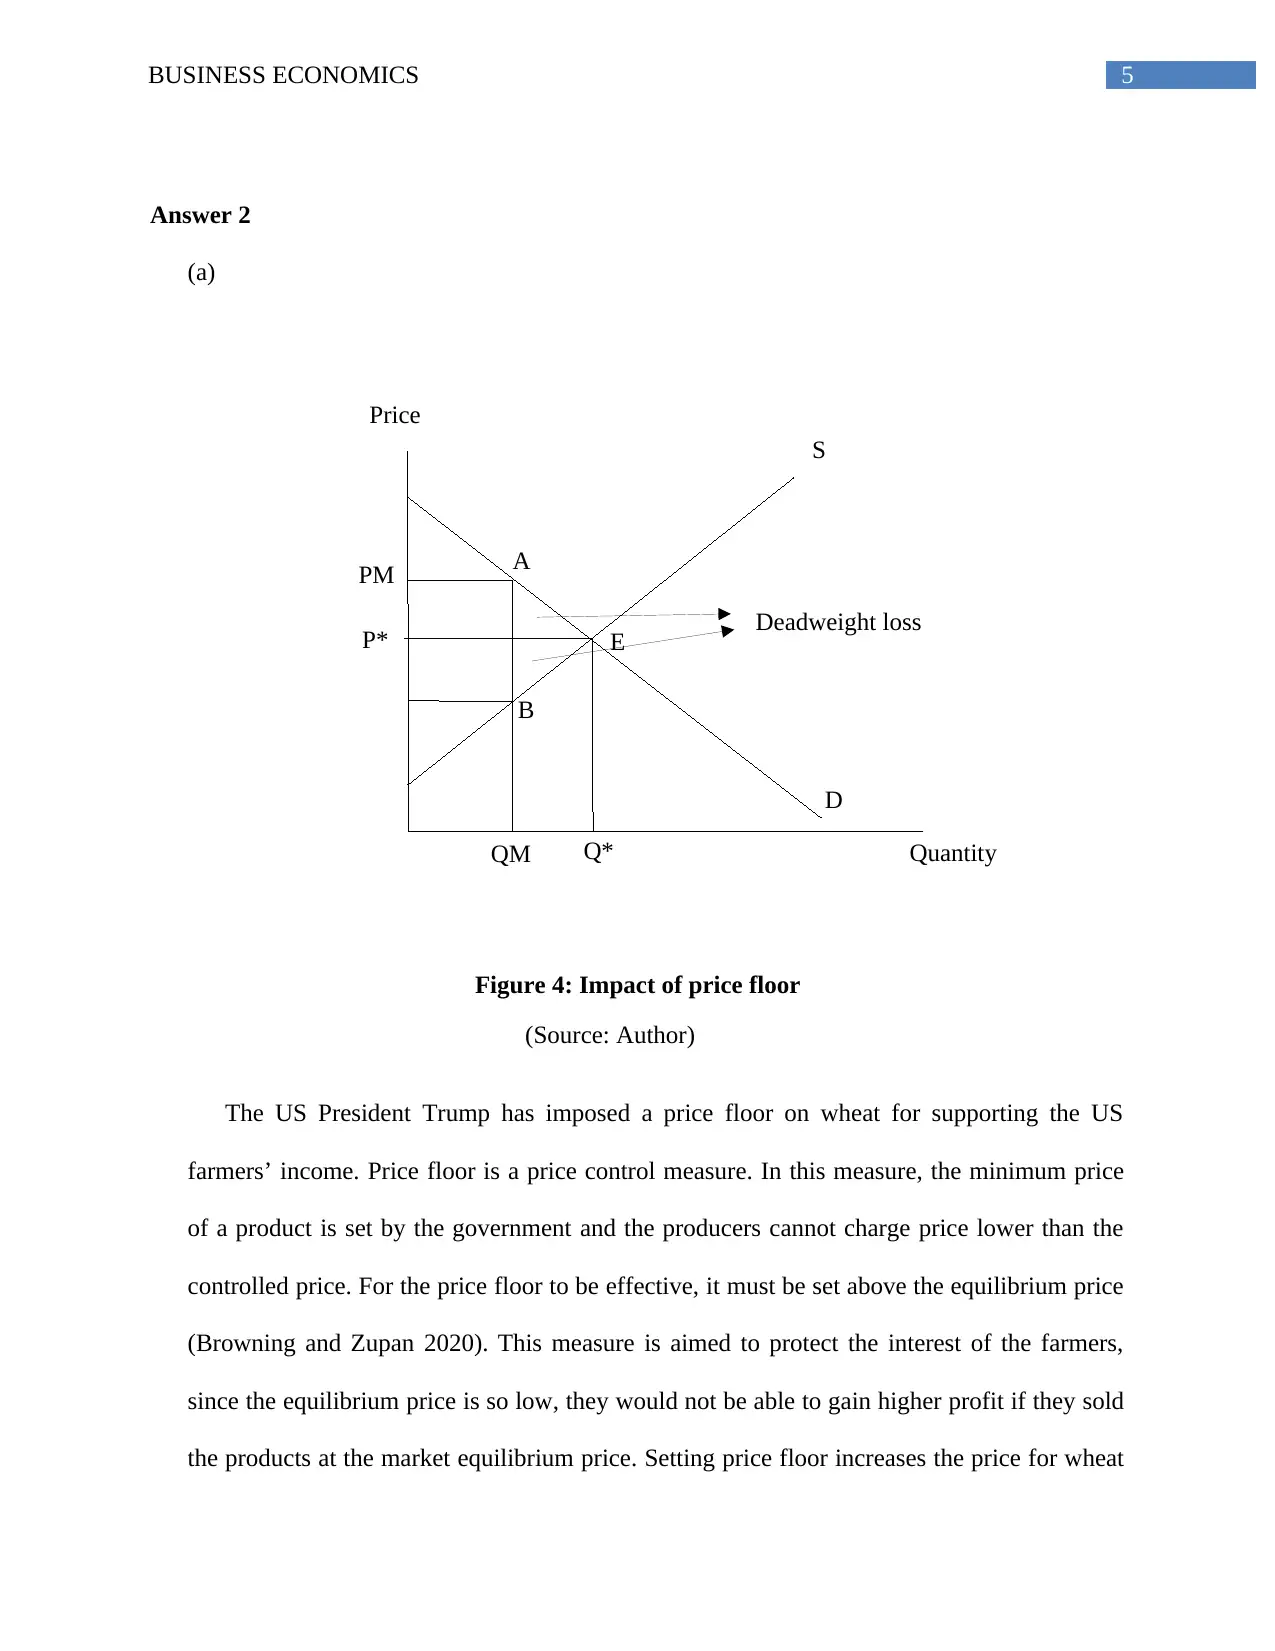
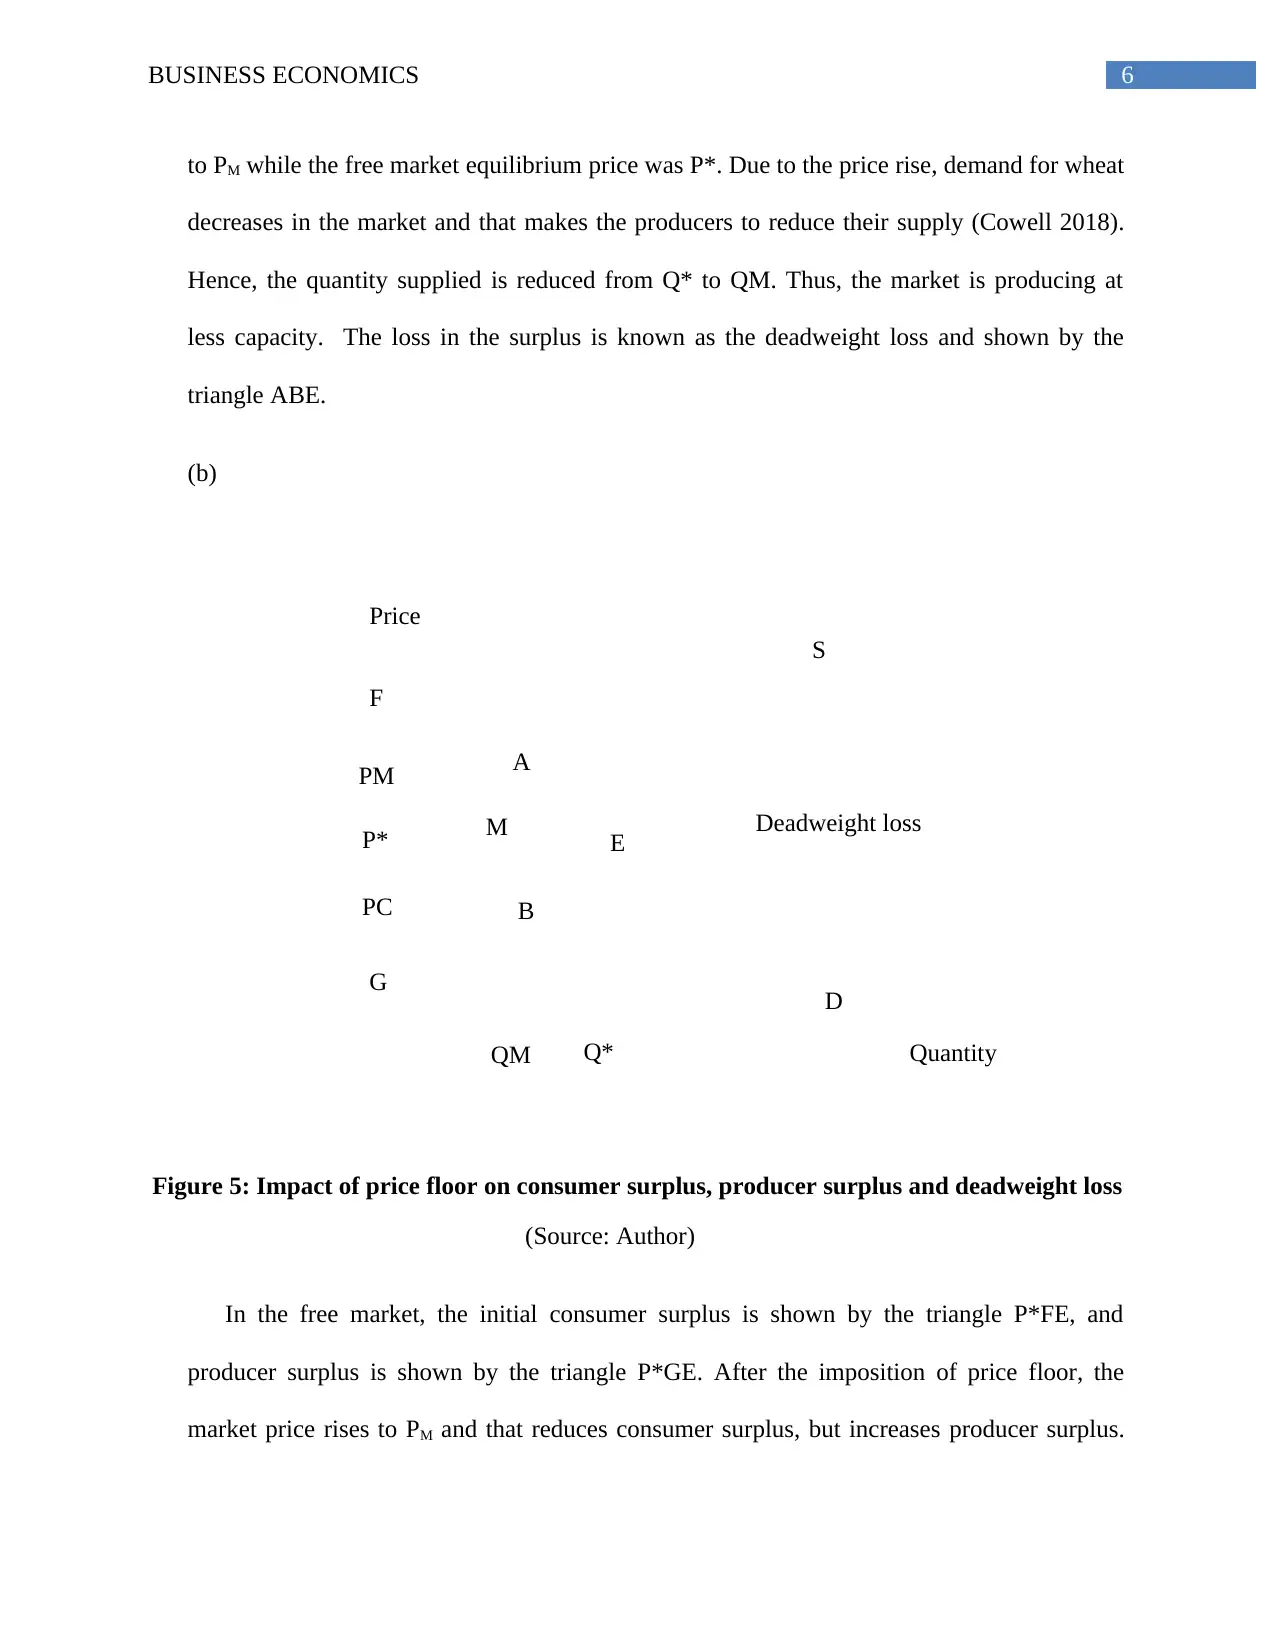
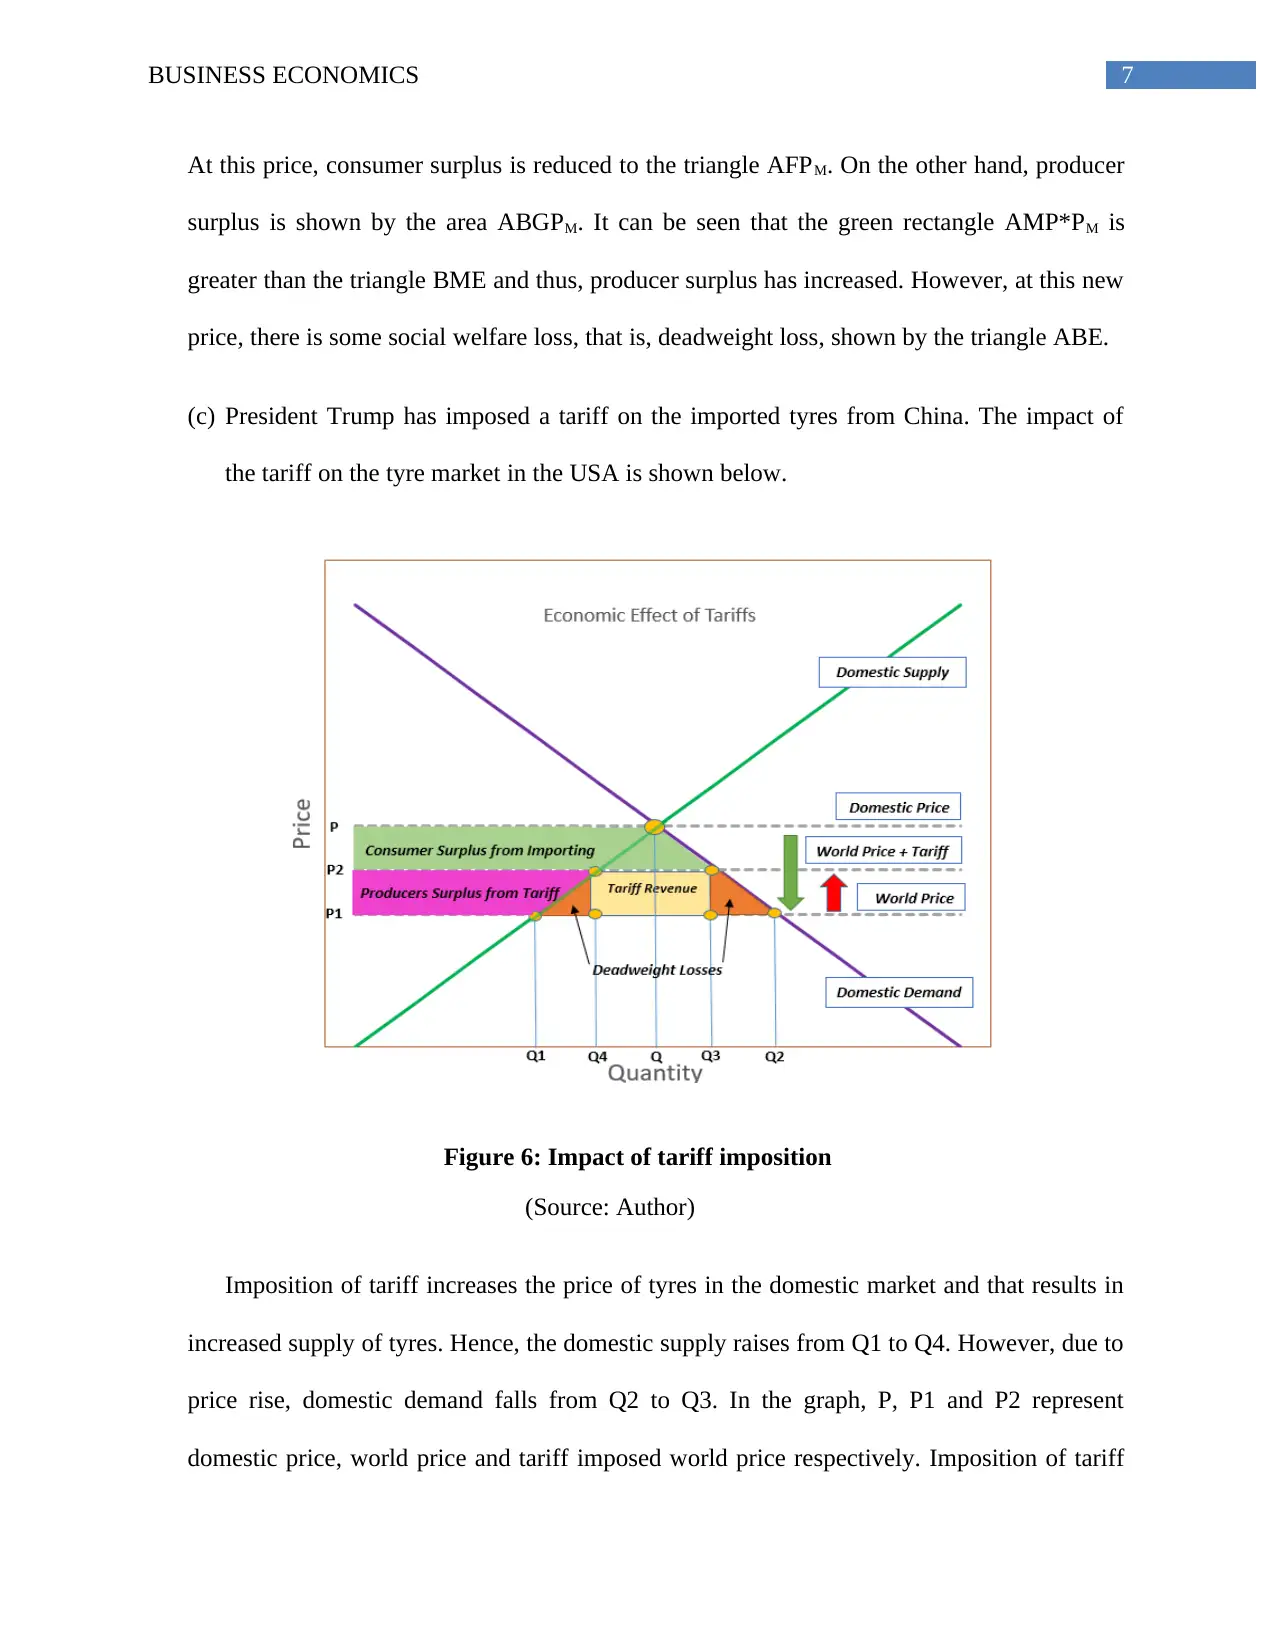
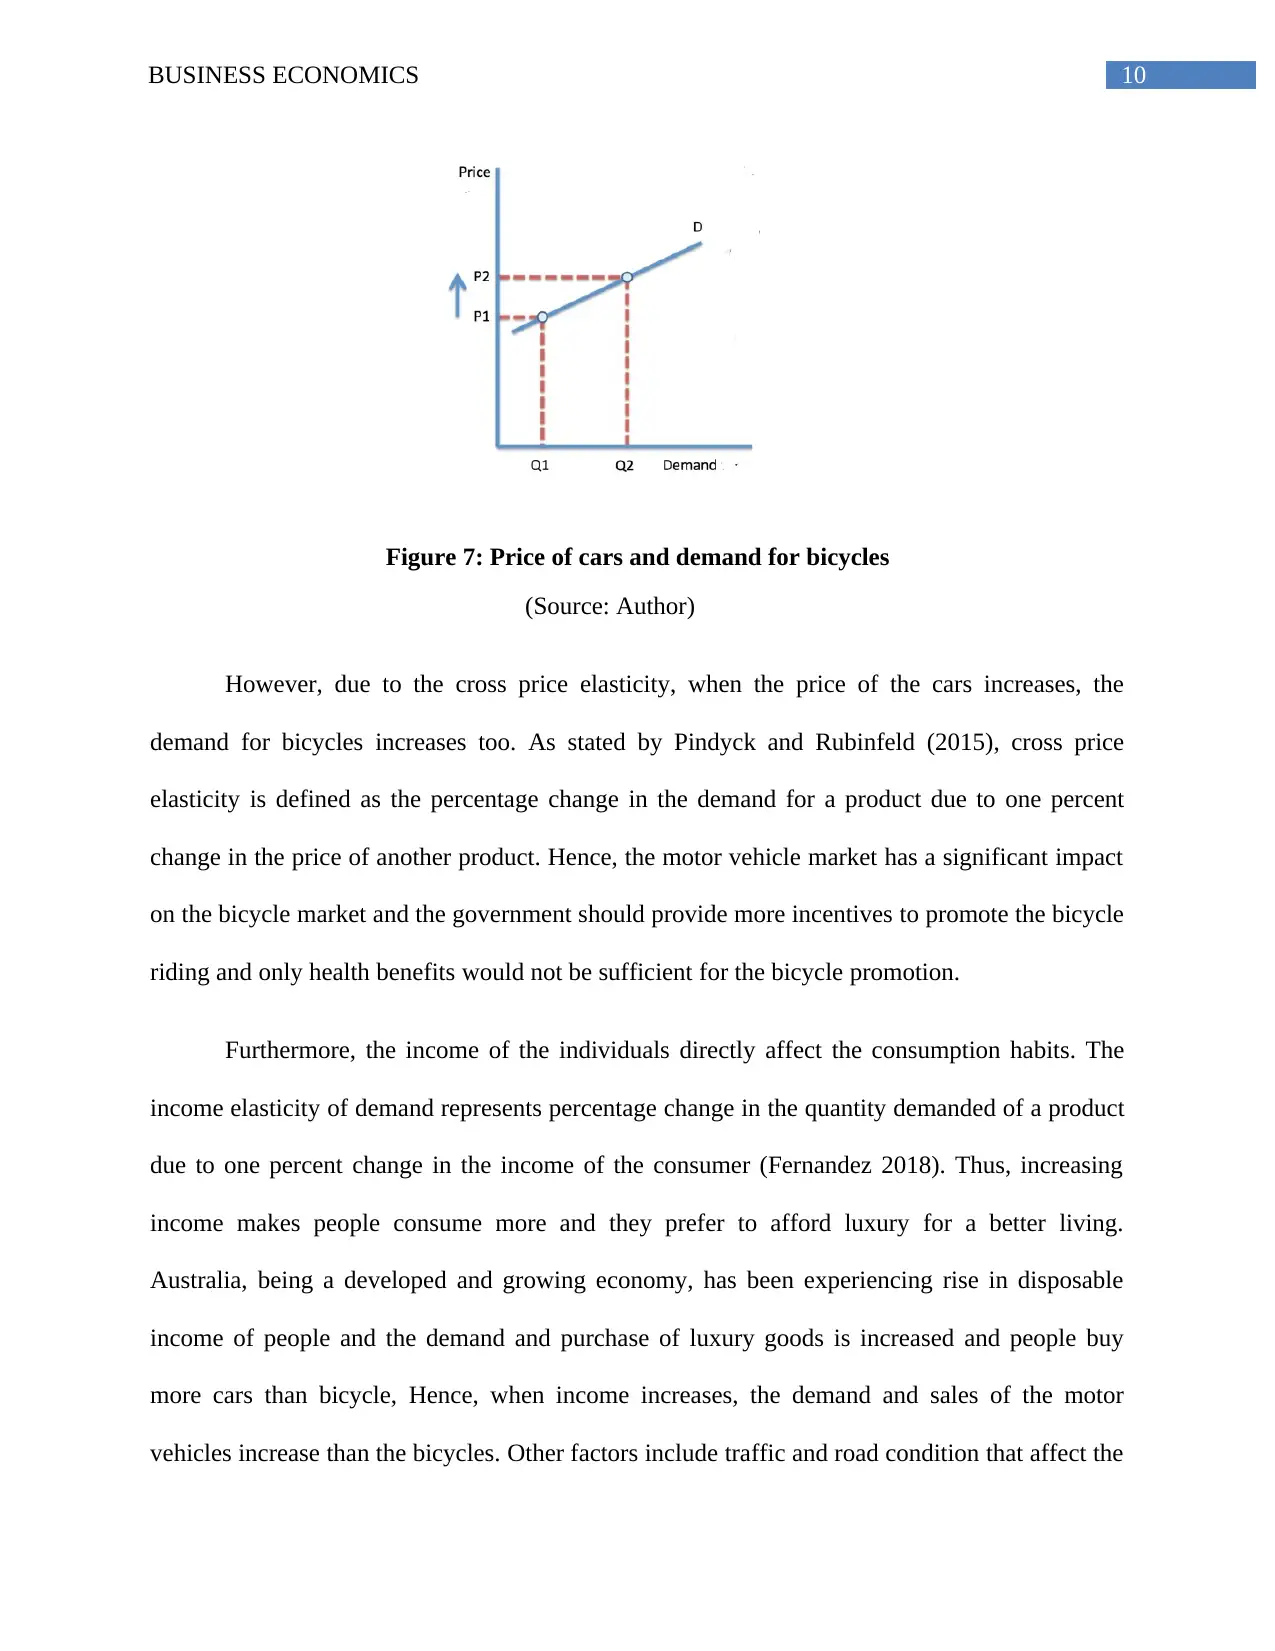
This business economics report delves into various aspects of market analysis, beginning with the concept of market equilibrium using the banana market as an example, illustrating how shifts in supply and demand affect prices and quantities. The report then explores the implications of price floors and tariffs, specifically analyzing the impact of a price floor on wheat and a tariff on imported tires. It examines how these policies influence consumer and producer surplus, and create deadweight loss. The report further investigates the market for bicycles, considering factors such as petrol prices, consumer income, and the prices of motor vehicles, emphasizing the role of cross-price and income elasticity in shaping bicycle demand. The report concludes by highlighting the importance of incentives to promote bicycle riding, advocating for improved infrastructure and public transport policies to encourage cycling.
Document Page
Running head: BUSINESS ECONOMICS
Business Economics
Name of the Student:
Name of the University:
Author note:
tabler-icon-diamond-filled.svg

Paraphrase This Document

Need a fresh take? Get an instant paraphrase of this document with our AI Paraphraser
Document Page
1BUSINESS ECONOMICS
Table of Contents
Answer 1..........................................................................................................................................2
Answer 2..........................................................................................................................................5
Answer 3..........................................................................................................................................9
References......................................................................................................................................12
Document Page
2BUSINESS ECONOMICS
Answer 1
(a)
Figure 1: Market equilibrium for banana
(Source: Author)
The equilibrium price and quantity for the market of banana are $2.5 and 2250 boxes
per week. A market equilibrium is the point where quantity demanded equals quantity
supplied in the market (Cowell 2018). Hence, in the given market, the demand and supply
curves for banana intersect at price $2.5 for 2250 boxes per week and that is the market
equilibrium.
(b) If the price of banana was $1.50 per box, there would be excess demand in the market as
this price is below the equilibrium price of $2.5. This would create shortage in the market
of banana, that is supply is less than demand.
0 500 1000 1500 2000 2500 3000 3500 4000 4500
0
1
2
3
4
5
6
7
Banana Market
Quantity demanded (boxes per week) Quantiy supplied (boxes per week)
Quantity
Price
Document Page
3BUSINESS ECONOMICS
When shortage exists in the market, the excess demand for the product pushes up
the market price till the quantity demanded becomes equal with the quantity supplied.
The firms would raise their price of banana to get more revenue. Hence, both the price
and quantity supplied in the market would increase.
(c)
Figure 2: Market equilibrium after decreased supply
(Source: Author)
The supply of banana declined due to a cyclone in Queensland, Australia. The fall
in supply is 500 boxes a week for each price level. While the market demand remained
same, the supply curve for the bananas would shift leftward due to the fall in supply.
Shortage in supply creates excess demand in the market and that pushes up the market
price. As shown in the graph above, the equilibrium price rises to $3 a box from the
0 500 1000 1500 2000 2500 3000 3500 4000 4500
0
1
2
3
4
5
6
7
Banana Market After Decrease in Supply
Quantity demanded (boxes
per week)
Quantiy supplied (boxes per
week)
Quantity
Price
tabler-icon-diamond-filled.svg

Paraphrase This Document

Need a fresh take? Get an instant paraphrase of this document with our AI Paraphraser
Document Page
4BUSINESS ECONOMICS
initial equilibrium price of $2.5 and equilibrium quantity is reached at 2000 boxes a
week.
(d)
Figure 3: New market equilibrium for banana
(Source: Author)
Demand for banana increased by 500 boxes a week at each of the prices after the cyclone,
while supply of banana fell by 500 boxes a week. Thus, as the demand for banana increased, the
demand curve shifted rightwards by 500 for each of the price. At the same time, the supply curve
shifted leftwards due to decreased supply. The new demand and supply curves intersect at price
$3.5, which is the new equilibrium price. However, the equilibrium quantity remains unchanged.
0 500 1000 1500 2000 2500 3000 3500 4000 4500
0
1
2
3
4
5
6
7
Supply Decrease & Demand Increase
Quantity demanded (boxes per
week)
Increased Demand
Quantiy supplied (boxes per
week)
Decreased supply
Quantity
Price
Document Page
5BUSINESS ECONOMICS
Price
Quantity
S
D
Deadweight loss
P*
PM
Q*QM
A
B
E
Answer 2
(a)
Figure 4: Impact of price floor
(Source: Author)
The US President Trump has imposed a price floor on wheat for supporting the US
farmers’ income. Price floor is a price control measure. In this measure, the minimum price
of a product is set by the government and the producers cannot charge price lower than the
controlled price. For the price floor to be effective, it must be set above the equilibrium price
(Browning and Zupan 2020). This measure is aimed to protect the interest of the farmers,
since the equilibrium price is so low, they would not be able to gain higher profit if they sold
the products at the market equilibrium price. Setting price floor increases the price for wheat
Document Page
6BUSINESS ECONOMICS
Price
Quantity
S
D
Deadweight loss
P*
PM
Q*QM
A
B
E
PC
F
G
M
to PM while the free market equilibrium price was P*. Due to the price rise, demand for wheat
decreases in the market and that makes the producers to reduce their supply (Cowell 2018).
Hence, the quantity supplied is reduced from Q* to QM. Thus, the market is producing at
less capacity. The loss in the surplus is known as the deadweight loss and shown by the
triangle ABE.
(b)
Figure 5: Impact of price floor on consumer surplus, producer surplus and deadweight loss
(Source: Author)
In the free market, the initial consumer surplus is shown by the triangle P*FE, and
producer surplus is shown by the triangle P*GE. After the imposition of price floor, the
market price rises to PM and that reduces consumer surplus, but increases producer surplus.
tabler-icon-diamond-filled.svg

Paraphrase This Document

Need a fresh take? Get an instant paraphrase of this document with our AI Paraphraser
Document Page
7BUSINESS ECONOMICS
At this price, consumer surplus is reduced to the triangle AFPM. On the other hand, producer
surplus is shown by the area ABGPM. It can be seen that the green rectangle AMP*PM is
greater than the triangle BME and thus, producer surplus has increased. However, at this new
price, there is some social welfare loss, that is, deadweight loss, shown by the triangle ABE.
(c) President Trump has imposed a tariff on the imported tyres from China. The impact of
the tariff on the tyre market in the USA is shown below.
Figure 6: Impact of tariff imposition
(Source: Author)
Imposition of tariff increases the price of tyres in the domestic market and that results in
increased supply of tyres. Hence, the domestic supply raises from Q1 to Q4. However, due to
price rise, domestic demand falls from Q2 to Q3. In the graph, P, P1 and P2 represent
domestic price, world price and tariff imposed world price respectively. Imposition of tariff
Document Page
8BUSINESS ECONOMICS
resulted in tariff revenue, which is collected by the government. Producer surplus, depicted
by the pink rectangle, increases but there is deadweight loss. Hence, the domestic producers
are the clear winners and consumers are the losers. The situation of the government is
however ambiguous.
(d) The policies of price floor and import tariff are not fair and efficient as these policies
cause social welfare loss and loss of consumer surplus. In case of free market, both the
producers and consumers earn parts of the surplus, and as the producers meet the demand
of every customer, there is no excess demand in the market (Serrano and Feldman 2018).
Hence, there is equality and fairness in the market. However, tariff and price floor are
price control measures, which lead to loss of economic surplus. Only few producers are
better off in case of these measures while the consumers and the society face losses. Due
to the price rise owing to these measures, demand of many customers remain unfulfilled
and thus, the rule of fairness is not applicable in case of price floor and tariff.
(e) In case of price floor, each party in the market is losing and hence, this policy should be
abandoned. On the other hand, in case of tariff, the surplus of the domestic producers is
increasing and the government is earning revenue. There is deadweight loss but the
amount is less. However, tariff can be imposed for short run to save the domestic
producers.
Document Page
9BUSINESS ECONOMICS
Answer 3
The ACPF expects the proportion of Australians riding bicycles regularly would rise
from 33% to 66%. This implies that more number of motor vehicle riders would switch their
mode of transport to bicycles. Using bicycles for riding is also a sustainable and environment
friendly measure, which is also highly beneficial for health and fitness. However, there are many
factors that affect the demand for bicycles. Other than the petrol price, income of the consumers,
price of motor vehicles, consumer awareness on health benefits of bicycle riding, production
level and market supply of bicycles are some of the important factors that have a significant
impact on the bicycle usage. This report will provide a synopsis of the market and price factors
of bicycles, the price elasticities and the importance of providing incentives for cycling.
The motor vehicle market is booming. Due to high production, the price of motor vehicle
has become affordable to majority of people and thus, the number of automobiles on the roads
has been increasing substantially. The motor vehicles are a faster mode of transportation than the
bicycles and thus, it is a time saving transportation, useful especially for long distance travel.
Therefore, a decline in the price of petrol and maintenance cost of the automobiles would result
in the reduction of the overall price of the cars in the industry. This is so because these are
complementary goods, and when the price of one product increases, the demand for the
complementary good decreases (Pindyck and Rubinfeld 2015). Therefore, when the price of the
motor vehicles falls, that would increase the demand for the vehicles and reduce the demand for
the bicycles, which are substitute products (Wen et al. 2018).
tabler-icon-diamond-filled.svg

Paraphrase This Document

Need a fresh take? Get an instant paraphrase of this document with our AI Paraphraser
Document Page
10BUSINESS ECONOMICS
Figure 7: Price of cars and demand for bicycles
(Source: Author)
However, due to the cross price elasticity, when the price of the cars increases, the
demand for bicycles increases too. As stated by Pindyck and Rubinfeld (2015), cross price
elasticity is defined as the percentage change in the demand for a product due to one percent
change in the price of another product. Hence, the motor vehicle market has a significant impact
on the bicycle market and the government should provide more incentives to promote the bicycle
riding and only health benefits would not be sufficient for the bicycle promotion.
Furthermore, the income of the individuals directly affect the consumption habits. The
income elasticity of demand represents percentage change in the quantity demanded of a product
due to one percent change in the income of the consumer (Fernandez 2018). Thus, increasing
income makes people consume more and they prefer to afford luxury for a better living.
Australia, being a developed and growing economy, has been experiencing rise in disposable
income of people and the demand and purchase of luxury goods is increased and people buy
more cars than bicycle, Hence, when income increases, the demand and sales of the motor
vehicles increase than the bicycles. Other factors include traffic and road condition that affect the
Document Page
11BUSINESS ECONOMICS
demand for bicycles. These are slower mode of transport than the cars and therefore riding
bicycle is time consuming. Thus, road condition should be improved and traffic should be
controlled efficiently to encourage people to ride more bicycles. Moreover, the fare of the public
transport should be increased to promote bicycle rides.
chevron_up_icon
1 out of 13
circle_padding
hide_on_mobile
zoom_out_icon
[object Object]