Economics 23 Assignment: Market Analysis and Elasticity
VerifiedAdded on 2020/05/28
|24
|3778
|207
Homework Assignment
AI Summary
This economics assignment provides a comprehensive analysis of market dynamics, elasticity, and government interventions. Section A delves into market equilibrium, comparative advantage, and the impact of price controls. It examines the concepts of supply and demand, illustrating how various factors influence market prices and quantities. The assignment then explores market failures, discussing government tools such as subsidies, taxation, and price controls to address inefficiencies. Section B shifts the focus to production costs, the relationship between total, marginal, and average product, and optimization in production. The assignment also includes a discussion on how changes in input costs affect supply, and how external events influence demand. The assignment uses graphs and examples to illustrate key economic concepts and their practical applications.
Running Head: ASSIGNMENT FOR ECONOMICS
Assignment for economics
Name of the Student
Name of the University
Author Note
Assignment for economics
Name of the Student
Name of the University
Author Note
Paraphrase This Document
Need a fresh take? Get an instant paraphrase of this document with our AI Paraphraser
1
ASSIGNMENT FOR ECONOMICS
Table of Contents
Section A:..................................................................................................................................2
Answer to question 1:................................................................................................................2
Answer to question 2:................................................................................................................3
Answer to question 3:................................................................................................................4
Answer to question 4:................................................................................................................6
Section B:...................................................................................................................................8
Answer to question 1:................................................................................................................8
Answer to question 2:..............................................................................................................12
Answer to question 3:..............................................................................................................18
2
ASSIGNMENT FOR ECONOMICS
Section A:
Answer to question 1:
a) Without international trade, there will be equilibrium in the domestic market. That is at
this level, quantity demanded of rise will be equal to quantity supplied. Quantity demanded of
rose is equal to quantity supplied at US $ 175 per container.
b) At price US $ 175, UAE has comparative advantage in producing roses compared to rest
of the world, as wholesaler can get roses at lowest price within their domestic country.
c) The lowest possible price cannot be less than $ 125 where roses can be purchased in
auction. Hence, if wholesalers buy rose at $ 125, then they will get only 2 million containers of
roses and they need to import 10 million containers.
Answer to question 2:
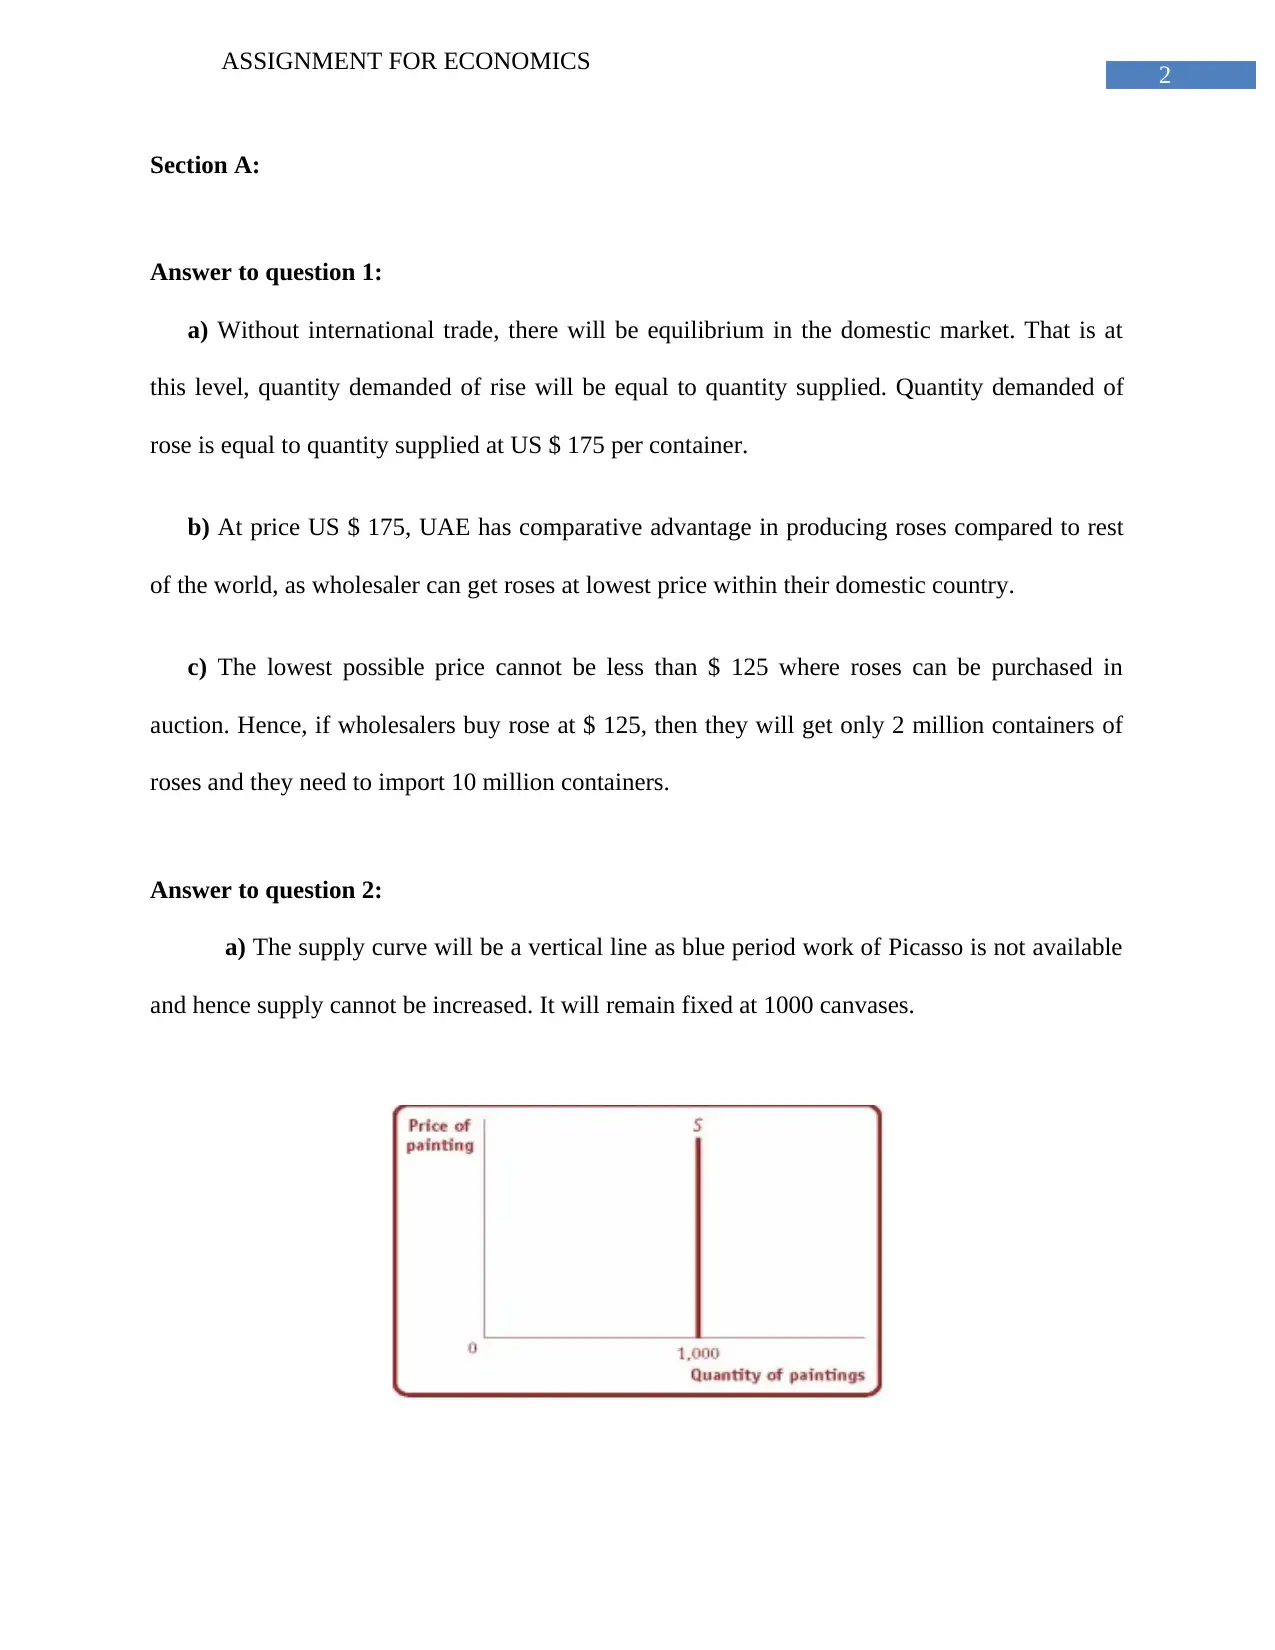
a) The supply curve will be a vertical line as blue period work of Picasso is not available
and hence supply cannot be increased. It will remain fixed at 1000 canvases.
ASSIGNMENT FOR ECONOMICS
Section A:
Answer to question 1:
a) Without international trade, there will be equilibrium in the domestic market. That is at
this level, quantity demanded of rise will be equal to quantity supplied. Quantity demanded of
rose is equal to quantity supplied at US $ 175 per container.
b) At price US $ 175, UAE has comparative advantage in producing roses compared to rest
of the world, as wholesaler can get roses at lowest price within their domestic country.
c) The lowest possible price cannot be less than $ 125 where roses can be purchased in
auction. Hence, if wholesalers buy rose at $ 125, then they will get only 2 million containers of
roses and they need to import 10 million containers.
Answer to question 2:
a) The supply curve will be a vertical line as blue period work of Picasso is not available
and hence supply cannot be increased. It will remain fixed at 1000 canvases.
⊘ This is a preview!⊘
Do you want full access?
Subscribe today to unlock all pages.
Trusted by 1+ million students worldwide
3
ASSIGNMENT FOR ECONOMICS
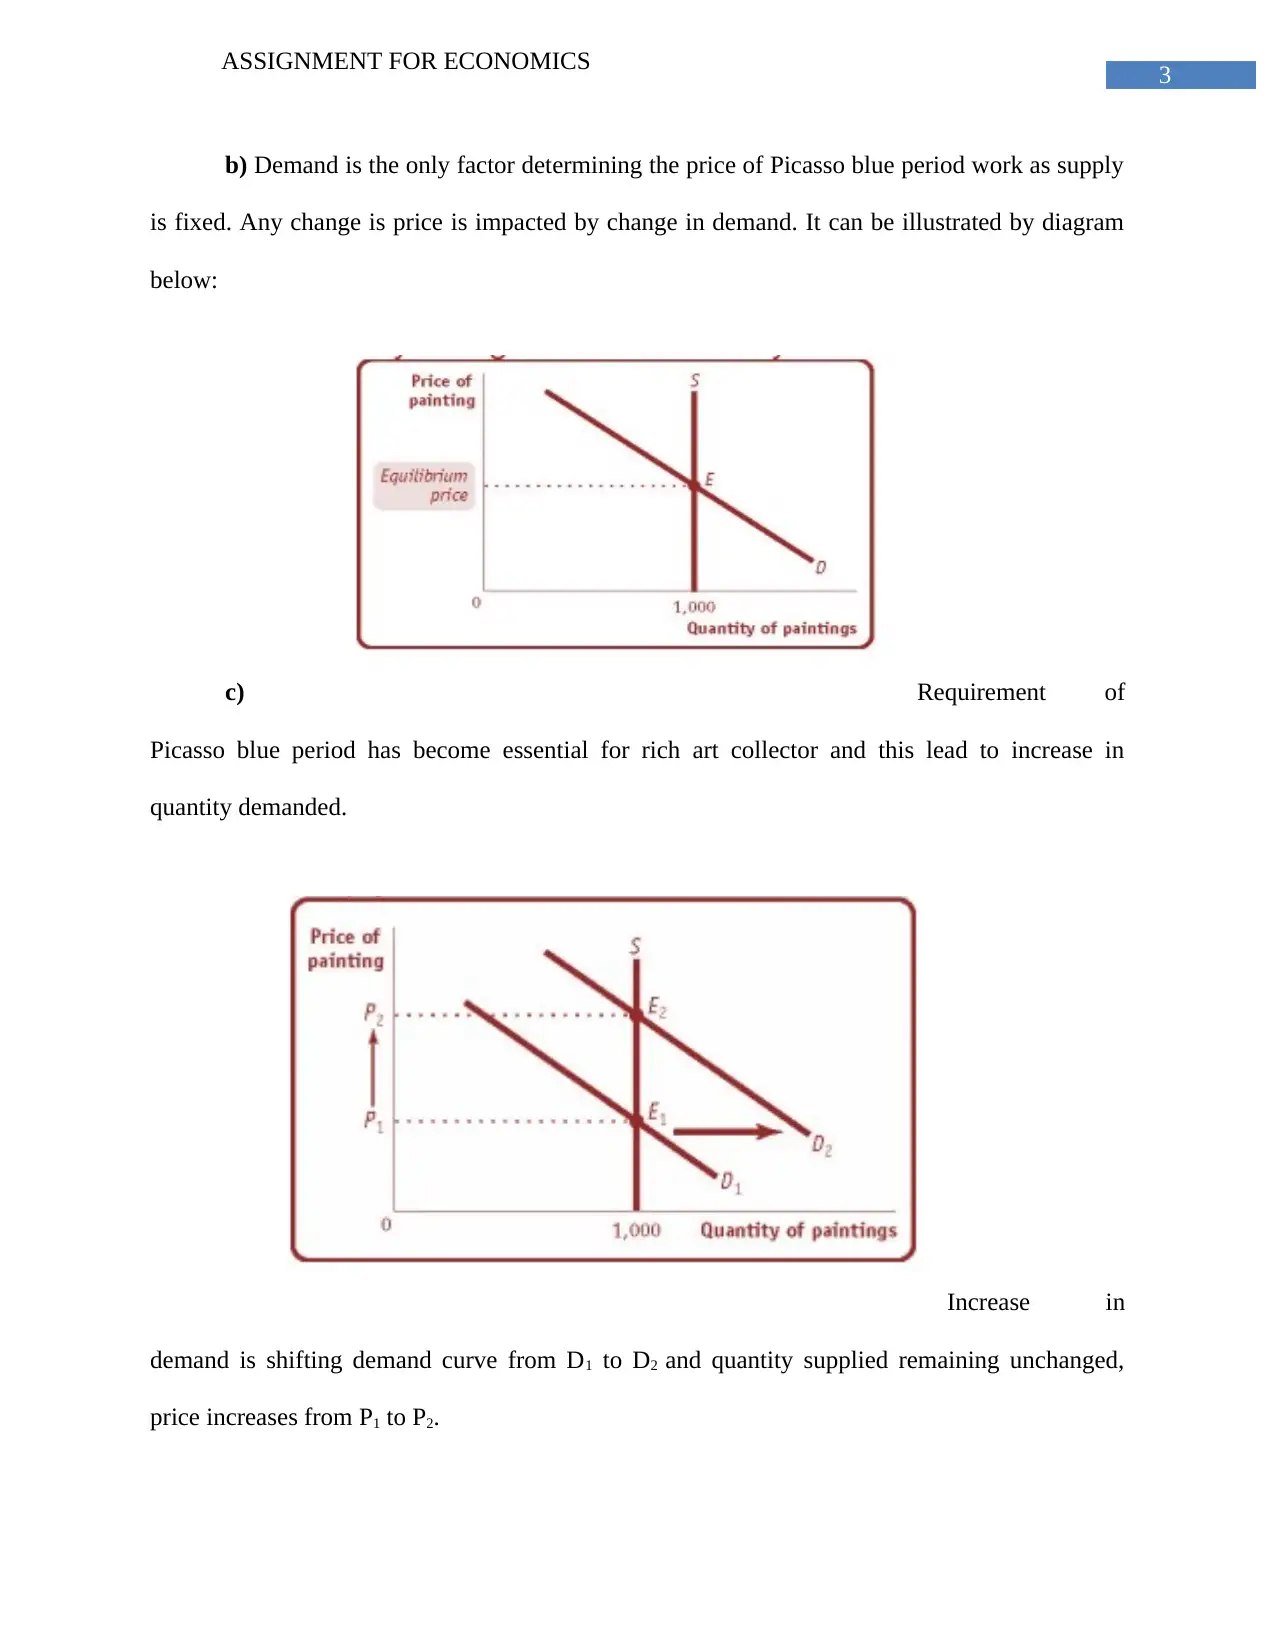
b) Demand is the only factor determining the price of Picasso blue period work as supply
is fixed. Any change is price is impacted by change in demand. It can be illustrated by diagram
below:
c) Requirement of
Picasso blue period has become essential for rich art collector and this lead to increase in
quantity demanded.
Increase in
demand is shifting demand curve from D1 to D2 and quantity supplied remaining unchanged,
price increases from P1 to P2.
ASSIGNMENT FOR ECONOMICS
b) Demand is the only factor determining the price of Picasso blue period work as supply
is fixed. Any change is price is impacted by change in demand. It can be illustrated by diagram
below:
c) Requirement of
Picasso blue period has become essential for rich art collector and this lead to increase in
quantity demanded.
Increase in
demand is shifting demand curve from D1 to D2 and quantity supplied remaining unchanged,
price increases from P1 to P2.
Paraphrase This Document
Need a fresh take? Get an instant paraphrase of this document with our AI Paraphraser
4
ASSIGNMENT FOR ECONOMICS
Answer to question 3:
Market failure occurs due to inefficient resources distribution that is dealt by government
through adoption of various tools and responding to market failures to varying degrees. Some of
the tools that are taken by government for dealing with market failures are as follows:
Direct provision of merit and public goods- Goods supply that have positive externalities
can be controlled by government by way of supplying high amounts of parks, education
and libraries to public. Community benefits of public goods can be maximized by
intervention of government in regulation, production, management and maintenance. It
would also help in congestion or over exploitation of resources. Allocative inefficiency
in allocation of resources of merit goods such as healthcare and education can be done by
government intervention by way of subsidization (Patterson 2015). This will help in
dealing with market inefficiency of such goods.
Subsidies- Government takes the measures of reducing goods price that is based on
benefits received by public. This particular tool is considered appropriate for encouraging
behavior generating positive externalities. Subsidy tool enables consumers paying the
price that is socially efficient comprising of external benefits and thereby leading to
greater social efficiency. Government efforts to subsidize public transport will motivate
people to use public transport and reducing negative externalities of private vehicles
(Feenstra 2015).
5
ASSIGNMENT FOR ECONOMICS
Taxation- Government to deal with inefficiency in market intends to place taxes on
certain goods that would assist in discouraging its usage and leading to external cost
internalization (Hursh and Roma 2016). This can be explained with the help of an
example, taxing tobacco products and this would have subsequent impact on tobacco
consumption cost that is leading to increase in consumption cost.
Property rights extension and tradable permits- Government take measures for creating
privatization of some public goods such as rivers, lakes and beaches and this is intended
to create market for pollution of these non private goods. Fines are imposed on
individuals for polluting these areas. Tradable permits is another considerable tool
intended to create market efficiency that gives firms permission to produce something
called pollution in association with goods production (Gwartney et al. 2014). In order to
increase or decrease the production, any one firm can trade permits with one another.
This helps in reducing pollution as it is the basis behind cap and trade.
Controlling domestic price movements (Maximum and Minimum price)- One of the
intervention measures of government to deal with market failure is imposition of price
control. Government might impose price ceiling if the market clearing price for services
and goods is considerably higher. Price ceiling imposition is the setting of maximum
legal limit price of goods and services. Such ceiling is imposed on merit and essential
goods and monopolist charging unusual higher price. Railway industry can increase the
tickets price to an unreasonable extent because of monopoly power. Imposition of
maximum price by government will assist in keeping tickets at reasonable level. In case
of minimum price, government takes the effort of setting minimum legal limit for
particular goods and services. This particular measure is undertaken by government to
⊘ This is a preview!⊘
Do you want full access?
Subscribe today to unlock all pages.
Trusted by 1+ million students worldwide
6
ASSIGNMENT FOR ECONOMICS
provide assistance to some producers seeking assistance whose products are being sold at
significantly lower price in an unfair market. Goods surplus created in the market can be
eliminated by government efforts to buy excess supply at minimum price (Godelier
2014). This will help market in attaining equilibrium level by shifting of demand curve.
Example of setting minimum price is protecting workers by setting of minimum wages.
Setting of minimum wage would help in ensuring that enough is earned by workers that
would lead to their reasonable existence.
Answer to question 4:
Demand elasticity measures the responsiveness of change in quantity demanded of
products to alterations in any particular factor impacting demand of goods while keeping other
factors constant. There are three types of elasticity for demand that is price elasticity of demand,
income elasticity of demand and cross price elasticity of demand. When there is sensitivity of
changes in quantity demanded due to change in price, then demand change is said to be price
elastic. Change in quantity demanded resulting from change in income is income elasticity of
demand. Cross price elasticity is the change in demand of one product resulting from change in
price of another product.
Price elasticity of demand- Price elasticity of demand is the degree of responsiveness of
change in quantity demanded resulting from change in price of goods. Price elasticity of demand
is obtained by dividing ratio of percentage change in any goods quantity demanded by
percentage change in price of that particular good. The formulae for calculating price elasticity
of goods is
Paraphrase This Document
Need a fresh take? Get an instant paraphrase of this document with our AI Paraphraser
7
ASSIGNMENT FOR ECONOMICS
Price elasticity of demand (Ed)= % age change in quantity of product demanded /% age
change in price of product
There are three types of price elasticity of goods that is elastic, unitary elastic and
inelastic. In elastic demand, value of elasticity is greater than one (Bowen et al. 2015). In case of
unit elastic demand, value of demand elasticity is equal to one. Inelastic demand has elasticity
value less than 1.
Income elasticity of demand- The change in quantity demanded of goods due to change
in income of consumers is income elasticity of demand. It is computed by dividing percentage
change in quantity demanded of goods by percentage change in income. Income elasticity is the
responsiveness of change in quantity demanded for products with respect to change income
while other factors remaining constant (Layson 2015). The formulae for computing income
elasticity of demand is
Income elasticity of demand (Ey)= % age change in quantity of product demanded /% age
change in consumer income
Depending upon categorization of goods whether it is normal or inferior, increase in
income influences change in demand for goods. Income elasticity value for normal goods is less
than one but greater than zero. For inferior goods, value of income elasticity is less than one.
Cross price elasticity of demand- Cross price elasticity of demand is the responsiveness
of change in quantity demanded for a product with respect to change in price of other products
that is related products whether substitutes goods or complementary goods. It is obtained by
dividing percentage change in quantity demanded of any particular good with respect to change
8
ASSIGNMENT FOR ECONOMICS
in price of other goods that is related goods. The formula for measuring cross price elasticity of
demand is
Income elasticity of demand (Emn)= % age change in quantity demanded of product m /%
age change in quantity demanded of product n.
Value of cross price elasticity of demand is positive when two goods are substitutes. This
is so because demand for good will increase due to increase in price of its substitutes. For
example, coffee and tea, demand for tea will increase if price of coffee increases at the same
time. When two goods are complementary goods, then value of cross price elasticity of demand
is negative (Edmond et al. 2014). It can be explained with the help of an example, car and petrol
are two complementary goods and demand for cars will fall if there is an increase in price of
petrol.
Section B:
Answer to question 1:
a)
Optimization point of both the countries are different is machine intensive and other is labor
intensive. The relationship between total product, marginal product and average product can be
explained with the help of graph drawn below:
⊘ This is a preview!⊘
Do you want full access?
Subscribe today to unlock all pages.
Trusted by 1+ million students worldwide
9
ASSIGNMENT FOR ECONOMICS
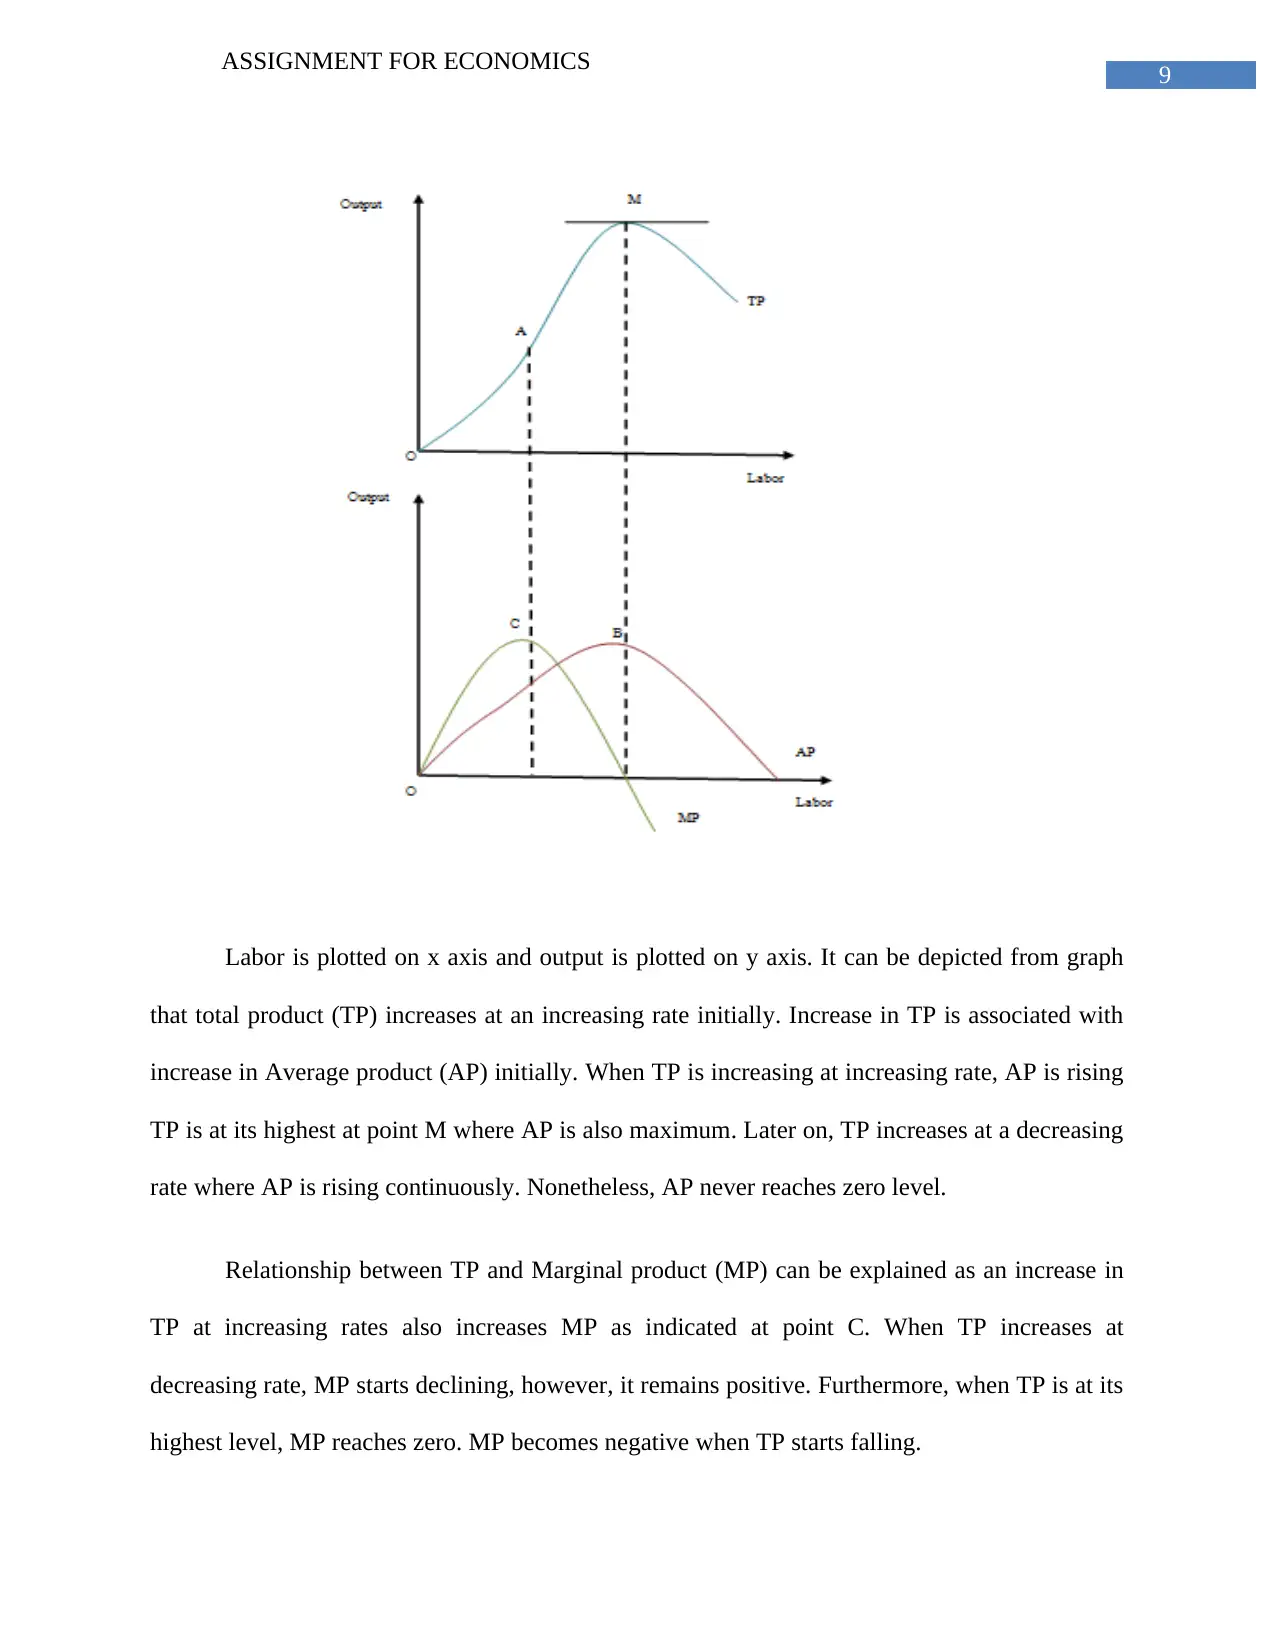
Labor is plotted on x axis and output is plotted on y axis. It can be depicted from graph
that total product (TP) increases at an increasing rate initially. Increase in TP is associated with
increase in Average product (AP) initially. When TP is increasing at increasing rate, AP is rising
TP is at its highest at point M where AP is also maximum. Later on, TP increases at a decreasing
rate where AP is rising continuously. Nonetheless, AP never reaches zero level.
Relationship between TP and Marginal product (MP) can be explained as an increase in
TP at increasing rates also increases MP as indicated at point C. When TP increases at
decreasing rate, MP starts declining, however, it remains positive. Furthermore, when TP is at its
highest level, MP reaches zero. MP becomes negative when TP starts falling.
ASSIGNMENT FOR ECONOMICS
Labor is plotted on x axis and output is plotted on y axis. It can be depicted from graph
that total product (TP) increases at an increasing rate initially. Increase in TP is associated with
increase in Average product (AP) initially. When TP is increasing at increasing rate, AP is rising
TP is at its highest at point M where AP is also maximum. Later on, TP increases at a decreasing
rate where AP is rising continuously. Nonetheless, AP never reaches zero level.
Relationship between TP and Marginal product (MP) can be explained as an increase in
TP at increasing rates also increases MP as indicated at point C. When TP increases at
decreasing rate, MP starts declining, however, it remains positive. Furthermore, when TP is at its
highest level, MP reaches zero. MP becomes negative when TP starts falling.
Paraphrase This Document
Need a fresh take? Get an instant paraphrase of this document with our AI Paraphraser
10
ASSIGNMENT FOR ECONOMICS
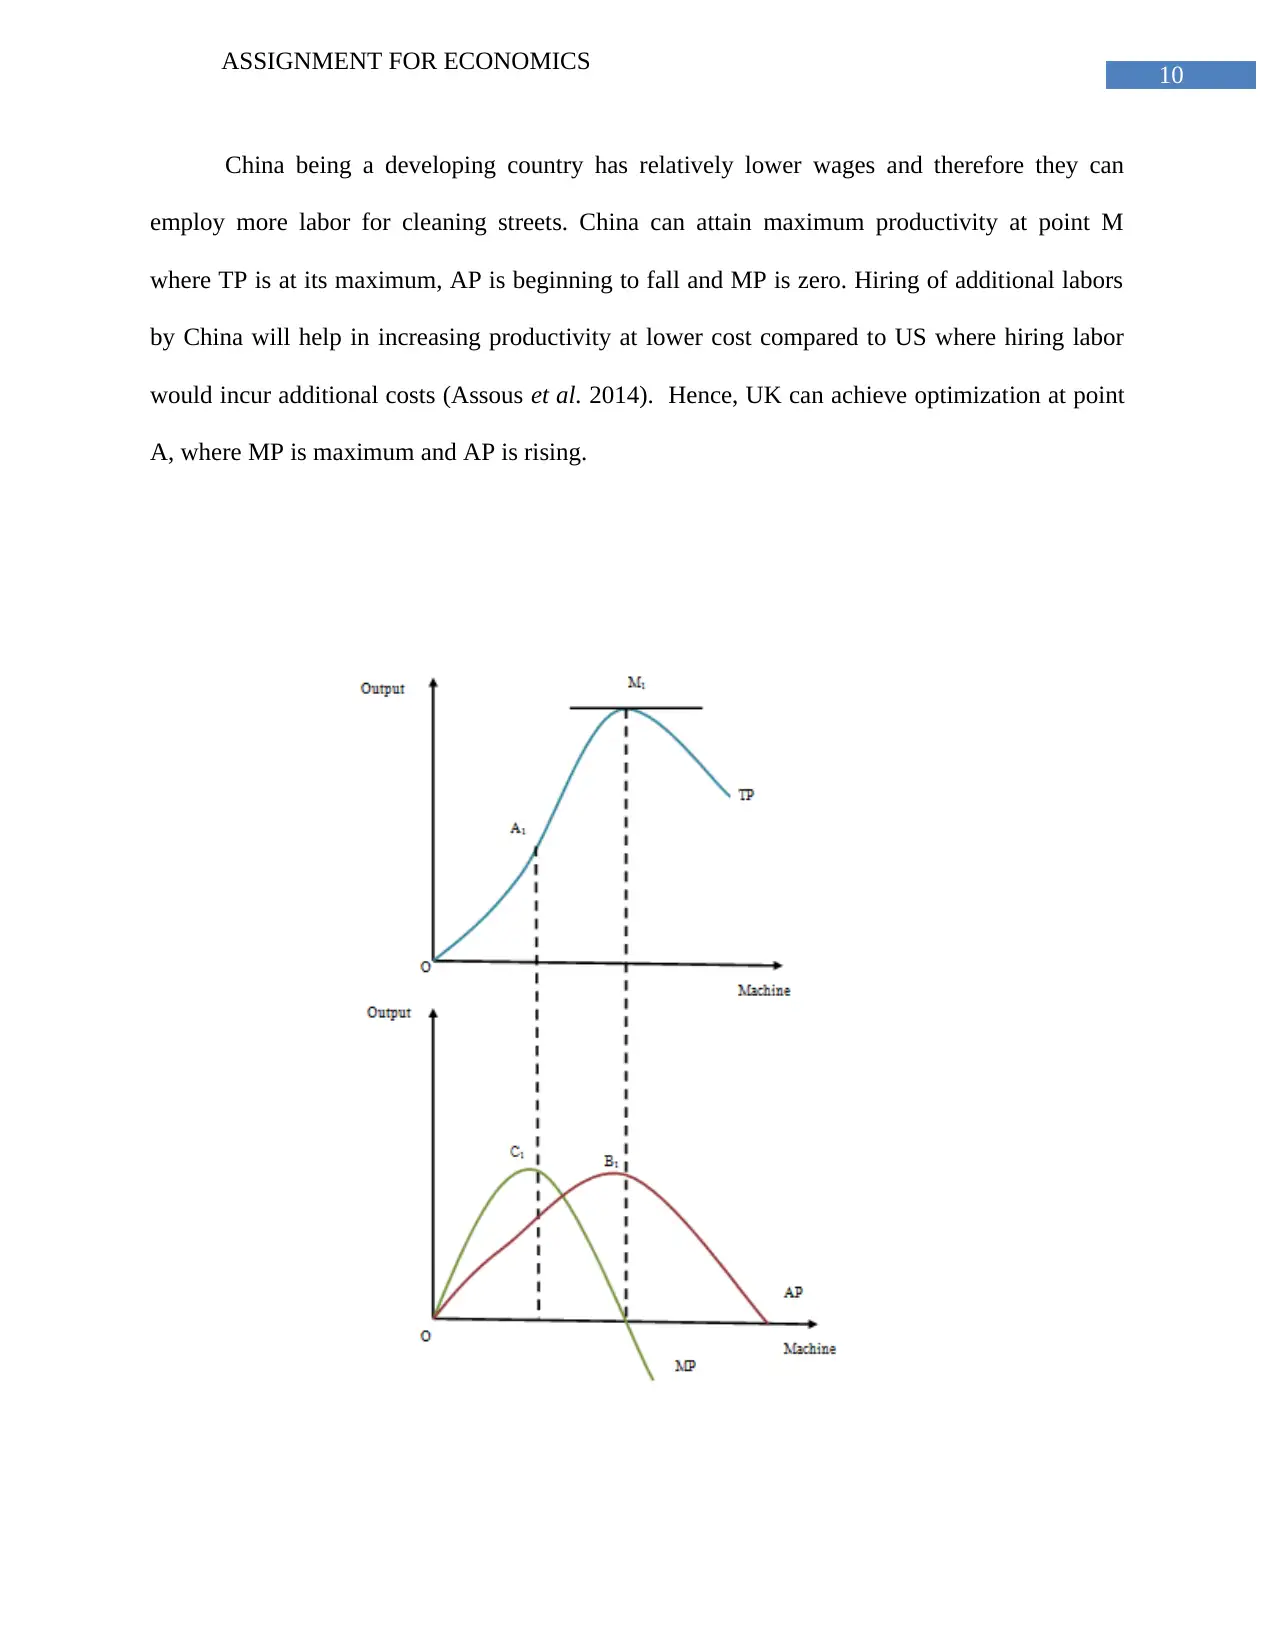
China being a developing country has relatively lower wages and therefore they can
employ more labor for cleaning streets. China can attain maximum productivity at point M
where TP is at its maximum, AP is beginning to fall and MP is zero. Hiring of additional labors
by China will help in increasing productivity at lower cost compared to US where hiring labor
would incur additional costs (Assous et al. 2014). Hence, UK can achieve optimization at point
A, where MP is maximum and AP is rising.
ASSIGNMENT FOR ECONOMICS
China being a developing country has relatively lower wages and therefore they can
employ more labor for cleaning streets. China can attain maximum productivity at point M
where TP is at its maximum, AP is beginning to fall and MP is zero. Hiring of additional labors
by China will help in increasing productivity at lower cost compared to US where hiring labor
would incur additional costs (Assous et al. 2014). Hence, UK can achieve optimization at point
A, where MP is maximum and AP is rising.
11
ASSIGNMENT FOR ECONOMICS
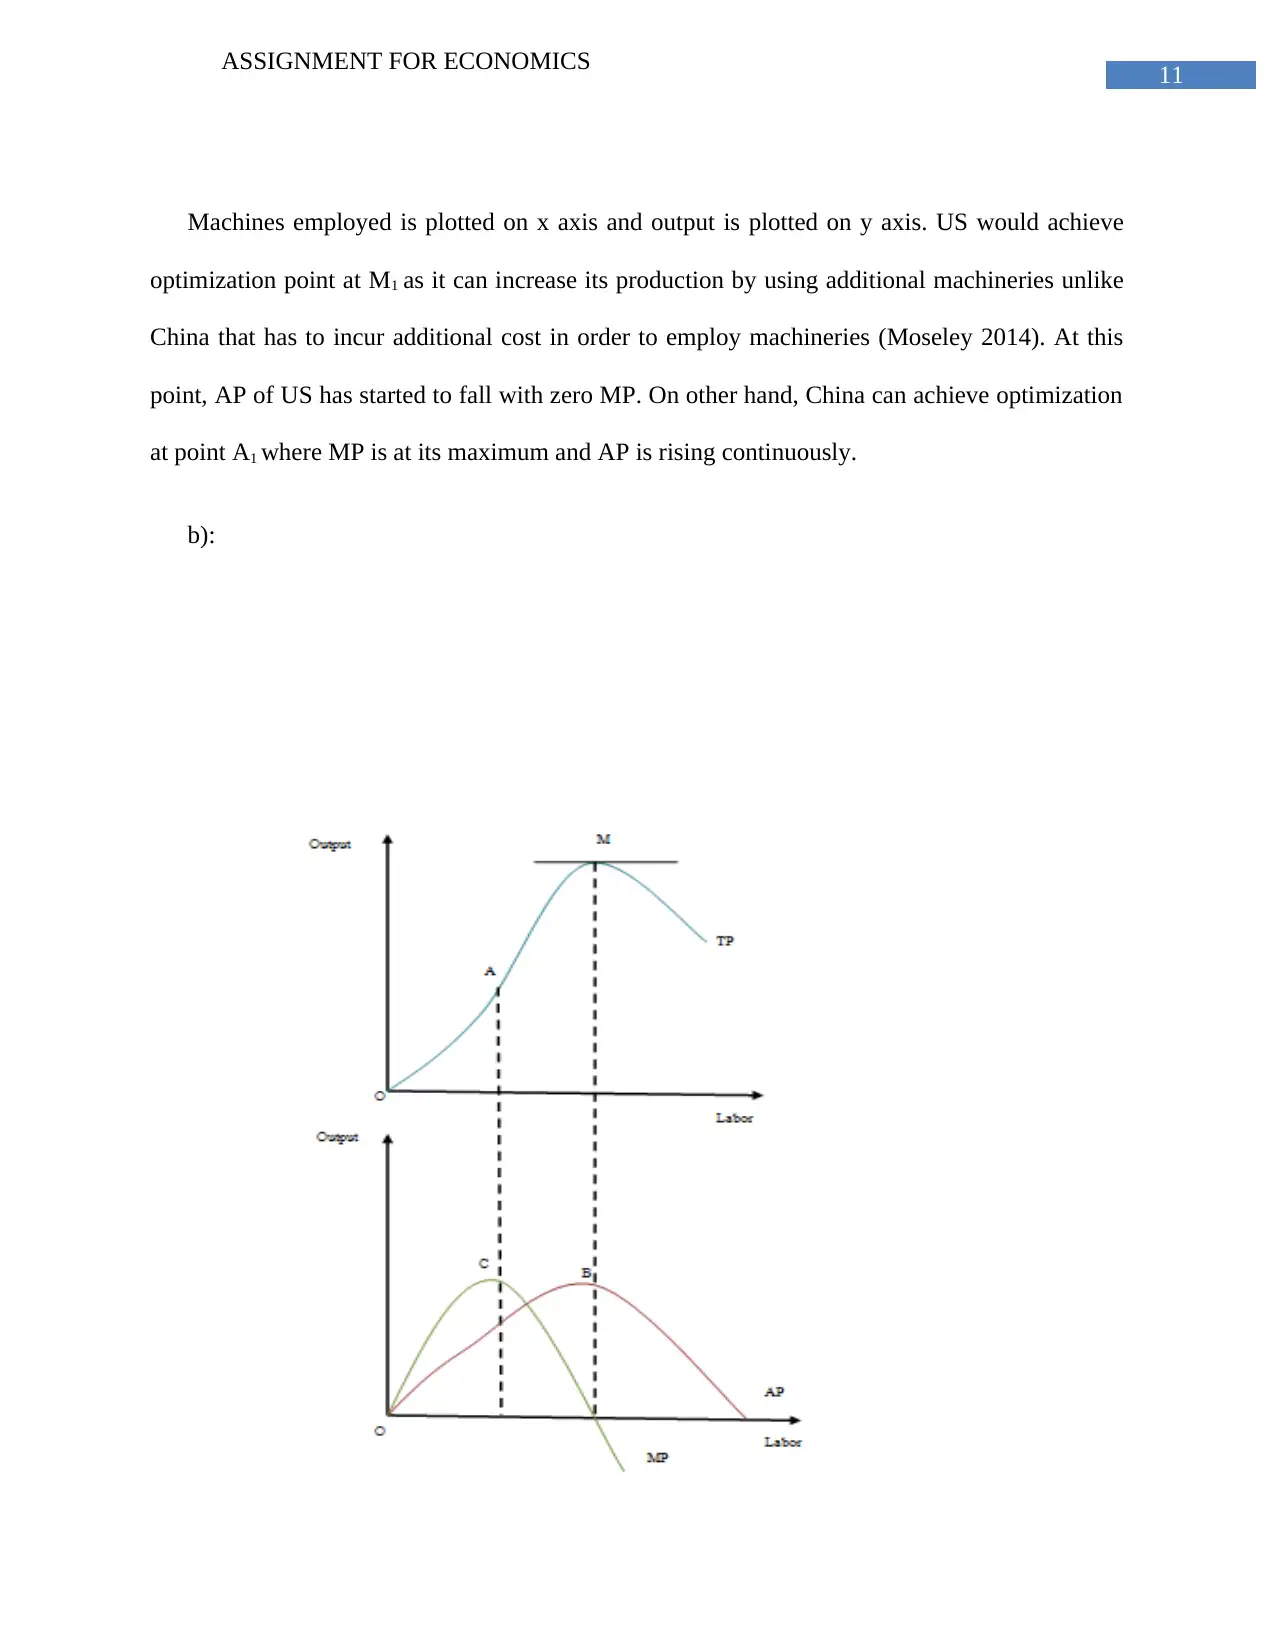
Machines employed is plotted on x axis and output is plotted on y axis. US would achieve
optimization point at M1 as it can increase its production by using additional machineries unlike
China that has to incur additional cost in order to employ machineries (Moseley 2014). At this
point, AP of US has started to fall with zero MP. On other hand, China can achieve optimization
at point A1 where MP is at its maximum and AP is rising continuously.
b):
ASSIGNMENT FOR ECONOMICS
Machines employed is plotted on x axis and output is plotted on y axis. US would achieve
optimization point at M1 as it can increase its production by using additional machineries unlike
China that has to incur additional cost in order to employ machineries (Moseley 2014). At this
point, AP of US has started to fall with zero MP. On other hand, China can achieve optimization
at point A1 where MP is at its maximum and AP is rising continuously.
b):
⊘ This is a preview!⊘
Do you want full access?
Subscribe today to unlock all pages.
Trusted by 1+ million students worldwide
1 out of 24
Related Documents


Your All-in-One AI-Powered Toolkit for Academic Success.
+13062052269
info@desklib.com
Available 24*7 on WhatsApp / Email
![[object Object]](/_next/static/media/star-bottom.7253800d.svg)
Unlock your academic potential
Copyright © 2020–2025 A2Z Services. All Rights Reserved. Developed and managed by ZUCOL.