Economics Assignment 1: Market Dynamics, Elasticity and Costs

Verified

Added on  2020/04/21

|12
|1153
|107
Homework Assignment
AI Summary
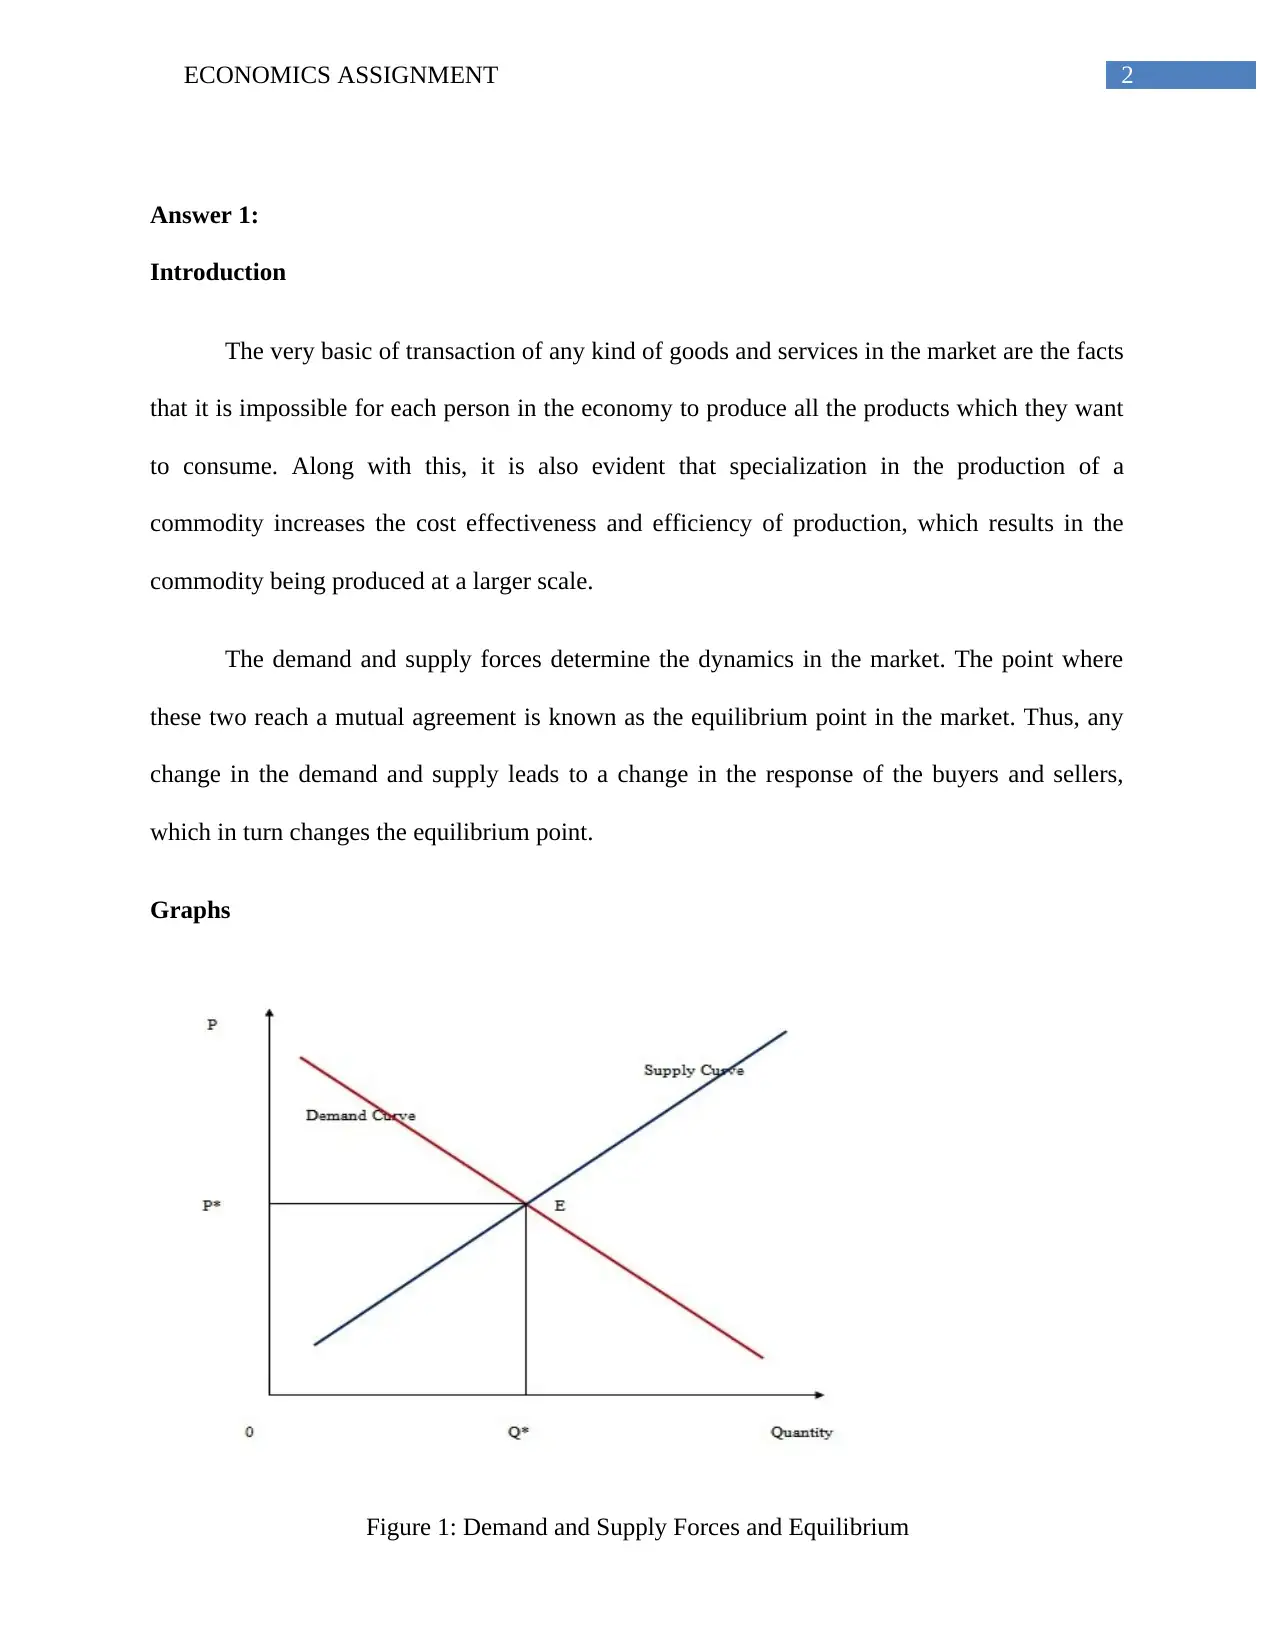
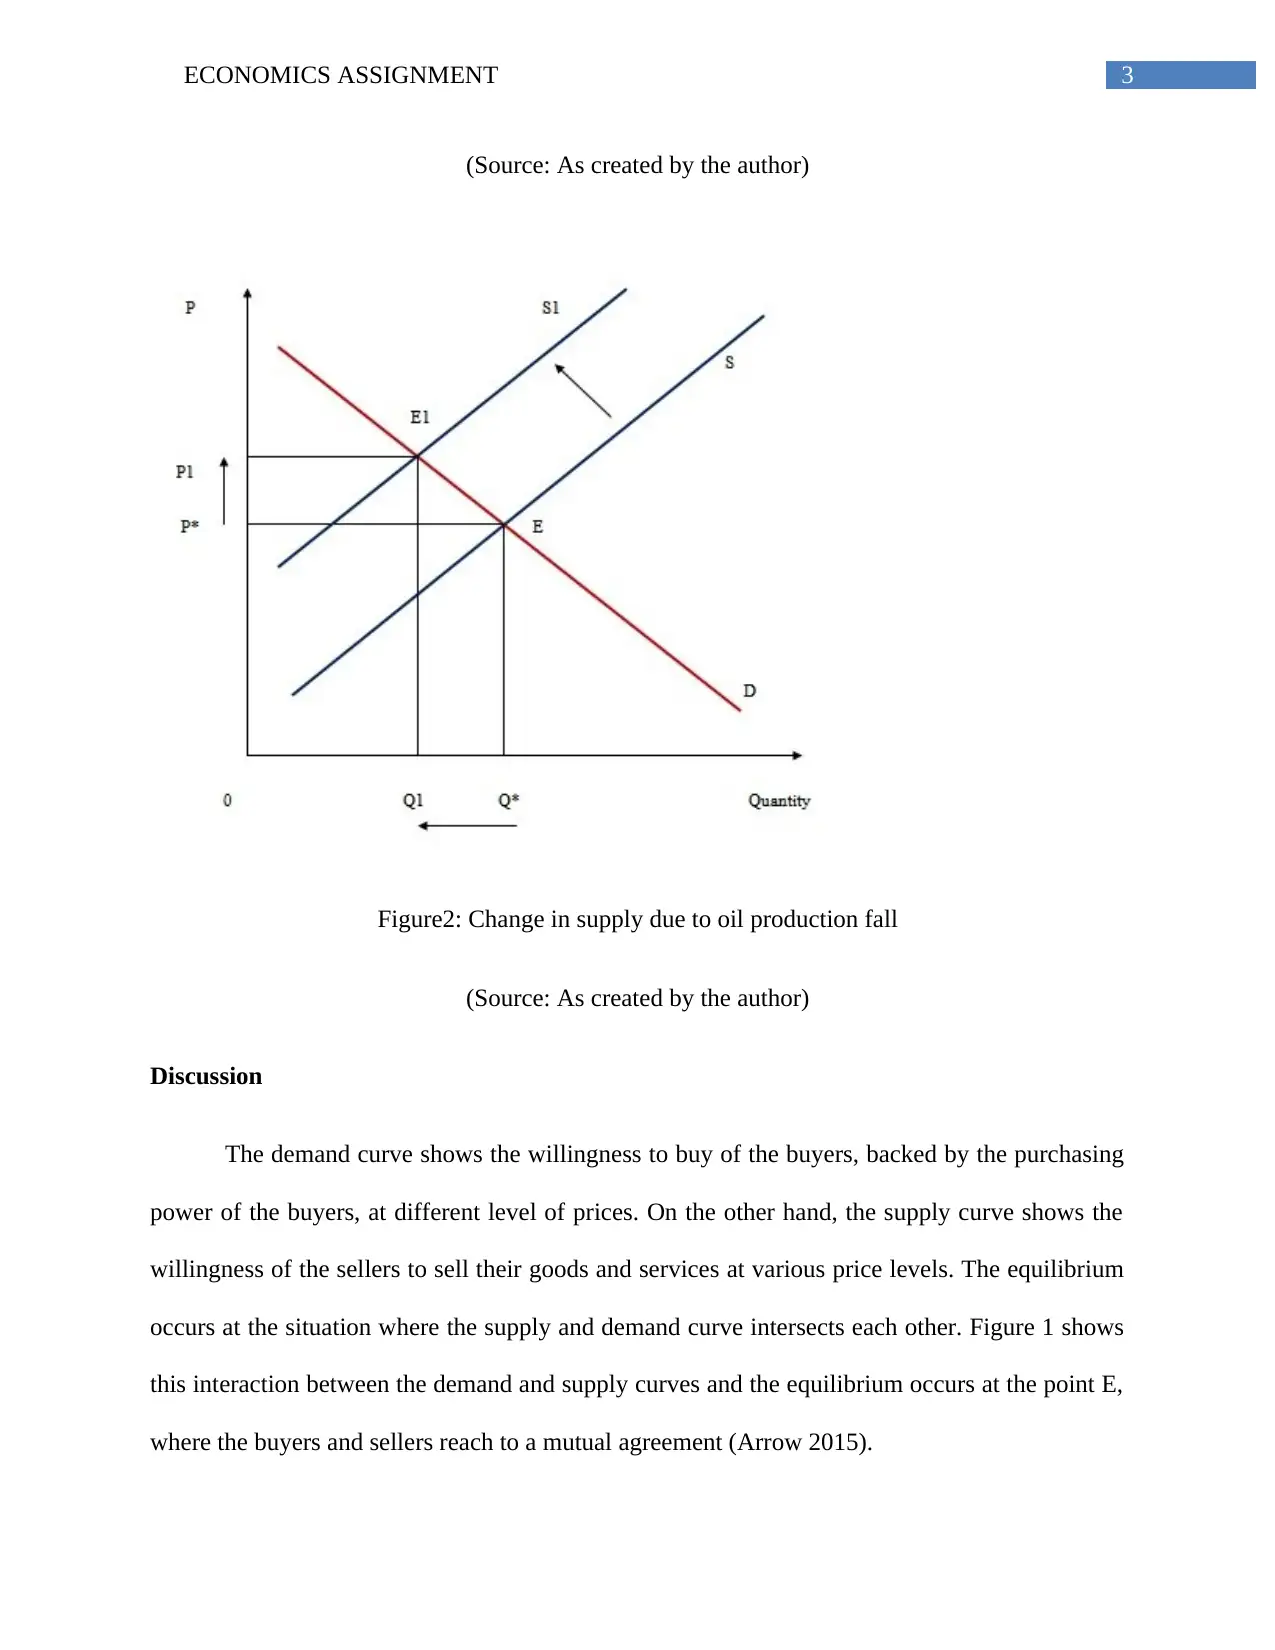
This economics assignment delves into fundamental economic concepts, starting with the interaction of demand and supply forces to determine market equilibrium. It explores how shifts in supply, such as those caused by changes in oil production, impact equilibrium prices and quantities. The assignment then focuses on the concept of price elasticity of demand, differentiating between elastic, inelastic, and unitary elastic demand curves and providing real-world examples. Finally, the assignment examines cost structures within a firm, including average fixed cost, average variable cost, and marginal cost, demonstrating how a firm aims to maximize profit or minimize costs by analyzing these cost components and determining the optimal output level. The assignment uses graphs and tables to illustrate these concepts, providing a comprehensive overview of market dynamics and cost analysis.
Document Page
Running head: ECONOMICS ASSIGNMENT
Economics Assignment
Name of the Study
Name of the University
Author Note
tabler-icon-diamond-filled.svg

Paraphrase This Document

Need a fresh take? Get an instant paraphrase of this document with our AI Paraphraser
Document Page
1ECONOMICS ASSIGNMENT
Table of Contents
Answer 1:.........................................................................................................................................2
Answer 2:.........................................................................................................................................4
Answer 3:.........................................................................................................................................8
References......................................................................................................................................11
Document Page
2ECONOMICS ASSIGNMENT
Answer 1:
Introduction
The very basic of transaction of any kind of goods and services in the market are the facts
that it is impossible for each person in the economy to produce all the products which they want
to consume. Along with this, it is also evident that specialization in the production of a
commodity increases the cost effectiveness and efficiency of production, which results in the
commodity being produced at a larger scale.
The demand and supply forces determine the dynamics in the market. The point where
these two reach a mutual agreement is known as the equilibrium point in the market. Thus, any
change in the demand and supply leads to a change in the response of the buyers and sellers,
which in turn changes the equilibrium point.
Graphs
Figure 1: Demand and Supply Forces and Equilibrium
Document Page
3ECONOMICS ASSIGNMENT
(Source: As created by the author)
Figure2: Change in supply due to oil production fall
(Source: As created by the author)
Discussion
The demand curve shows the willingness to buy of the buyers, backed by the purchasing
power of the buyers, at different level of prices. On the other hand, the supply curve shows the
willingness of the sellers to sell their goods and services at various price levels. The equilibrium
occurs at the situation where the supply and demand curve intersects each other. Figure 1 shows
this interaction between the demand and supply curves and the equilibrium occurs at the point E,
where the buyers and sellers reach to a mutual agreement (Arrow 2015).
tabler-icon-diamond-filled.svg

Paraphrase This Document

Need a fresh take? Get an instant paraphrase of this document with our AI Paraphraser
Document Page
4ECONOMICS ASSIGNMENT
When there is a fall in the production of oil in the market, this leads to a fall in the supply
of oil, which can be seen from the shift of the supply curve from S to S1, demand remaining the
same. The new equilibrium occurs at E1 with a higher price and a lower level of quantity
demanded. The level at which the quantity demanded falls depends on the elasticity of demand
for oil.
Conclusion
From the above discussion, it can be seen that the equilibrium point in a market occurs at
the point of mutual interaction of the demand and supply curves and any change in either the
demand or the supply curve leads to changes in the equilibrium condition existing in the market,
thereby having impacts on the price and quantity demanded.
Answer 2:
Introduction
The economic concept of price elasticity of demand can be defined as the percentage
change in demand for a commodity due to a percentage change in the price. Depending upon the
nature of the commodities, the price elasticity of demand can be of three types, namely elastic,
unitary elastic and inelastic elasticity of demand.
Document Page
5ECONOMICS ASSIGNMENT
Graphs
Figure 3: Elastic demand curve
(Source: As created by the author)
Document Page
6ECONOMICS ASSIGNMENT
Figure 4: Inelastic demand curve
(Source: As created by the author)
tabler-icon-diamond-filled.svg

Paraphrase This Document

Need a fresh take? Get an instant paraphrase of this document with our AI Paraphraser
Document Page
7ECONOMICS ASSIGNMENT
Figure 5: Unitary elastic demand curve
(Source: As created by the author)
Discussion
As can be seen from the Figure 3, when the change in the price of a commodity leads to a
more than proportionate change in the quantity demanded of the same, then the demand is said to
be elastic and the value of the same is more than one. For example, the luxury commodities like
expensive jewelries are example of such goods. The extreme situation of such elastic demand is
the perfectly elastic demand curve, which has elasticity equivalent to infinity and the demand
curve for the same is horizontal.
Figure 4, on the other hand shows inelastic demand (less than one) where the change in
price of a commodity leads to a less than proportionate change in the quantity demanded of the
Document Page
8ECONOMICS ASSIGNMENT
same. the example of such commodities are stable foods. The extreme situation in this context is
a perfectly inelastic demand (the value being equal to zero), where the demand curve of the
commodity is vertical or parallel to the price axis (Rader 2014).
The demand for a commodity is said to be unitary elastic, when with a percentage change
in the price of the commodity, the quantity demanded of the same changes by the same amount
as that of the change in price. This is a hypothetical situation and the demand curve in this
situation has the shape of a rectangular hyperbola (the area under the curve remaining same at
each point) as shown in the Figure 5.
Conclusion
The price elasticity of demand shows the change in the demand of a commodity with a
change in the price. The value of the elasticity, however, depends on the type of commodity the
consumer is buying and the preference of the consumer himself.
Answer 3:
Introduction
In economic framework, the main objective of any production firm is to maximize profit,
which occurs in the long run at the point where the average variable cost is minimum.
Graphs and Tables
Given the data regarding the units of output and the total cost, the value of the following
variables are as follows:
Document Page
9ECONOMICS ASSIGNMENT
Table 1: Costs of a firm:
Output
Units
Total
Cost
(TC)
Marginal
cost (MC)
Average fixed
cost (AFC)
Average variable
cost (AVC)
Average total
cost (ATC)
0 1000 - 1000 0 1000
1 1100 100 1000 100 1100
2 1300 200 500 300 650
3 1650 350 333.33 650 550
4 2200 550 250 1200 550
5 3000 800 200 2000 600
0 1 2 3 4 5 6 7 8
0
2
4
6
8
10
12
Average total cost
Marginal cost
Output
Marginal cost, average total cost
Figure 6: AC and MC Curves
Discussion
It can be seen from the above figure, that the minimum average total cost (550) occurs at
the point where the units of output produced in 3.
tabler-icon-diamond-filled.svg

Paraphrase This Document

Need a fresh take? Get an instant paraphrase of this document with our AI Paraphraser
Document Page
10ECONOMICS ASSIGNMENT
Conclusion
It can be seen from the above discussion that the objective of the firms being
maximization of profit or minimization of the cost, in this case the situation occurs at the point
where the minimum average cost is 550 and the output produced is 3.
Document Page
11ECONOMICS ASSIGNMENT
References
Arrow, K., 2015. Microeconomics and operations research: Their interactions and
differences. Information Systems Frontiers, 17(1), pp.3-9.
Rader, T., 2014. Theory of microeconomics. Academic Press.
chevron_up_icon
1 out of 12
circle_padding
hide_on_mobile
zoom_out_icon
[object Object]