Principles of Economics: Market Dynamics and Inflation in the UK
VerifiedAdded on 2020/02/05
|10
|2557
|42
Report
AI Summary
This report delves into the principles of economics, focusing on market dynamics and inflation within the UK. It begins by explaining the concepts of equilibrium price and quantity, illustrating how demand and supply curves interact to determine market outcomes. The report examines the impact of shifts in demand and supply on equilibrium, providing examples such as the effect of an increase in the number of consumers. Furthermore, it explores the Consumer Price Index (CPI) as a measure of inflation, detailing how it is calculated and its significance in understanding economic trends. The analysis includes the formulas used to calculate CPI and discusses the implications of inflation on the UK economy. The report concludes by summarizing the key findings and emphasizing the importance of these economic principles in understanding market behavior and financial stability.

PRINCIPLES OF ECONOMICS
Paraphrase This Document
Need a fresh take? Get an instant paraphrase of this document with our AI Paraphraser
Table of Contents
INTRODUCTION......................................................................................................................1
TASK 1 The impact on the equilibrium price and quantity of a product of an increase in the
number of consumers in the market...........................................................................................1
Equilibrium price and quantity of a product.....................................................................1
Demand curve...................................................................................................................2
Supply curve.....................................................................................................................2
Impact of shift in demand and supply curve.....................................................................2
TASK 2 Consumer Prices Index measure of inflation is calculated in the UK.........................3
Consumer Prices Index.....................................................................................................3
Consumer Prices Index measure of inflation....................................................................3
CONCLUSION..........................................................................................................................4
REFERENCES...........................................................................................................................5
Journals and Books...........................................................................................................5
Online................................................................................................................................5
INTRODUCTION
The principle of economics deals with the macro and micro economic trends and
culture to know the real economic facts and figure relating to the different countries. The
uncovering of the principles which are governs by the price in the economic system of a
person. These were given to employ the identical principles that are too fast and in an easy
manner to the elaboration of price value. The study in this report is all about the market price
and quantity demanded and supplied by the producer to the consumer. Moreover, the report
focuses on the consumer price index and retail price index and their impact on the UK’s
economy.
TASK 1.
EQUILIBRIUM PRICE AND QUANTITY OF THE PRODUCT
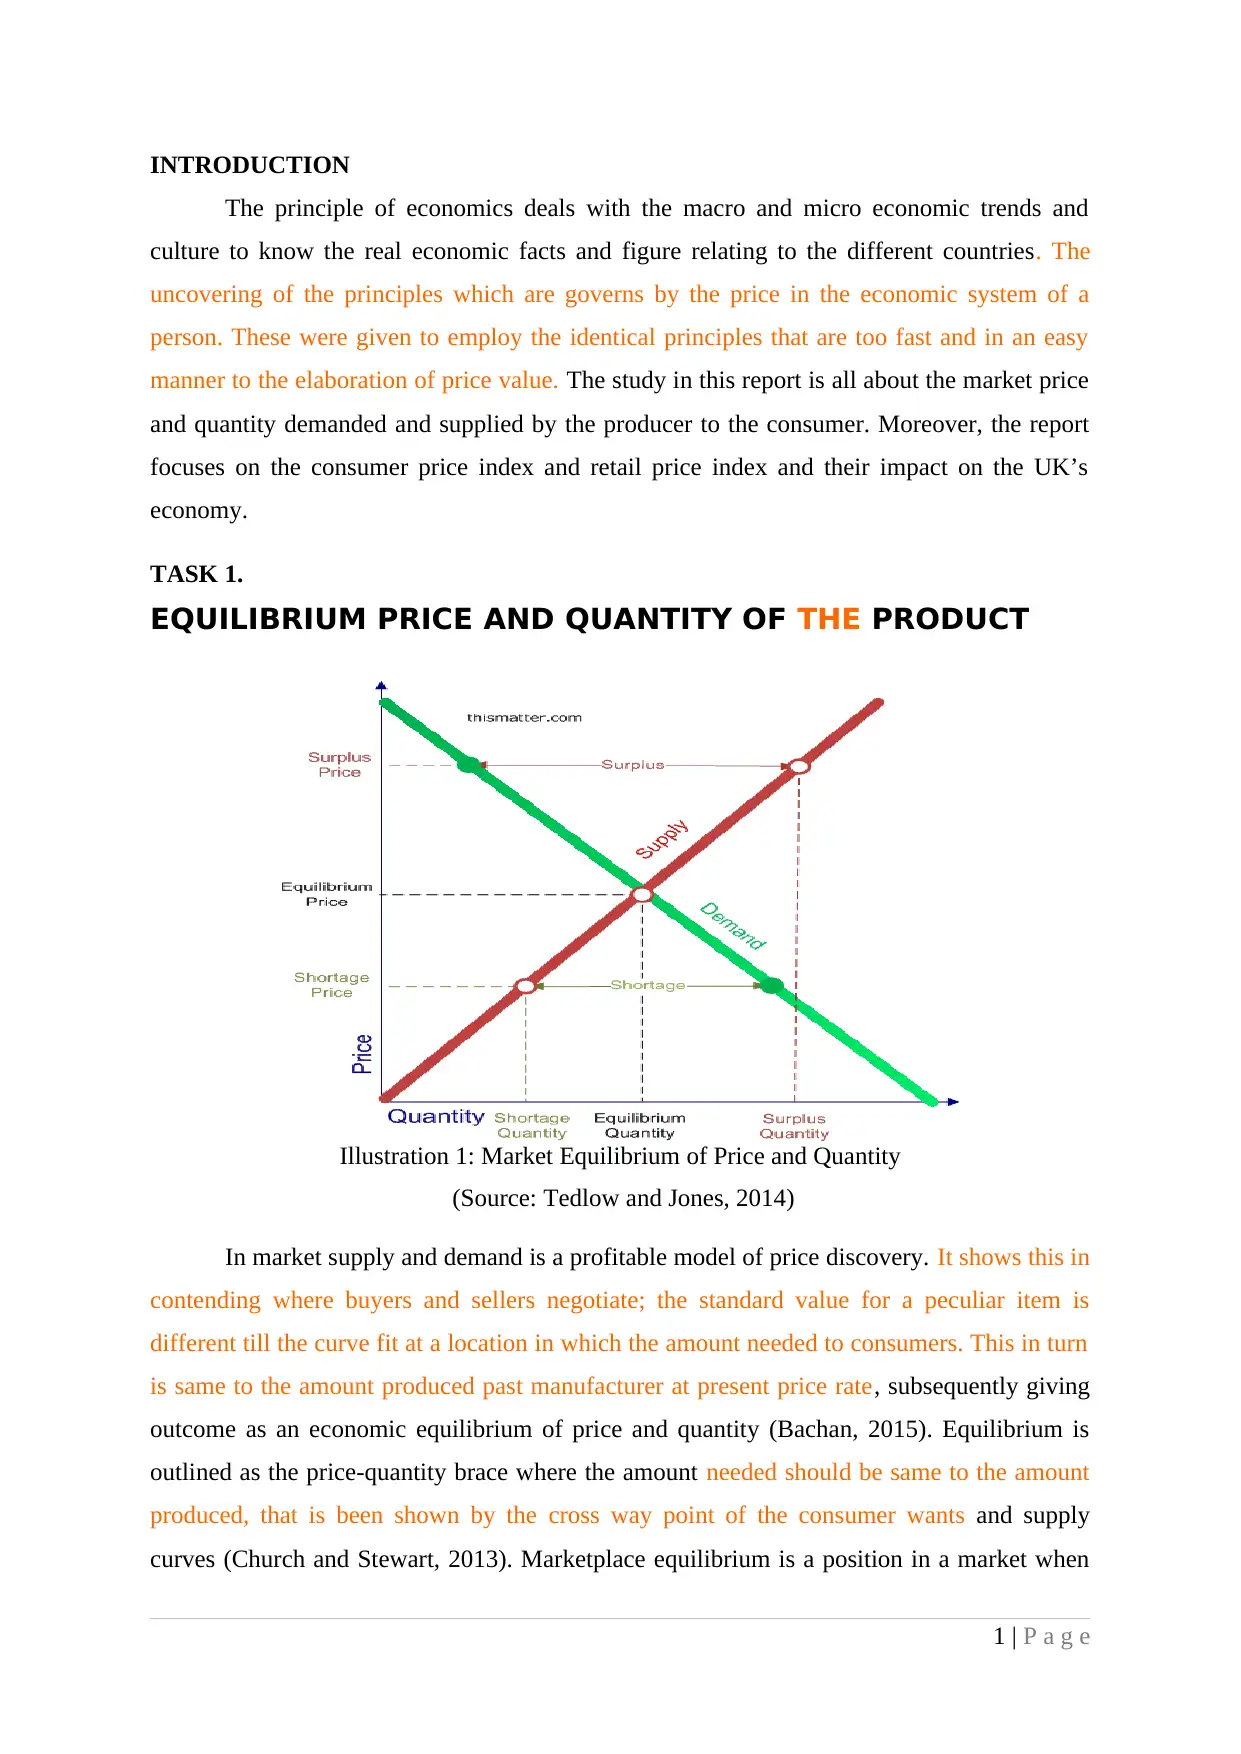
In market supply and demand is a profitable model of price discovery. It shows this in
contending where buyers and sellers negotiate; the standard value for a peculiar item is
different till the curve fit at a location in which the amount needed to consumers. This in turn
is same to the amount produced past manufacturer at present price rate, subsequently giving
outcome as an economic equilibrium of price and quantity (Bachan, 2015). Equilibrium is
outlined as the price-quantity brace where the amount needed should be same to the amount
produced, that is been shown by the cross way point of the consumer wants and supply
curves (Church and Stewart, 2013). Marketplace equilibrium is a position in a market when
1 | P a g e
Illustration 1: Market Equilibrium of Price and Quantity
(Source: Tedlow and Jones, 2014)
The principle of economics deals with the macro and micro economic trends and
culture to know the real economic facts and figure relating to the different countries. The
uncovering of the principles which are governs by the price in the economic system of a
person. These were given to employ the identical principles that are too fast and in an easy
manner to the elaboration of price value. The study in this report is all about the market price
and quantity demanded and supplied by the producer to the consumer. Moreover, the report
focuses on the consumer price index and retail price index and their impact on the UK’s
economy.
TASK 1.
EQUILIBRIUM PRICE AND QUANTITY OF THE PRODUCT
In market supply and demand is a profitable model of price discovery. It shows this in
contending where buyers and sellers negotiate; the standard value for a peculiar item is
different till the curve fit at a location in which the amount needed to consumers. This in turn
is same to the amount produced past manufacturer at present price rate, subsequently giving
outcome as an economic equilibrium of price and quantity (Bachan, 2015). Equilibrium is
outlined as the price-quantity brace where the amount needed should be same to the amount
produced, that is been shown by the cross way point of the consumer wants and supply
curves (Church and Stewart, 2013). Marketplace equilibrium is a position in a market when
1 | P a g e
Illustration 1: Market Equilibrium of Price and Quantity
(Source: Tedlow and Jones, 2014)
⊘ This is a preview!⊘
Do you want full access?
Subscribe today to unlock all pages.
Trusted by 1+ million students worldwide
the value is such that the quantity that customers wish to demand is rightly symmetrical by
the quantity that company desire to supply. For example: this concept can be explained by the
ticket selling. When promoters of huge events desire to sell their concert tickets, they keep
the price of their tickets at such a rate that the enough of the tickets can be sold. Still, there
are many of the customers that are glad to pay a lot more, particularly after all of the tickets
have been sold out (Greenlees and McClelland, 2011). Ticket sellers desire to fulfil the
customer’s needs by supplying tickets at increased prices. Like the large scale event
encourager, ticket sellers desire to be capable to sell all the tickets they have. Is not, they will
have unsold tickets that will have to cut down their net profit by the quantity paid for the
unsold tickets.
Demand curve
Demand curves are put-upon to get idea about the taste and preferences in competing
market. They conjunct with supply curves to compute the equilibrium price (the price at
which producer together are prepared to sell the same amount as consumers together are
ready to purchase) and the equilibrium quantity (the magnitude of that items or service that
will be produced and then purchased without surplus supply or shortage demand) of that
market place.
Supply curve
The quantity supplied graph is haggard as a position of the line off shooting in
ascending from left side to rightmost, since commodity value and amount of quantity
rendered are instantly related. The value of an item rises, the amount provided rises. This in
turn helps to grow the relationship and makes interdependent on other things leftover
invariant (Supply curve, 2015).
Elasticity of demand and supply
Elasticity of Demand: It represents the changes in product demand due to changes in
prices. The inverse relationship exists between the product prices and demand. Higher the
product price results in increasing the product demand. However, lower the product prices
will lead to higher the market demand. But the degree of change in demand may be different
from the price changes. Therefore, the elasticity of demand measures the degree of changes in
demand from changing the prices.
Elasticity of Supply: It represents the changes in market supply due to changes in
prices. The positive relationship exists between price and supply. Higher the prices will lead
2 | P a g e
Paraphrase This Document
Need a fresh take? Get an instant paraphrase of this document with our AI Paraphraser
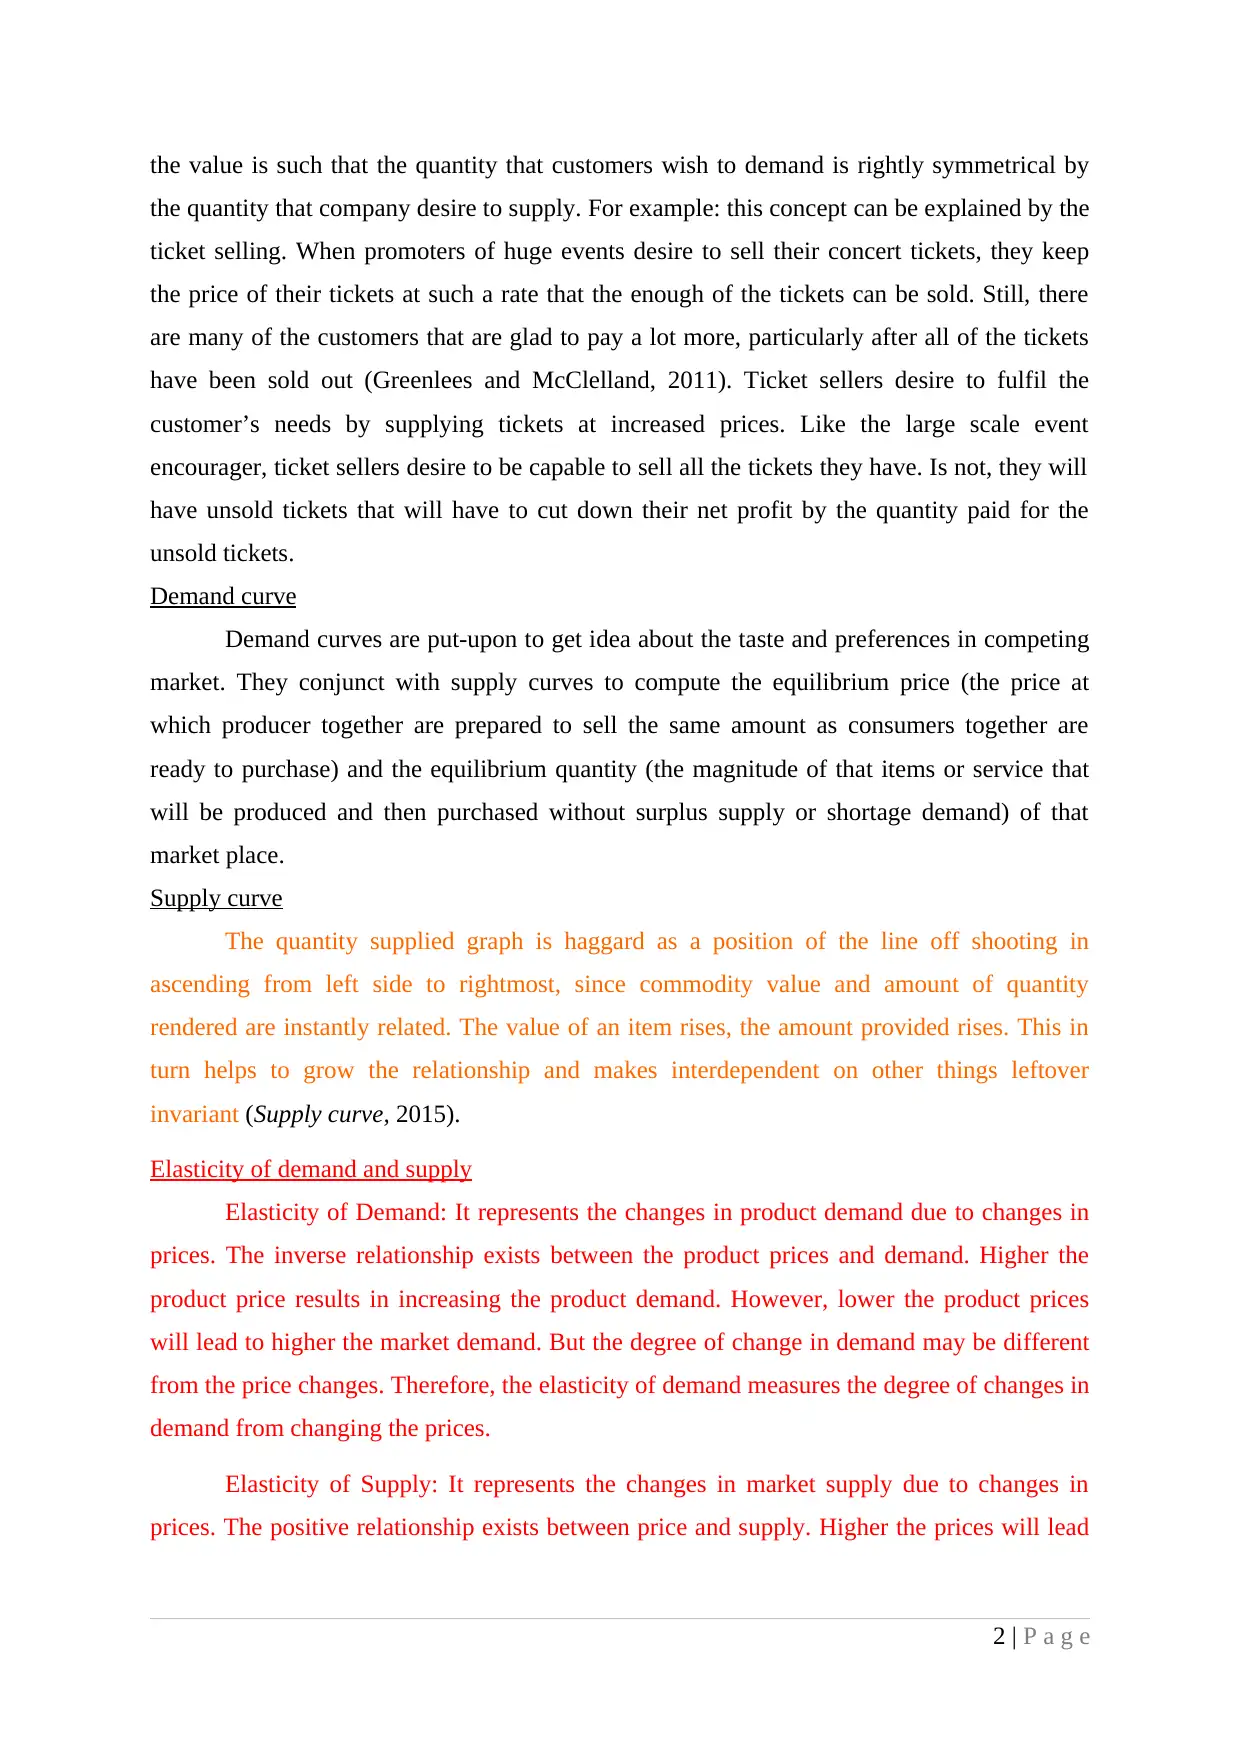
to higher the market supply for the product and vice versa. Supply elasticity measures the
degree of changes in market supply from changing the prices.
Price changes Demand changes Supply changes
10 1250 1000
12 900 1500
Elasticity of demand = Percentage changes in demand/percentage changes in prices
Percentage changes in demand = 1250–900/900*100 = 28%
Percentage changes in prices = 12-10/10*100 = 20%
Elasticity of demand = 28%/20% = 1.4
Elasticity of supply = Percentage changes in Supply/Percentage Changes in prices
Percentage changes in supply = 1500-1000/1000*100 = 50%
Elastic of supply = 50%/20% = 2.5
Impact of shift in demand and supply curve
To know the shift in demand and supply curve market equilibrium have to be studied.
The Supply and demand factor changes which results in corresponding shifts. For example:
if in grocery market, both supply and demand increase. This in turn on the graph would be
depicted by the supply and demand curves both shifting to the right. If different fruits
productivity increases, then the quantity will emphatically rises but the new price is unfixed.
It could rise if the increase in demand of fruits is important enough, or it could decrease if
vice versa. Likewise, if there is some quantity diminution but an uncertain price will mention
when the two, quantity demand and supplied graph change to the leftmost (Church and
Stewart, 2013).
Shift in supply: For instance, if the supply curve of any coffee product get shift to the
leftward than the supply will decrease. This in turn, the equilibrium price will be increase.
Further, if the supply curve shifts to rightward than the product supply will be increase. This
in turn, the equilibrium price will be decreased.
When the quantity supplied and demanded curve move in opposite direction there
will be the surety of alteration in price. For instance, not good quality of grocery may depict
in of shifting demand curve to the left. At the same time, genetic engineers have produced an
3 | P a g e
some sort of grocery that do not need as much expensive care as earlier, shifting the supply
curve to the right. Price will certainly decrease. Likewise, it could be certain that price would
increase, but whether quantity consumed would rise or decline is not sure. This occur if the
demand curve shifts to the right while the supply curve shifts to the left (Tedlow and Jones,
2014).
Shift in demand: For instance, if the coffee product demand curve get shift to the rightward.
That means the demand of the product will be increase results in increased equilibrium
prices. However, if the demand curve shifts to the leftward direction than it means decreased
product demand. This in turn, the equilibrium prices will be decrease.
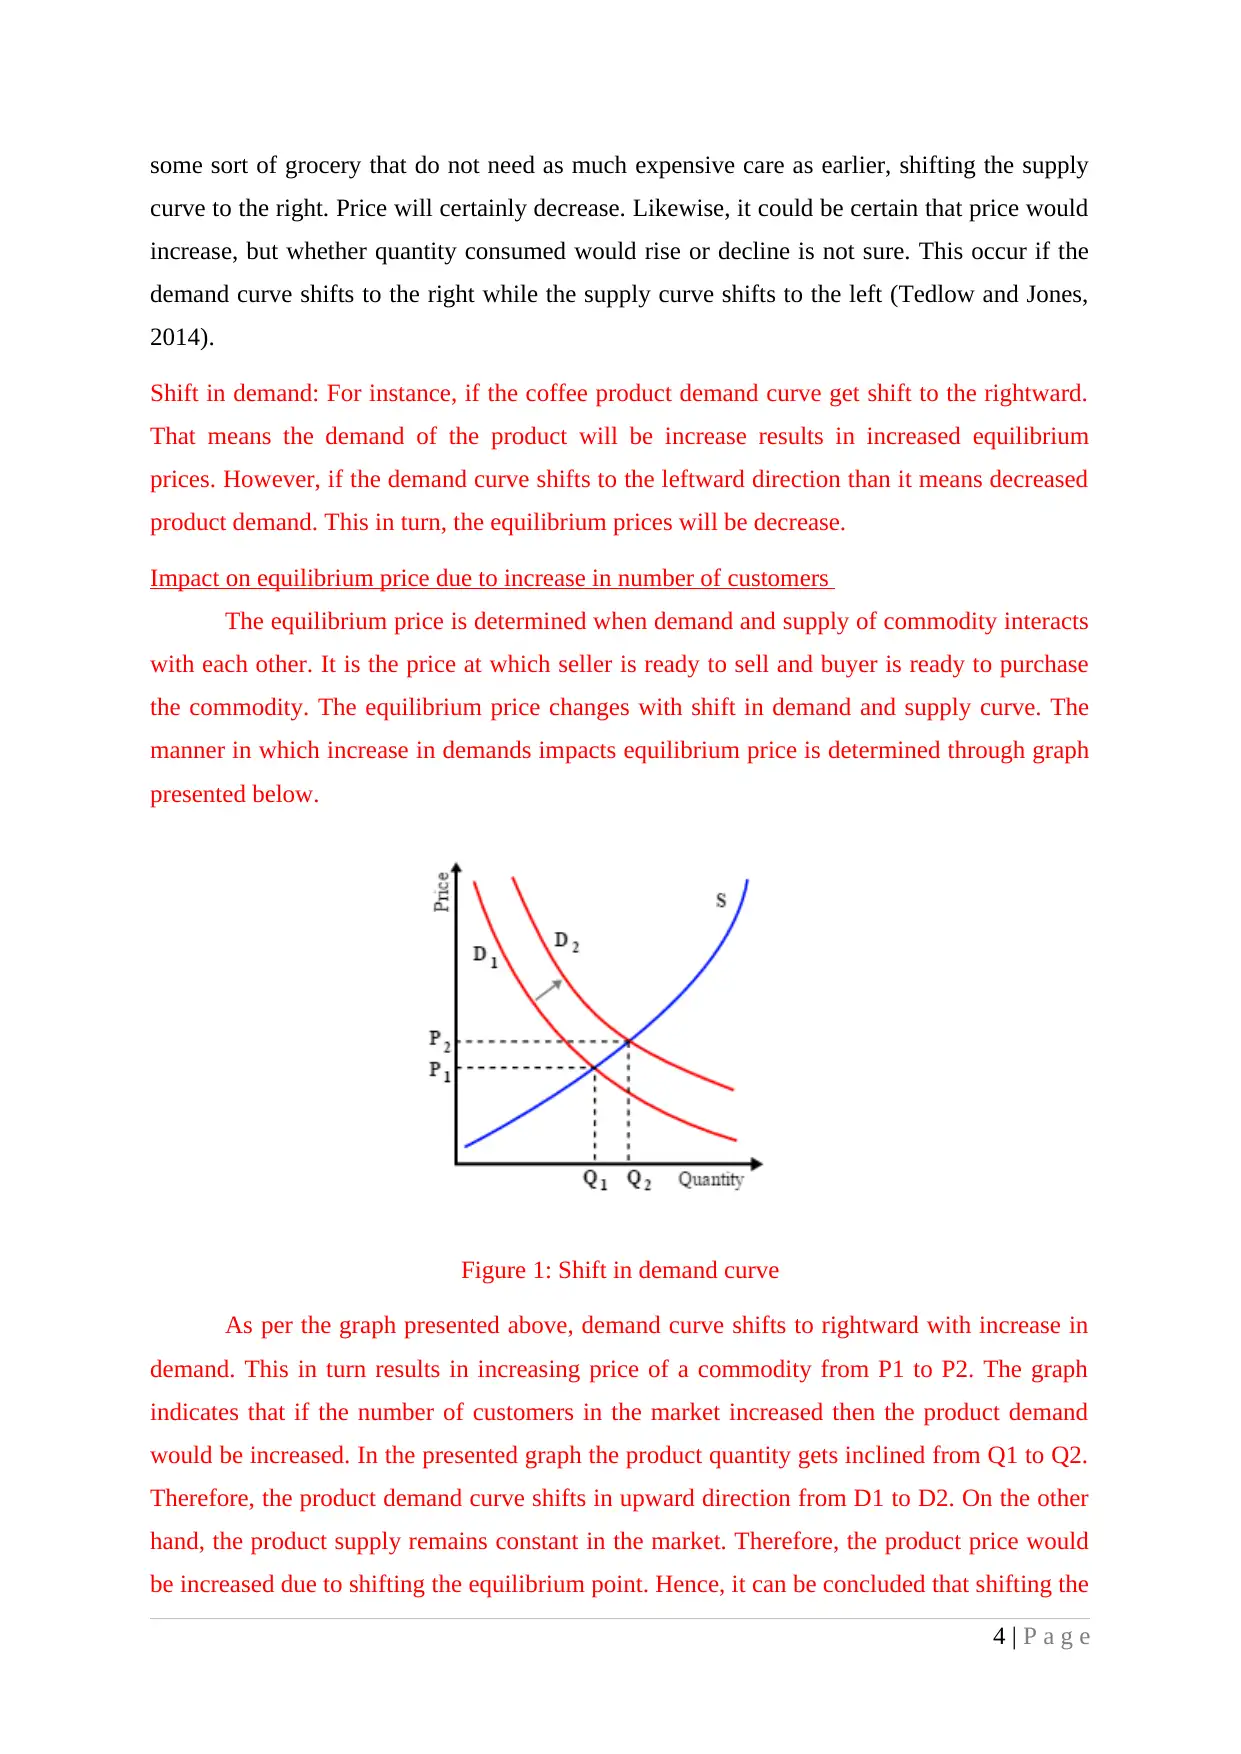
Impact on equilibrium price due to increase in number of customers
The equilibrium price is determined when demand and supply of commodity interacts
with each other. It is the price at which seller is ready to sell and buyer is ready to purchase
the commodity. The equilibrium price changes with shift in demand and supply curve. The
manner in which increase in demands impacts equilibrium price is determined through graph
presented below.
Figure 1: Shift in demand curve
As per the graph presented above, demand curve shifts to rightward with increase in
demand. This in turn results in increasing price of a commodity from P1 to P2. The graph
indicates that if the number of customers in the market increased then the product demand
would be increased. In the presented graph the product quantity gets inclined from Q1 to Q2.
Therefore, the product demand curve shifts in upward direction from D1 to D2. On the other
hand, the product supply remains constant in the market. Therefore, the product price would
be increased due to shifting the equilibrium point. Hence, it can be concluded that shifting the
4 | P a g e
curve to the right. Price will certainly decrease. Likewise, it could be certain that price would
increase, but whether quantity consumed would rise or decline is not sure. This occur if the
demand curve shifts to the right while the supply curve shifts to the left (Tedlow and Jones,
2014).
Shift in demand: For instance, if the coffee product demand curve get shift to the rightward.
That means the demand of the product will be increase results in increased equilibrium
prices. However, if the demand curve shifts to the leftward direction than it means decreased
product demand. This in turn, the equilibrium prices will be decrease.
Impact on equilibrium price due to increase in number of customers
The equilibrium price is determined when demand and supply of commodity interacts
with each other. It is the price at which seller is ready to sell and buyer is ready to purchase
the commodity. The equilibrium price changes with shift in demand and supply curve. The
manner in which increase in demands impacts equilibrium price is determined through graph
presented below.
Figure 1: Shift in demand curve
As per the graph presented above, demand curve shifts to rightward with increase in
demand. This in turn results in increasing price of a commodity from P1 to P2. The graph
indicates that if the number of customers in the market increased then the product demand
would be increased. In the presented graph the product quantity gets inclined from Q1 to Q2.
Therefore, the product demand curve shifts in upward direction from D1 to D2. On the other
hand, the product supply remains constant in the market. Therefore, the product price would
be increased due to shifting the equilibrium point. Hence, it can be concluded that shifting the
4 | P a g e
⊘ This is a preview!⊘
Do you want full access?
Subscribe today to unlock all pages.
Trusted by 1+ million students worldwide
demand curve without changing the market supply will lead to increase in equilibrium point
and also the prices.
TASK 2 CONSUMER PRICES INDEX MEASURE OF INFLATION IS
CALCULATED IN THE UK.
Consumer Prices Index
The CPI is calculated by the fair price alteration as a percentage increase in for goods
and services. On the mid of every month it rolls up data on value of different traded good
from many of the various retailing stores (Greenlees and McClelland, 2011). Contrary to the
retail price index, the CPI yields the geometric mean of prices to collective unit at the
diminished levels rather than the arithmetic mean. This in turn means that the CPI will in
general be less than the RPI. The explanation to this means is that this comes up with the fact
that customers will purchase less of goods and services if their price increases, and more if its
price decreases; it also guarantees that if value increases and then return to the former level,
the CPI also returns to its former level (Government Service Design Manual, 2015). This is
not in same case with RPI. In accordant with the government, this divergence in averaging
method is the am contribution factor to the contrary relation between the RPI and the CPI.
The formula for calculating CPI is:
1. CPI calculated on the basis of single commodity:
CPI = UPDATED COST/BASE PERIOD COST * 100
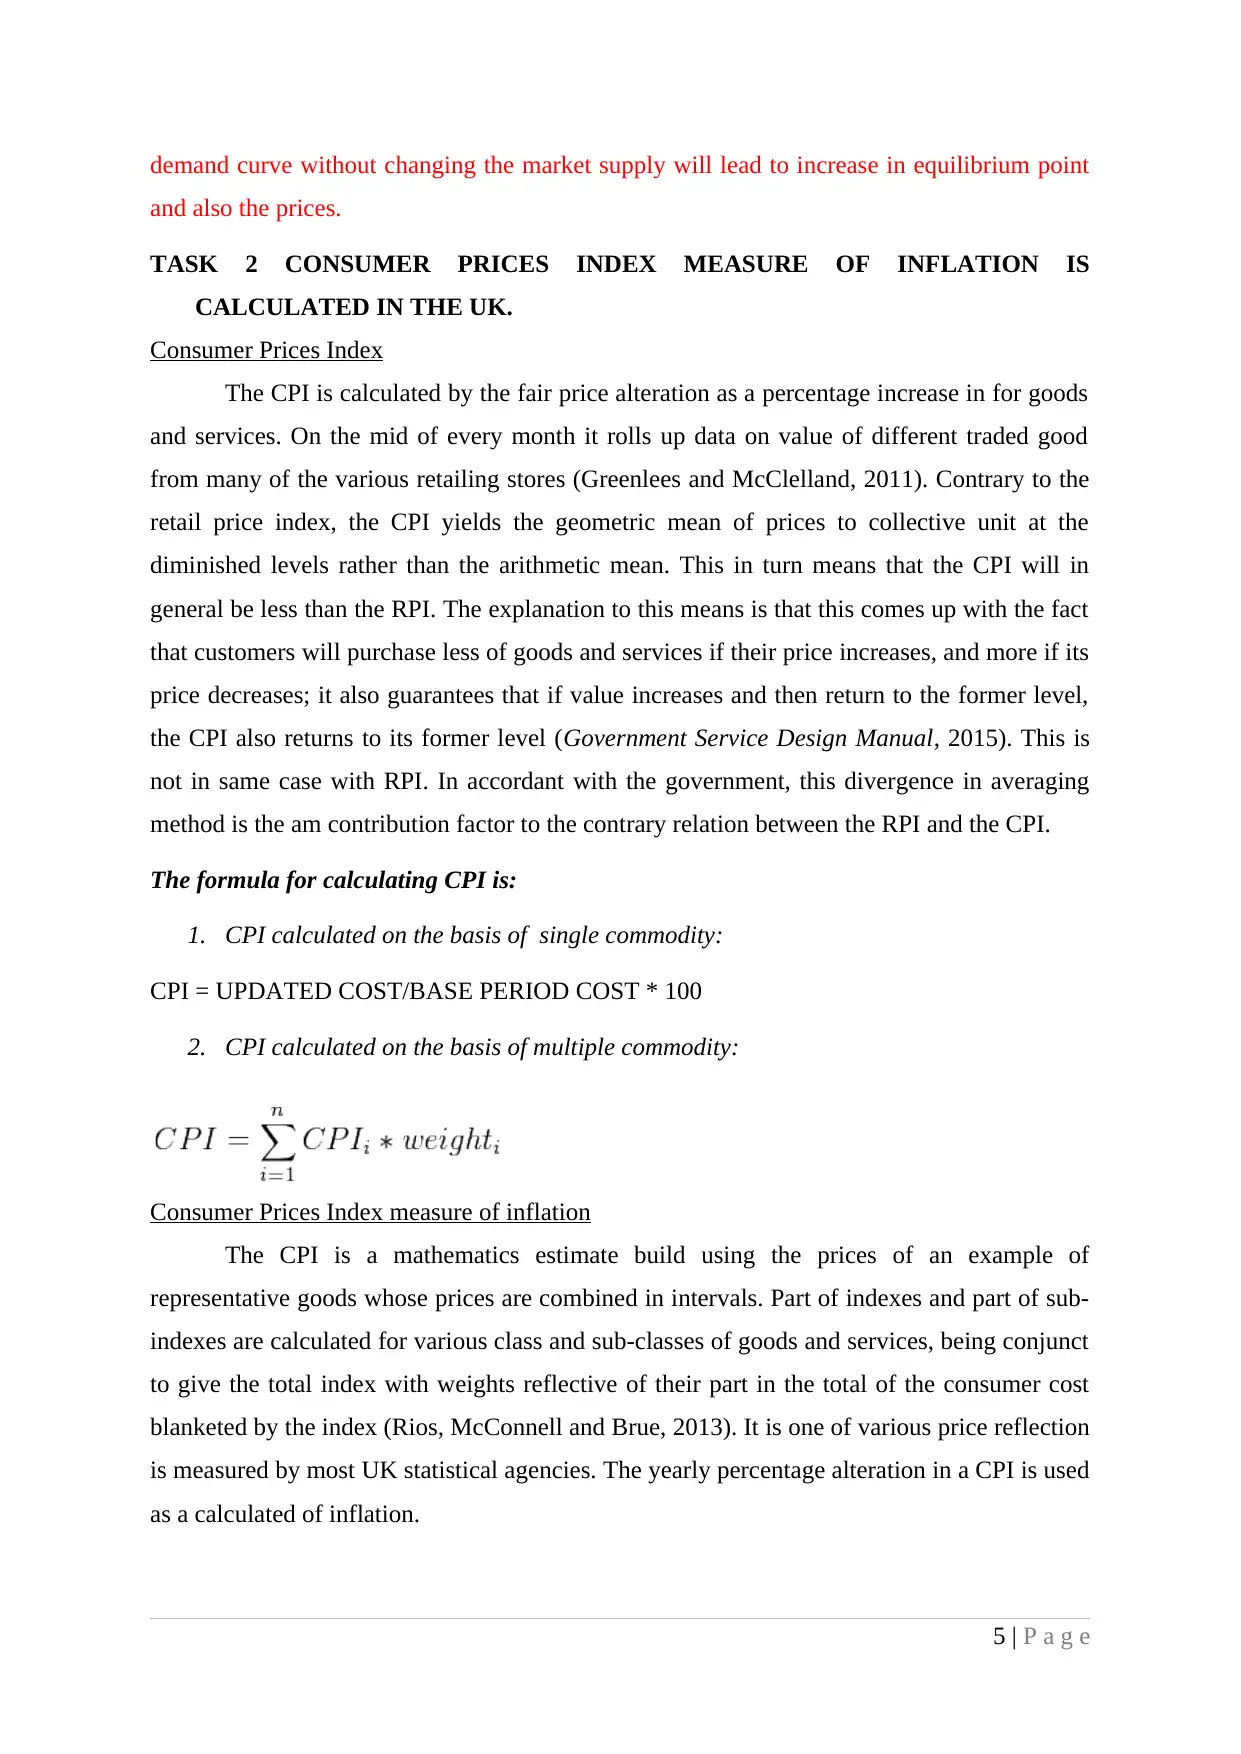
2. CPI calculated on the basis of multiple commodity:
Consumer Prices Index measure of inflation
The CPI is a mathematics estimate build using the prices of an example of
representative goods whose prices are combined in intervals. Part of indexes and part of sub-
indexes are calculated for various class and sub-classes of goods and services, being conjunct
to give the total index with weights reflective of their part in the total of the consumer cost
blanketed by the index (Rios, McConnell and Brue, 2013). It is one of various price reflection
is measured by most UK statistical agencies. The yearly percentage alteration in a CPI is used
as a calculated of inflation.
5 | P a g e
and also the prices.
TASK 2 CONSUMER PRICES INDEX MEASURE OF INFLATION IS
CALCULATED IN THE UK.
Consumer Prices Index
The CPI is calculated by the fair price alteration as a percentage increase in for goods
and services. On the mid of every month it rolls up data on value of different traded good
from many of the various retailing stores (Greenlees and McClelland, 2011). Contrary to the
retail price index, the CPI yields the geometric mean of prices to collective unit at the
diminished levels rather than the arithmetic mean. This in turn means that the CPI will in
general be less than the RPI. The explanation to this means is that this comes up with the fact
that customers will purchase less of goods and services if their price increases, and more if its
price decreases; it also guarantees that if value increases and then return to the former level,
the CPI also returns to its former level (Government Service Design Manual, 2015). This is
not in same case with RPI. In accordant with the government, this divergence in averaging
method is the am contribution factor to the contrary relation between the RPI and the CPI.
The formula for calculating CPI is:
1. CPI calculated on the basis of single commodity:
CPI = UPDATED COST/BASE PERIOD COST * 100
2. CPI calculated on the basis of multiple commodity:
Consumer Prices Index measure of inflation
The CPI is a mathematics estimate build using the prices of an example of
representative goods whose prices are combined in intervals. Part of indexes and part of sub-
indexes are calculated for various class and sub-classes of goods and services, being conjunct
to give the total index with weights reflective of their part in the total of the consumer cost
blanketed by the index (Rios, McConnell and Brue, 2013). It is one of various price reflection
is measured by most UK statistical agencies. The yearly percentage alteration in a CPI is used
as a calculated of inflation.
5 | P a g e
Paraphrase This Document
Need a fresh take? Get an instant paraphrase of this document with our AI Paraphraser
In UK, estimation of inflation is a challenging problem for government
mathematician. For this, definite quantities of goods that are symbolic of the UK economy
are kept collectively into what is known as a "market hoop." The cost of this hoop is then
analyzed over the time frame. This makes the outcome in a price index, which is the
expenditure of the market hoop presently as a percentage of the expenditure of that same
hoop in the opening year (Bachan, 2015).
In this way it can use price indexes as galactic surveys. Every month UK's Federal
agency of Applied mathematics interact with hundreds of retail outlets, service givers, hire
purchases units and physician offices to acquire price data on hundreds of goods used to path
and calculate price alterations in the CPI (Greenlees and McClelland, 2011). They evidence
the prices of many items every month, which stand for a scientifically chosen sample of the
prices paid by customers for the items and services purchased.
There has been critique of CPI as being a low impelling criterion of price rises than
the Retail Prices Index, inculpatory it of being effortless to influence and less wide based. It
is been said that CPI prey meant that interest rates were fixed lower at a time of uphill (RPI)
inflation (Church and Stewart, 2013).
CONCLUSION
It can be concluded that the principles of economics helped in the study by knowing
the price and the quantity demanded by the consumers. It also helped in knowing the impact
of shifts in demand and supply curve. Further, it helped in getting knowledge to how to
measure inflation by using consumer price index and their impacts on UK' economy.
Moreover, the principles of economics helped in knowing the market of UK and they practice
mixed economic system.
6 | P a g e
REFERENCES
Journals and Books
Bachan, R., 2015. Grade inflation in UK higher education. Studies in Higher Education. pp.1-
21.
Church, J. and Stewart, K.J., 2013. The Consumer Price Index and the ‘median CPI’.
Del Giovane, P., Eramo, G. and Nobili, A., 2011. Disentangling demand and supply in credit
developments: a survey-based analysis for Italy. Journal of Banking & finance. 35(10).
pp.2719-2732.
Greenlees, J.S. and McClelland, R., 2011. New evidence on outlet substitution effects in
consumer price index data. Review of Economics and Statistics. 93(2). pp.632-646.
Huang, S., 2012. Based on Genetic Optimization of Support Vector Machine Consumer Price
Index Forecast. Advanced Science Letters. 6(1). pp.485-488.
Mills, T.C., 2013. Constructing UK Core Inflation. Econometrics. 1(1). pp.32-52.
Rios, M.C., McConnell, C.R. and Brue, S.L., 2013. Economics: Principles, problems, and
policies. McGraw-Hill.
Tedlow, R.S. and Jones, G.G., 2014. The Rise and Fall of Mass Marketing (RLE Marketing).
Routledge.
Online
Government Service Design Manual, 2015. [Online]. Available through:
<https://www.gov.uk/service-manual>. [Accessed on 16th December 2015].
Supply curve, 2015. [Online]. Available through:<http://www.britannica.com/topic/supply-
curve>. [Accessed on 16th December 2015].
7 | P a g e
⊘ This is a preview!⊘
Do you want full access?
Subscribe today to unlock all pages.
Trusted by 1+ million students worldwide

1 | P a g e
1 out of 10
Related Documents


Your All-in-One AI-Powered Toolkit for Academic Success.
+13062052269
info@desklib.com
Available 24*7 on WhatsApp / Email
![[object Object]](/_next/static/media/star-bottom.7253800d.svg)
Unlock your academic potential
Copyright © 2020–2026 A2Z Services. All Rights Reserved. Developed and managed by ZUCOL.