Management Economics Report: Analyzing Market Structures and Demand

Verified

Added on  2020/10/04

|16
|2528
|201
Report
AI Summary
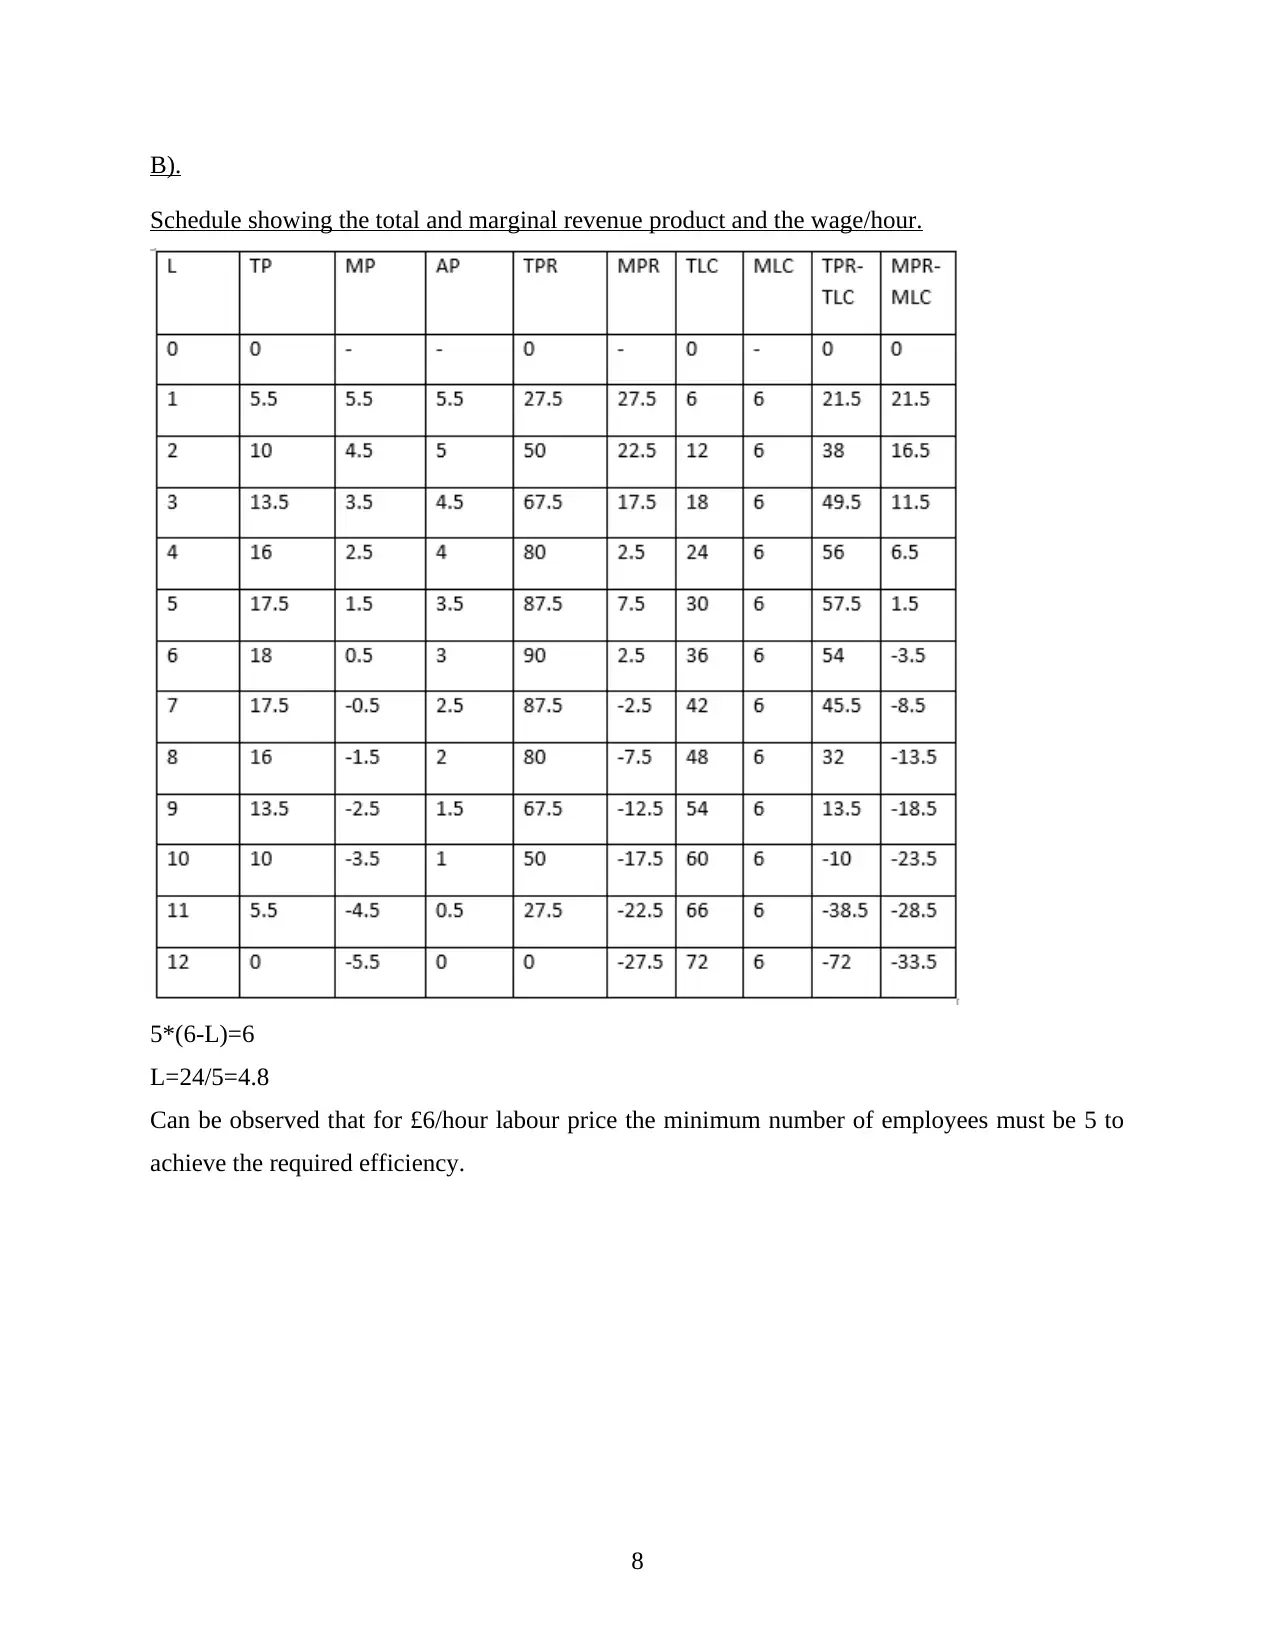
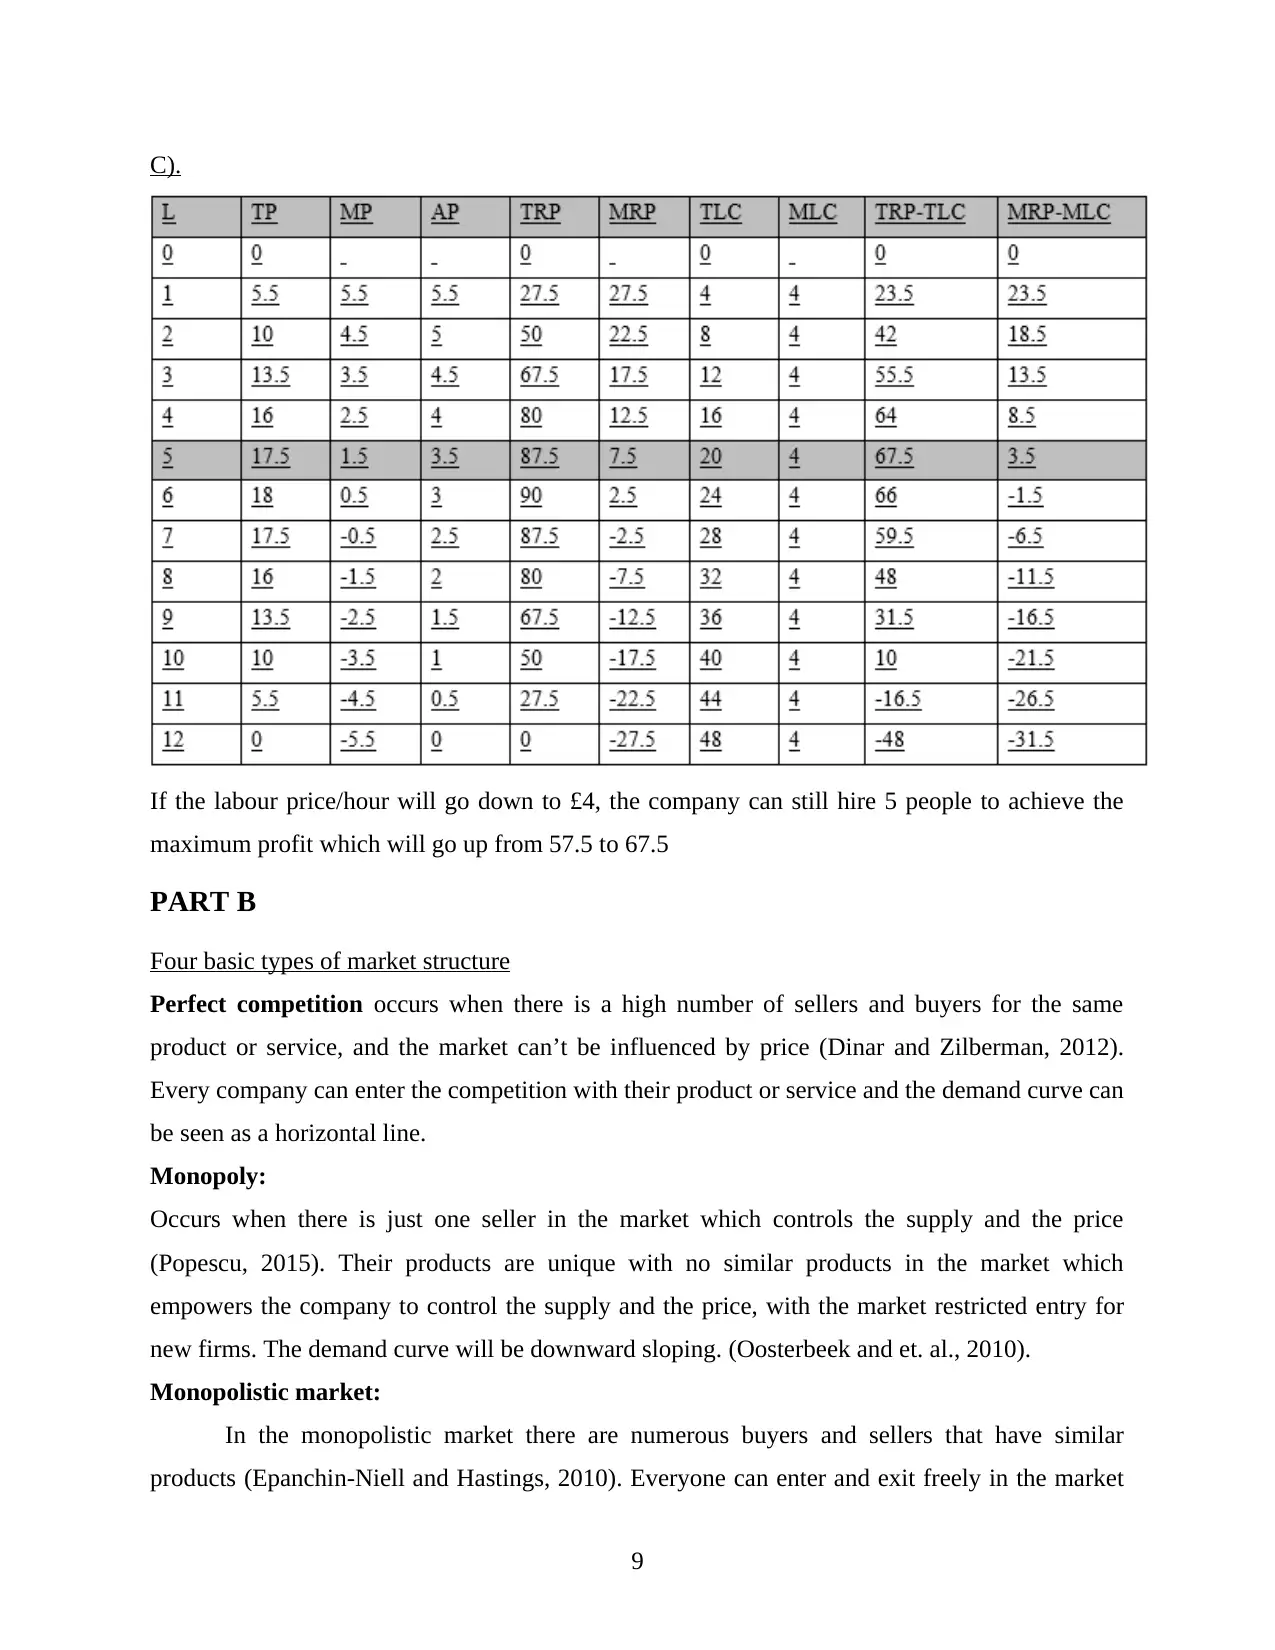
This report provides an analysis of management economics, focusing on how businesses and consumers make decisions regarding resource allocation. It delves into the concepts of demand and supply, emphasizing their importance for managers in making informed decisions about pricing and resource allocation. The report explores the law of demand, elasticity (price, income, and cross), and market structures, including perfect competition, monopoly, monopolistic competition, and oligopoly. It uses calculations, graphs, and real-world examples, such as Toyota and the rail industry in Britain, to illustrate these concepts. The report concludes by highlighting the significance of understanding market dynamics for effective decision-making in a business context, considering the characteristics of different market structures and their implications.
Document Page
MANAGEMENT
ECONOMICS
tabler-icon-diamond-filled.svg

Paraphrase This Document

Need a fresh take? Get an instant paraphrase of this document with our AI Paraphraser
Document Page
Document Page
INTRODUCTION
Economics is analysing how the companies and customers are taking a decision and assign
resources (Anderson, 2013). The management economics is helping us comprehend the
changes in the worldwide economy alongside with government policies. Both short and
long-term phases of demand and supply must be taken into consideration by managers.
PART A
Q1
For a company to become successful their managers must understand how the demand and
supply is working and correctly allocate their resources and price their product
accordingly. A sound management economic system must be used for this type of analysis
to establish the demand and supply of services and goods ( Bloom and Van Reenen,
2010).The manager must make the correct decision relating control of product price and
services. The law of demand states that if the price for a product goes up de demand for it
will go down and viceversa.
It is very essential for managers to study the relationship between demand and supply.
Managers is known as the individual who take important decision and allocate the company’s
resources which directly affect the success and failure of a business. Toyota can be one of the
example whose demand of cars has been decreased by 2% when company increase prices of its
cars.
Q.2
A).
1. Qd = 3000-10 P
0 = 3000 -10 P
10 P = 3000
P=3000/10=300
B).
Qs = -1000+ 10 P
0 = -1000+ 10 P
-10P = -1000
1
Document Page
P=-1000/-10=100
C).
Qs and Qd has don’t have meaning if negative
Scale the Y-axis from 0 -2,000 to 3,000 or 4,000
None are negative values of P of interest.
Scale the X-axis from 0 to 300-400
Plot 2 points from each equation and draw a straight line between them.
2
tabler-icon-diamond-filled.svg

Paraphrase This Document

Need a fresh take? Get an instant paraphrase of this document with our AI Paraphraser
Document Page
D).
Equilibrium price output level:
Qd = Qs
3000 - 10P = -1000 + 10P
4000 = 20P
P = 200
Qd = Qc = 3000 - 2000 = 1000
E).
Supply will enhance to meet the demand.
New equilibrium point:
Qd = Qs
3500 - 10P = -1000 + 10P
4500 = 20P
P = 225
Qd = Qc = 3500 - 2250 = 1250
New equilibrium from new supplies:
Qd = Qs
3500 - 10P = -500 + 10P
3000 = 20P
P = 150
Qd = Qc = 3000 - 500 = 2500
3
Document Page
Q.3
A). Price elasticity is about how the quantity demanded or supplied of a product is affected by
the change in price of the product (Bloom and et.al., 2012). A product can be elastic (very
responsive at the price change) or inelastic.
The point where supply and demand curve intersect is called price elasticity.
Price elasticity is calculated as percentage change in quantity/percentage change in price. If the
result is higher than 1 the product is elastic.
% Changes in price= P2-P1 *100= 8.5-7.5 *100 = 12.5%
(P2+P1)/2 (8.5+7.5)/2
Price elasticity of demand = percentage change in quantity / percentage change in price * 100
-0.85=X = -1.0625.
1.25
The price of the product goes up and the revenue goes down which will result in the demand
curve shifting downwards.
B).
If the price elasticity changes -1.1 then the percentage in quantity results as -1.1=X/1.25= -0.88
C).
For income elasticity, the formula ‘percentage change in demand/percentage change in the
income ‘will be needed. When the income elasticity of demand is higher than 1, if the income
4
Document Page
goes up the customer will spend a higher percentage from his income on the product. If the
income elasticity is 0.75 will result that if the income goes up, the percentage of the budget spent
on the product will go down.
D).
Cross elasticity of demand is about how the quantity demanded for one product changes when
the price of another product changes. The economists are analysing if two products are
compliments or substitutes (Bloom, N. and Van Reenen, 2010). For example if the price for men
shirts will go up, the demand for ties will go down (shirts and ties are compliments) or if the
price of butter will go up the demand for margarine will go up (the products are substitutes).
The next formula can be used
percentage change in the quantity demanded for product X/percentage change in the price of
product Y
A cross price elasticity of demand( XED) of 2.5 means that the products are substitutes (XED
Q.4
The total product (TP) which is sigma marginal product(MP) can be calculated as the average
product (AP)* labour(L)
5
tabler-icon-diamond-filled.svg

Paraphrase This Document

Need a fresh take? Get an instant paraphrase of this document with our AI Paraphraser
Document Page
A).
6
Document Page
7
Document Page
B).
Schedule showing the total and marginal revenue product and the wage/hour.
5*(6-L)=6
L=24/5=4.8
Can be observed that for £6/hour labour price the minimum number of employees must be 5 to
achieve the required efficiency.
8
tabler-icon-diamond-filled.svg

Paraphrase This Document

Need a fresh take? Get an instant paraphrase of this document with our AI Paraphraser
Document Page
C).
If the labour price/hour will go down to £4, the company can still hire 5 people to achieve the
maximum profit which will go up from 57.5 to 67.5
PART B
Four basic types of market structure
Perfect competition occurs when there is a high number of sellers and buyers for the same
product or service, and the market can’t be influenced by price (Dinar and Zilberman, 2012).
Every company can enter the competition with their product or service and the demand curve can
be seen as a horizontal line.
Monopoly:
Occurs when there is just one seller in the market which controls the supply and the price
(Popescu, 2015). Their products are unique with no similar products in the market which
empowers the company to control the supply and the price, with the market restricted entry for
new firms. The demand curve will be downward sloping. (Oosterbeek and et. al., 2010).
Monopolistic market:
In the monopolistic market there are numerous buyers and sellers that have similar
products (Epanchin‐Niell and Hastings, 2010). Everyone can enter and exit freely in the market
9
Document Page
with their product as long as it is different. Each company has a little percentage of market share
and the demand curve is highly elastic.
Oligopoly:
This market is controlled by a few number of large companies (Nica and Potcovaru,
2015) such as petrol industry or aircraft manufacturers. Very difficult to enter the market because
of the high investment that has to be made.
Theoretical market structure and practice market structure.
The place where sellers and buyers can connect for transacting goods and services is called
a market (Foss and Knudsen, 2013).
Perfect Competition:
10
chevron_up_icon
1 out of 16
circle_padding
hide_on_mobile
zoom_out_icon
[object Object]