Economics: Short Answer Questions - Analysis, Semester 1, University
VerifiedAdded on  2020/06/05
|24
|3710
|57
Homework Assignment
AI Summary
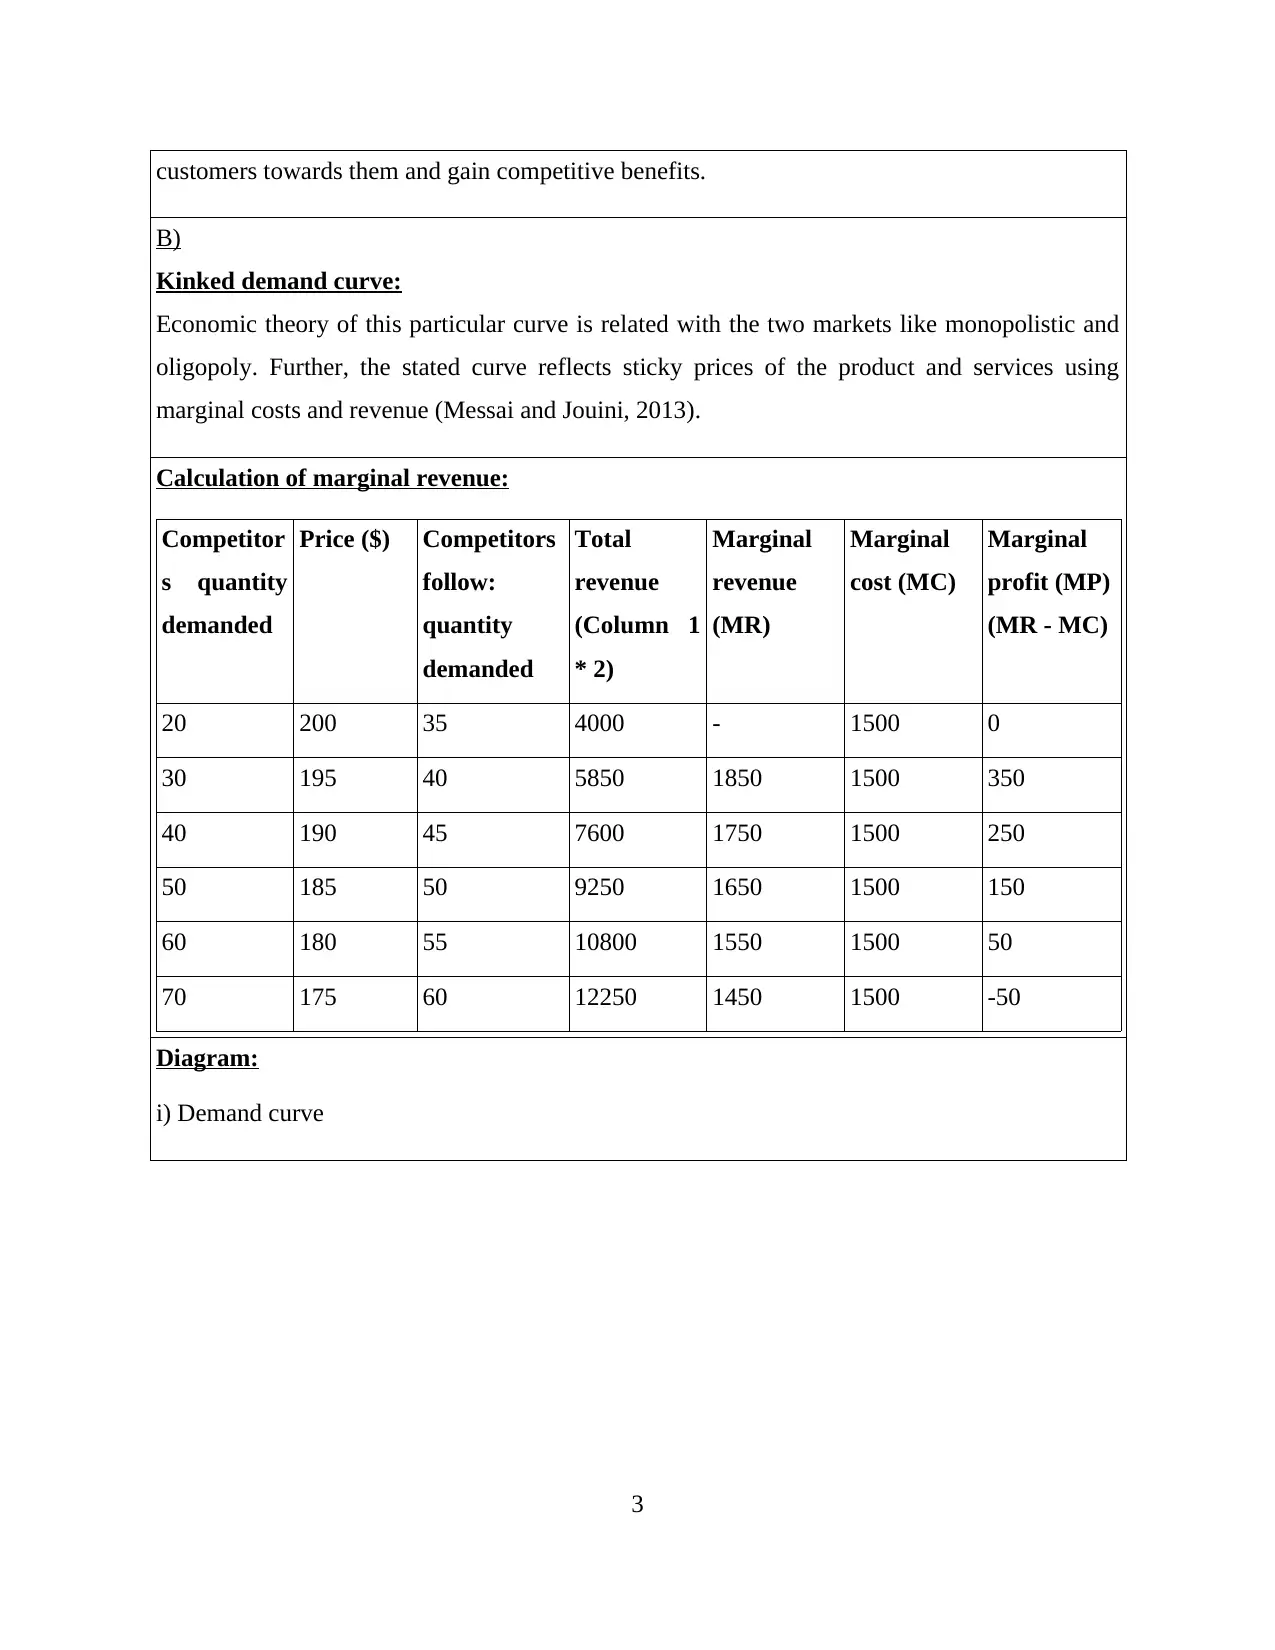
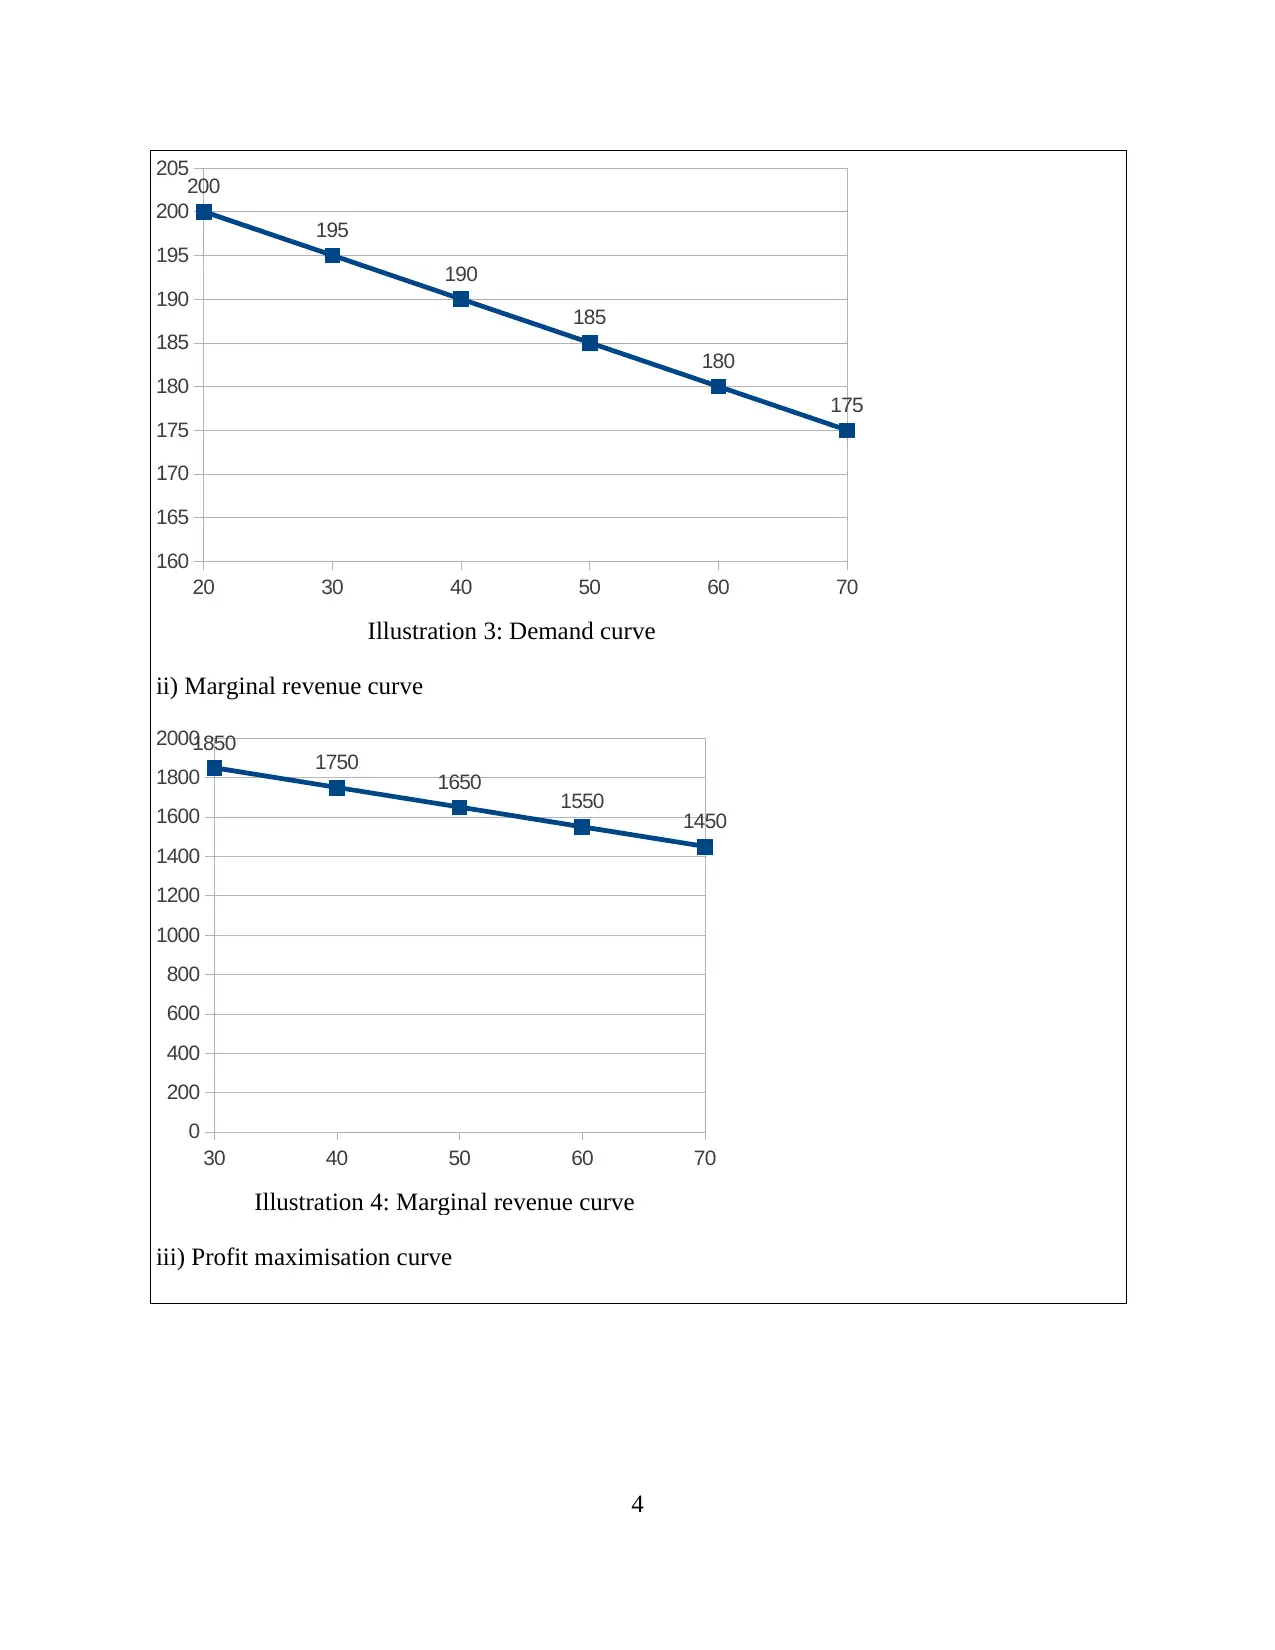
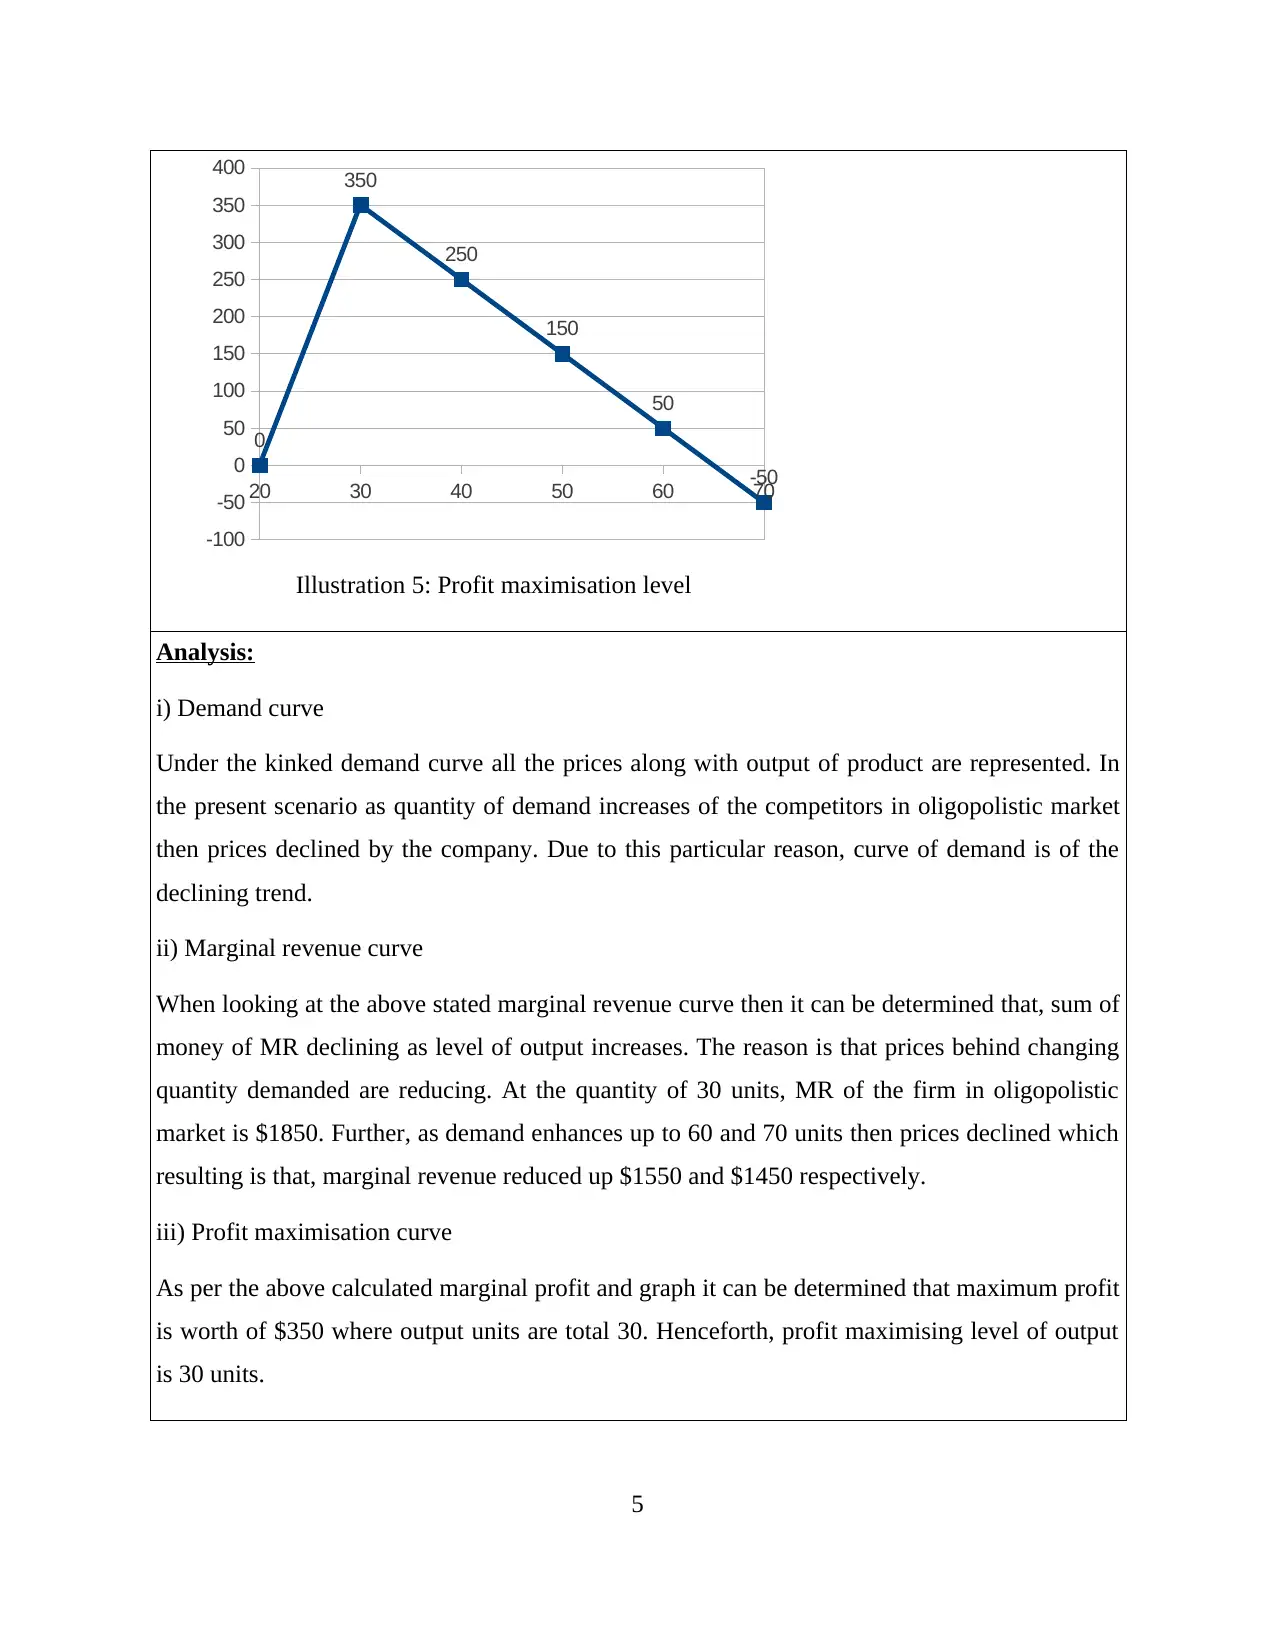
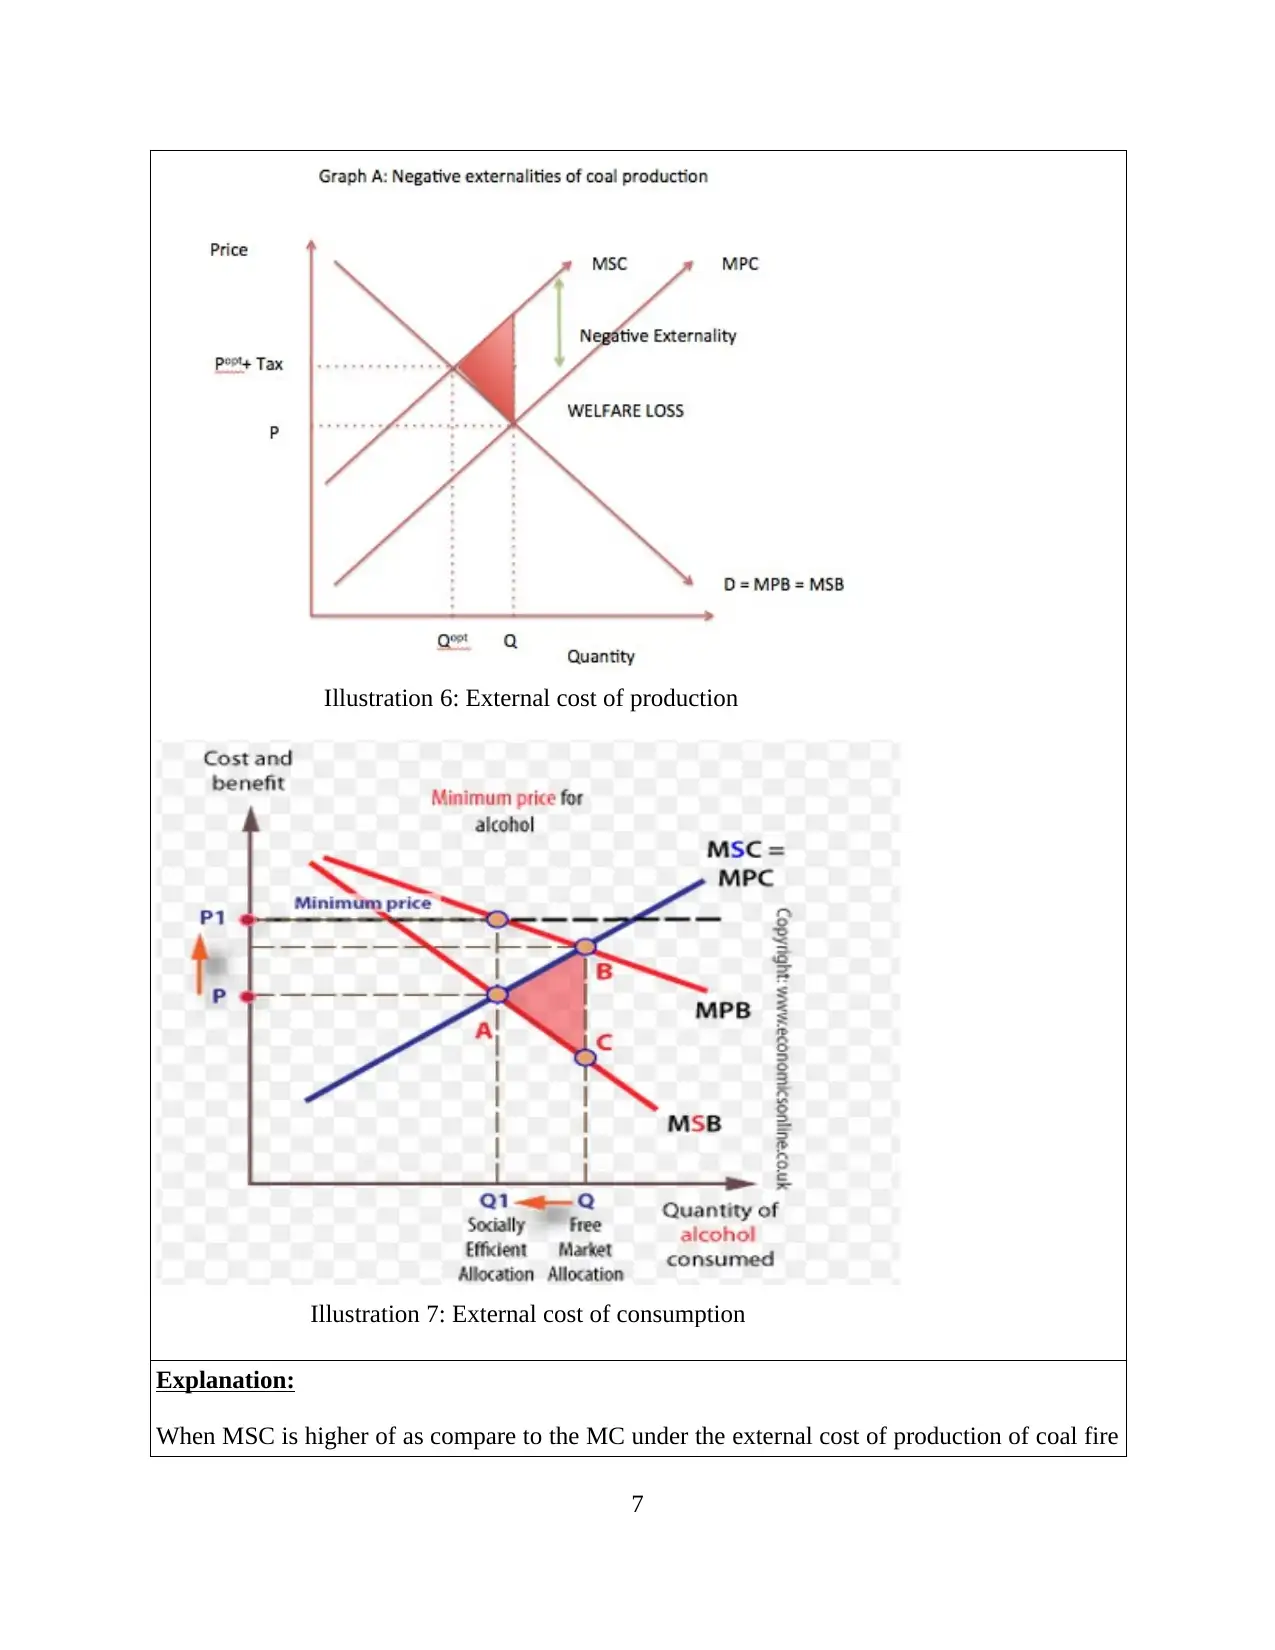
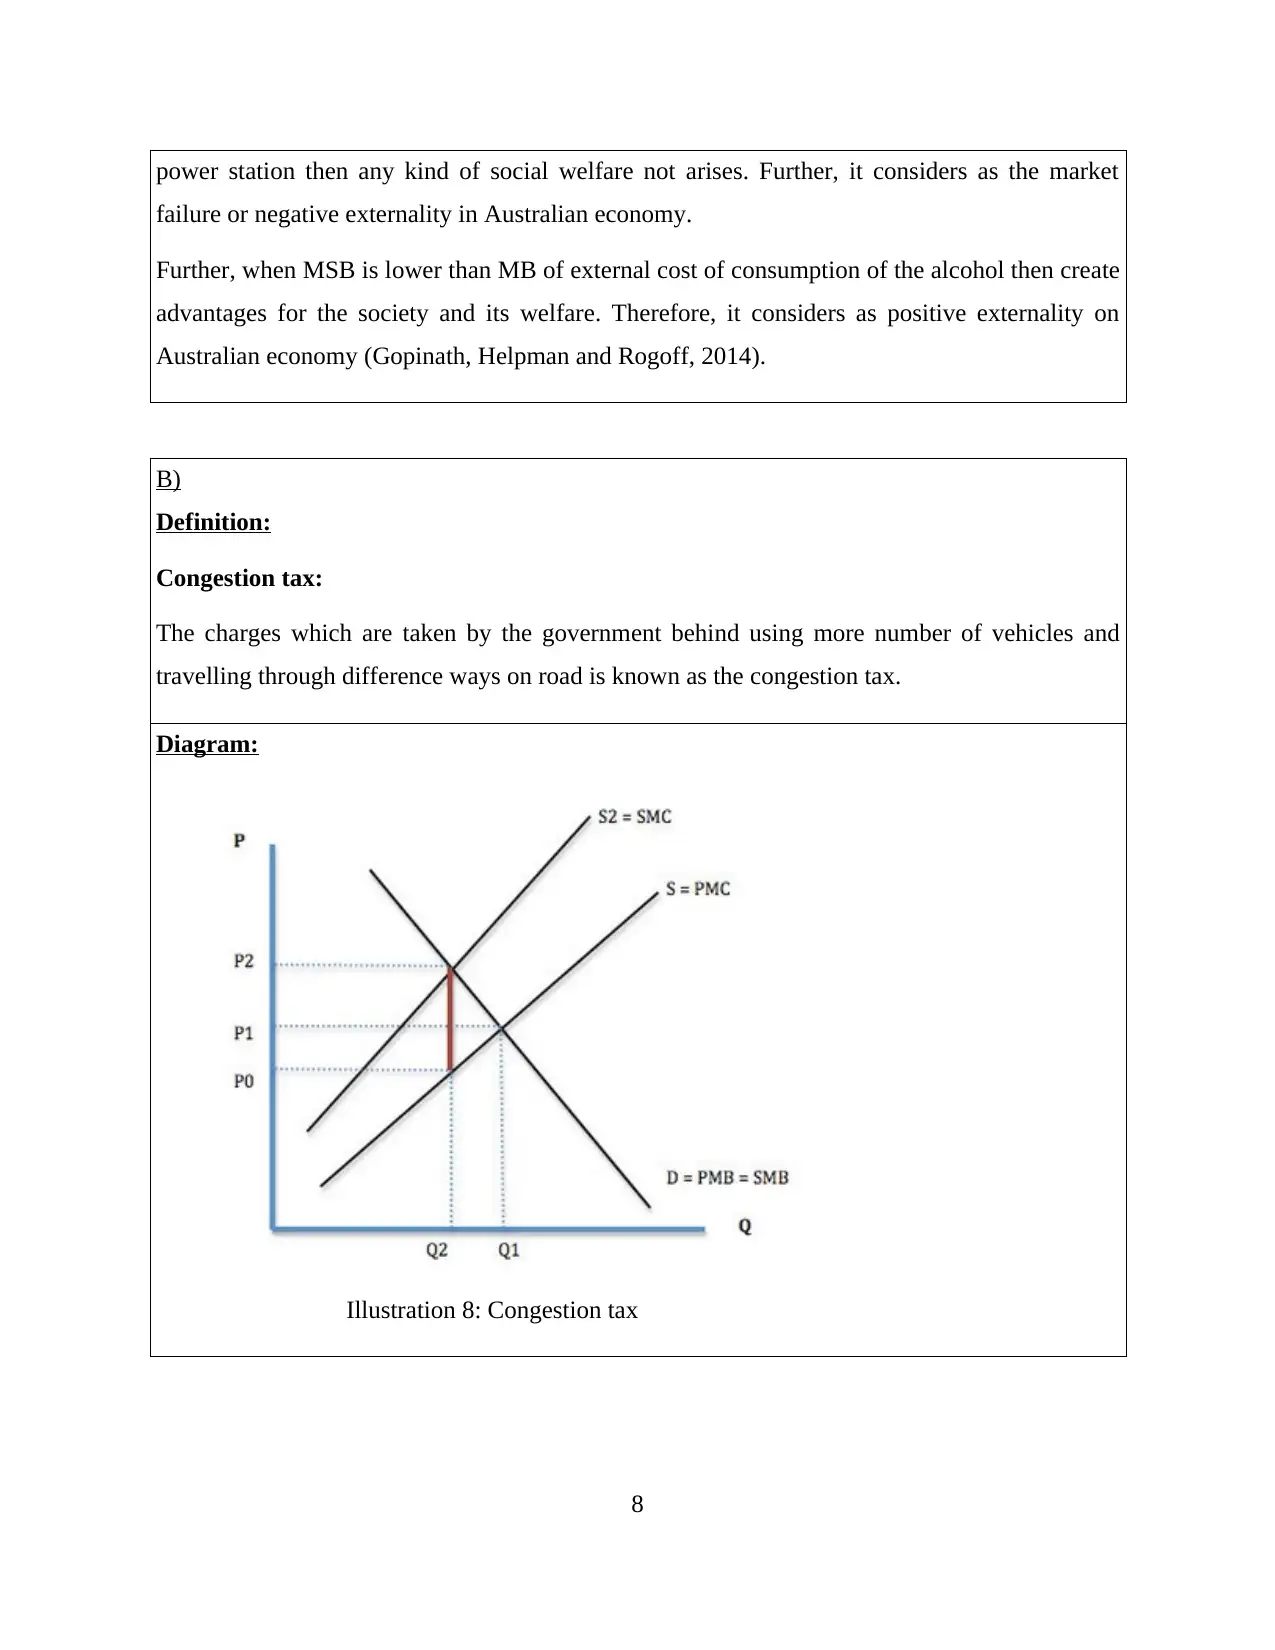
This economics assignment addresses several key concepts. It begins by defining and analyzing monopolistic and oligopolistic market structures, including the use of diagrams and the application of the kinked demand curve. The assignment then explores market failures, specifically external costs of production and consumption, and the impact of congestion taxes. It also examines the circular flow of money through two, three, and four-sector models, considering injections and withdrawals. Finally, the assignment defines inflationary and deflationary gaps, providing calculations related to GDP, withdrawals, and injections. The content includes definitions, diagrams, and analyses of various economic concepts, providing a comprehensive overview of micro and macroeconomics principles.

SHORT ANSWER
QUESTIONS
QUESTIONS
Paraphrase This Document
Need a fresh take? Get an instant paraphrase of this document with our AI Paraphraser

TABLE OF CONTENTS
QUESTION 1...................................................................................................................................1
A)............................................................................................................................................1
B)............................................................................................................................................3
QUESTION 2...................................................................................................................................6
A)............................................................................................................................................6
B)............................................................................................................................................8
QUESTION 3.................................................................................................................................10
A)..........................................................................................................................................10
B)..........................................................................................................................................13
QUESTION 4.................................................................................................................................15
A)..........................................................................................................................................15
B)..........................................................................................................................................17
REFERENCES..............................................................................................................................19

ILLUSTRATION INDEX
Illustration 1: Monopolistic market structure..................................................................................2
Illustration 2: Oligopolistic market structure...................................................................................2
Illustration 3: Demand curve...........................................................................................................4
Illustration 4: Marginal revenue curve.............................................................................................4
Illustration 5: Profit maximisation level..........................................................................................5
Illustration 6: External cost of production.......................................................................................7
Illustration 7: External cost of consumption....................................................................................7
Illustration 8: Congestion tax...........................................................................................................8
Illustration 9: Negative externality due to congestion tax...............................................................9
Illustration 10: Two sector circular flow of income......................................................................11
Illustration 11: Three sector circular flow of income....................................................................11
Illustration 12: Four sector circular flow of money.......................................................................12
Illustration 13: Inflationary gap.....................................................................................................16
Illustration 14: Deflationary gap....................................................................................................16
Illustration 15: Expenditure line....................................................................................................17
⊘ This is a preview!⊘
Do you want full access?
Subscribe today to unlock all pages.

Trusted by 1+ million students worldwide

QUESTION 1
A)
Definition:
Monopolistic market:
The structure of market in which only one company operates in particular area and offer its
goods and services to the people is known as monopolistic market. In this, any other business
cannot enter in the market and operate (Chetty, 2012).
Oligopolistic market:
It is similar with the monopolistic market up to certain extent where instead of one, two or three
companies dominate the area and provide products and services. Further, such businesses have
high market share and generate profit up to the higher level.
Assumption:
It has been assumed that, due to operating single business, level of competition is negligible in
the market. Along with this, firm of monopolistic market able to charge more prices and boost
up profit without any product differentiation.
Apart from this, under the oligopolistic market competition is very low in which up to the very
lower extent companies use product differentiation strategy (Dopfer, 2012).
Diagram:
1
Paraphrase This Document
Need a fresh take? Get an instant paraphrase of this document with our AI Paraphraser

Illustration 1: Monopolistic market structure
Illustration 2: Oligopolistic market structure
Analysis:
Firms operating in monopolistic market not uses strategy of product differentiation because they
already have high market share. On the other side, companies of oligopolistic market adopt this
particular tactic sometimes due to operating two or three firms. The reason is that, attract
2

customers towards them and gain competitive benefits.
B)
Kinked demand curve:
Economic theory of this particular curve is related with the two markets like monopolistic and
oligopoly. Further, the stated curve reflects sticky prices of the product and services using
marginal costs and revenue (Messai and Jouini, 2013).
Calculation of marginal revenue:
Competitor
s quantity
demanded
Price ($) Competitors
follow:
quantity
demanded
Total
revenue
(Column 1
* 2)
Marginal
revenue
(MR)
Marginal
cost (MC)
Marginal
profit (MP)
(MR - MC)
20 200 35 4000 - 1500 0
30 195 40 5850 1850 1500 350
40 190 45 7600 1750 1500 250
50 185 50 9250 1650 1500 150
60 180 55 10800 1550 1500 50
70 175 60 12250 1450 1500 -50
Diagram:
i) Demand curve
3
⊘ This is a preview!⊘
Do you want full access?
Subscribe today to unlock all pages.

Trusted by 1+ million students worldwide

20 30 40 50 60 70
160
165
170
175
180
185
190
195
200
205200
195
190
185
180
175
Illustration 3: Demand curve
ii) Marginal revenue curve
30 40 50 60 70
0
200
400
600
800
1000
1200
1400
1600
1800
20001850 1750 1650 1550 1450
Illustration 4: Marginal revenue curve
iii) Profit maximisation curve
4
160
165
170
175
180
185
190
195
200
205200
195
190
185
180
175
Illustration 3: Demand curve
ii) Marginal revenue curve
30 40 50 60 70
0
200
400
600
800
1000
1200
1400
1600
1800
20001850 1750 1650 1550 1450
Illustration 4: Marginal revenue curve
iii) Profit maximisation curve
4
Paraphrase This Document
Need a fresh take? Get an instant paraphrase of this document with our AI Paraphraser

20 30 40 50 60 70
-100
-50
0
50
100
150
200
250
300
350
400
0
350
250
150
50
-50
Illustration 5: Profit maximisation level
Analysis:
i) Demand curve
Under the kinked demand curve all the prices along with output of product are represented. In
the present scenario as quantity of demand increases of the competitors in oligopolistic market
then prices declined by the company. Due to this particular reason, curve of demand is of the
declining trend.
ii) Marginal revenue curve
When looking at the above stated marginal revenue curve then it can be determined that, sum of
money of MR declining as level of output increases. The reason is that prices behind changing
quantity demanded are reducing. At the quantity of 30 units, MR of the firm in oligopolistic
market is $1850. Further, as demand enhances up to 60 and 70 units then prices declined which
resulting is that, marginal revenue reduced up $1550 and $1450 respectively.
iii) Profit maximisation curve
As per the above calculated marginal profit and graph it can be determined that maximum profit
is worth of $350 where output units are total 30. Henceforth, profit maximising level of output
is 30 units.
5

QUESTION 2
A)
Definition:
Market failure:
The economic condition in which an economy makes expenses to force supply and demand but
not create positive impact on welfare of the society, considered as market failure.
External costs:
Those expenses which impose on third party due to consuming and manufacturing products and
services by an individual are known as external costs (Chetty and et.al., 2013).
MSC:
Adding one more private expenses to the cost of external, marginal social cost is obtained.
MC:
When a company produce one additional product then cost incurred which identified as
marginal cost.
MSB:
Net social value of any kind of goods, services and activities for the society in an economy is
called as marginal social benefit (Erosa, Fuster and Kambourov, 2016).
MB:
In a specific product or activity when additional advantage generated by using one more unit is
known as marginal benefit
Illustration:
6
⊘ This is a preview!⊘
Do you want full access?
Subscribe today to unlock all pages.

Trusted by 1+ million students worldwide

Illustration 6: External cost of production
Illustration 7: External cost of consumption
Explanation:
When MSC is higher of as compare to the MC under the external cost of production of coal fire
7
Illustration 7: External cost of consumption
Explanation:
When MSC is higher of as compare to the MC under the external cost of production of coal fire
7
Paraphrase This Document
Need a fresh take? Get an instant paraphrase of this document with our AI Paraphraser

power station then any kind of social welfare not arises. Further, it considers as the market
failure or negative externality in Australian economy.
Further, when MSB is lower than MB of external cost of consumption of the alcohol then create
advantages for the society and its welfare. Therefore, it considers as positive externality on
Australian economy (Gopinath, Helpman and Rogoff, 2014).
B)
Definition:
Congestion tax:
The charges which are taken by the government behind using more number of vehicles and
travelling through difference ways on road is known as the congestion tax.
Diagram:
Illustration 8: Congestion tax
8

Illustration 9: Negative externality due to congestion tax
Advantages and Disadvantages of three measures:
1. Enhance excise duty or petrol
When excise duty charges are increased by government of Australia then people start to prefer
bus as compare to personal motors like car, bike etc. which is main advantage. Therefore,
charges of congestion will decline in the economy.
However, selling of petrol decline which lead to create negative impact on the revenue of the
government (Anderson, 2016). Along with this, due to tax reduction Australian government
unable to spend more money on the public welfare.
2. Using bus and cycles within peak times
In the peak times, when public use transportation services like bus and cycle then pollution will
decline which is main benefit for the Australian economy. Along with this, it supports to the
economy in terms of reducing congestion level.
In opposite to this, tax and charges on congestion decline by which government incomes
affected in negative way which is disadvantages of this measure.
9
⊘ This is a preview!⊘
Do you want full access?
Subscribe today to unlock all pages.

Trusted by 1+ million students worldwide
1 out of 24
Related Documents

Your All-in-One AI-Powered Toolkit for Academic Success.
 +13062052269
info@desklib.com
Available 24*7 on WhatsApp / Email
Unlock your academic potential
Copyright © 2020–2025 A2Z Services. All Rights Reserved. Developed and managed by ZUCOL.