University Economics Assignment: ECO10250, Price Elasticity Analysis
VerifiedAdded on  2022/10/12
|11
|1742
|444
Homework Assignment
AI Summary
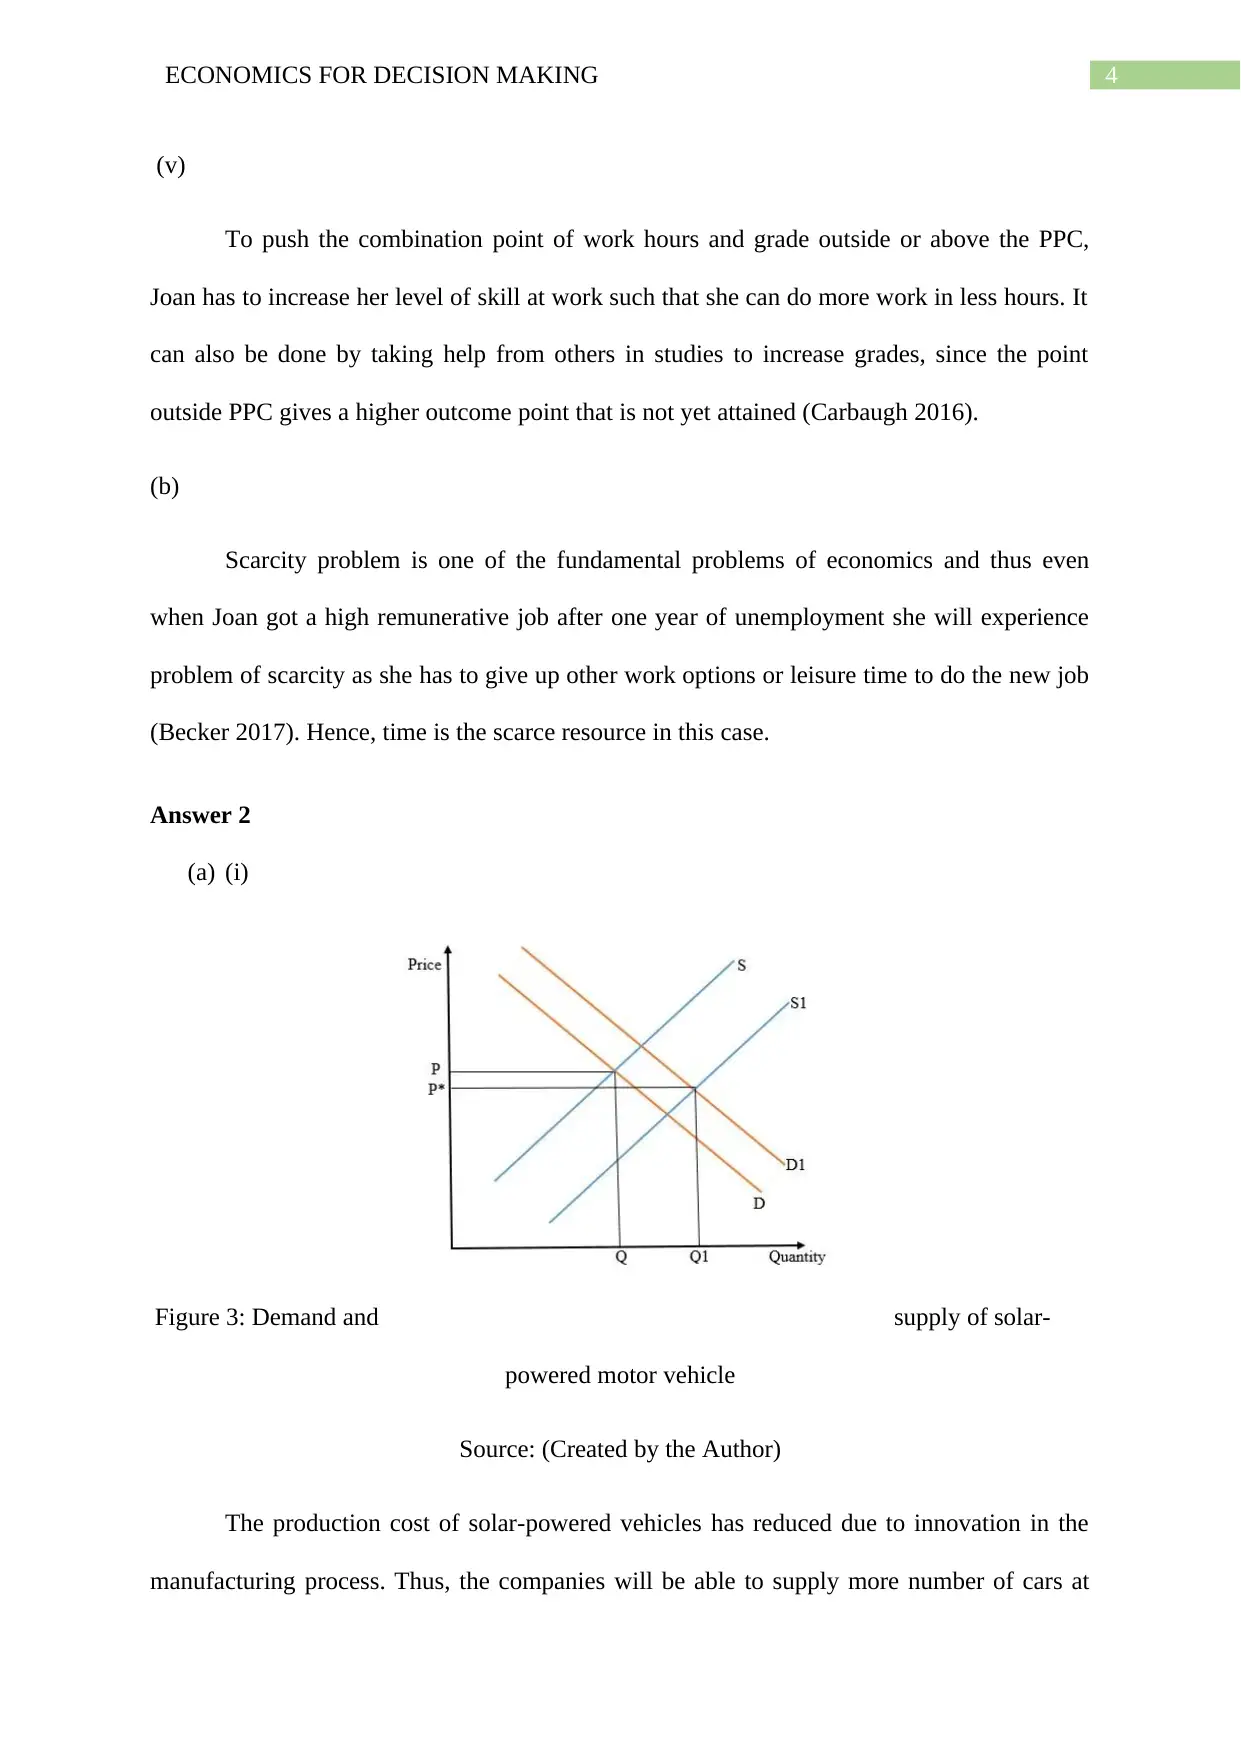
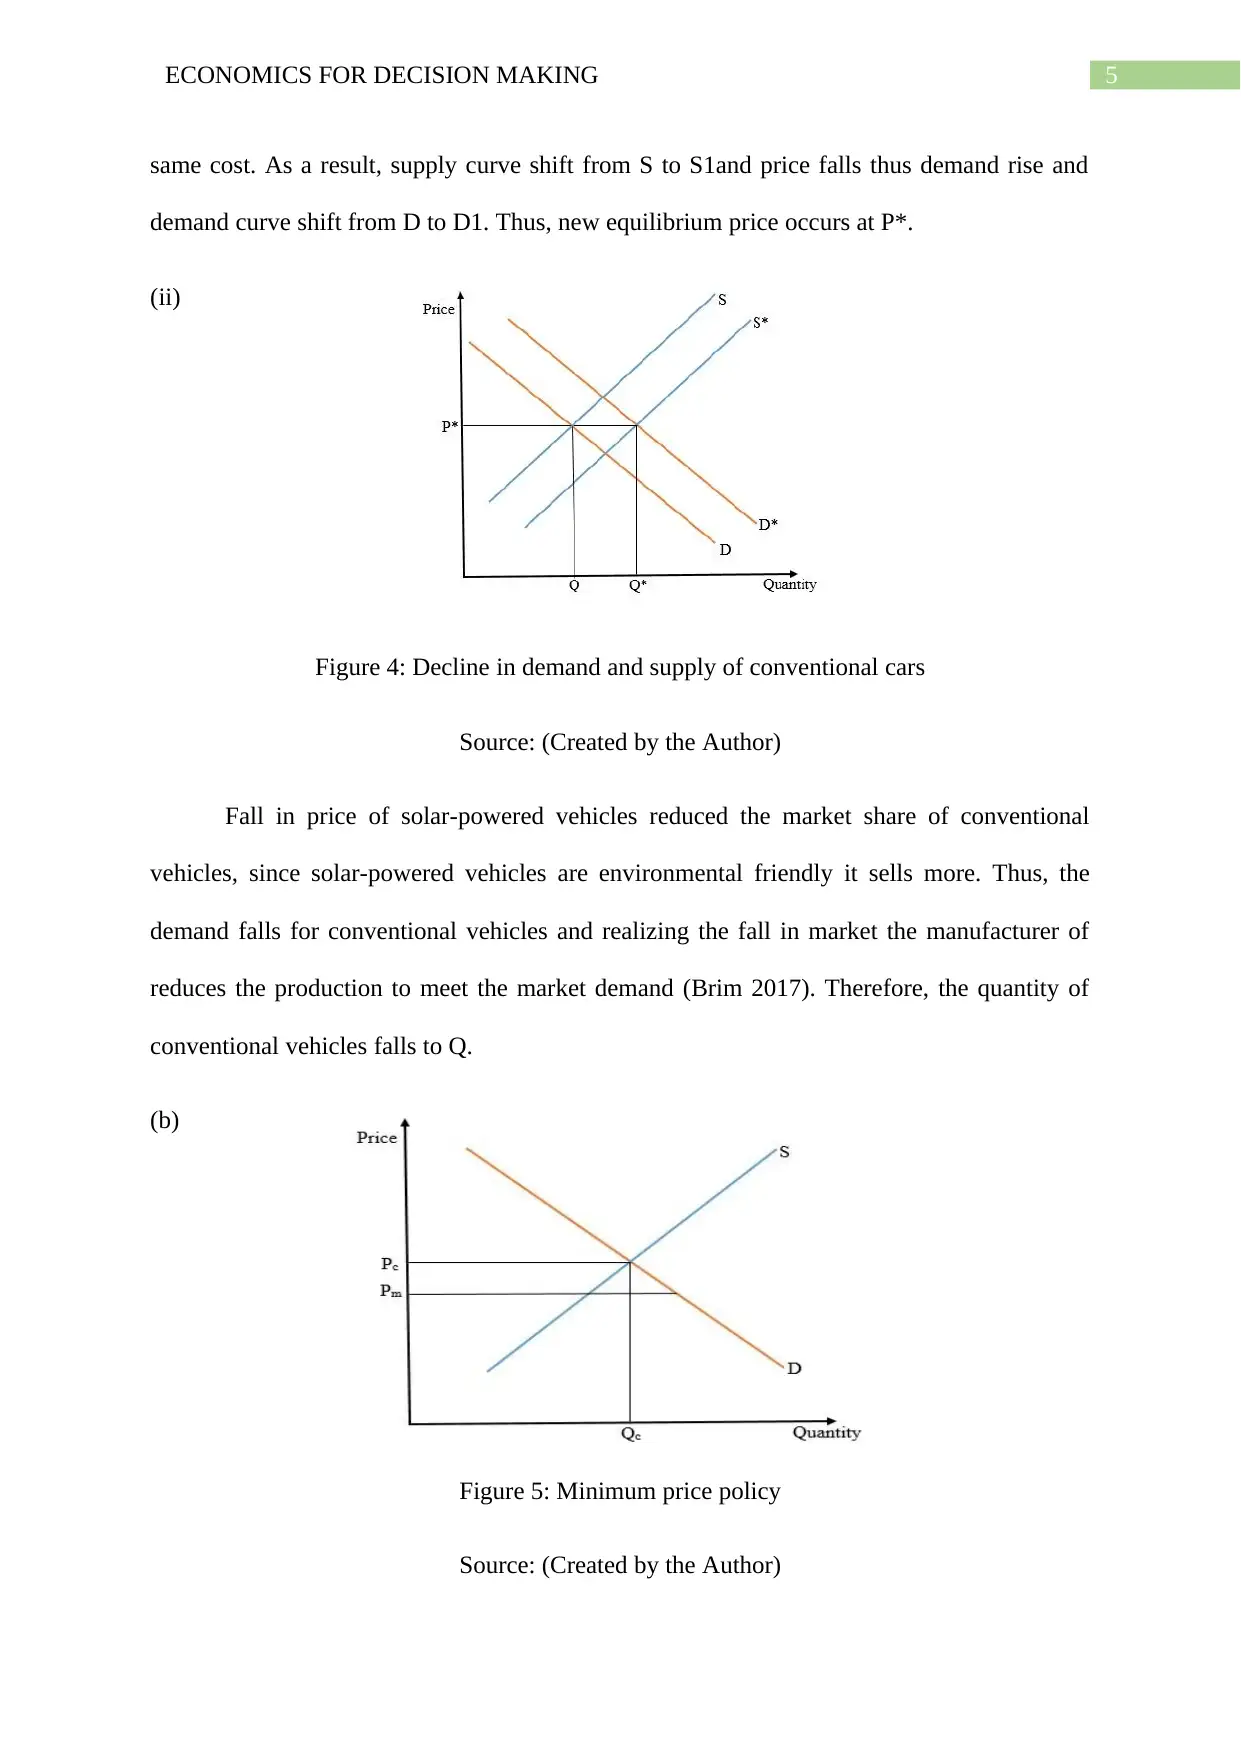
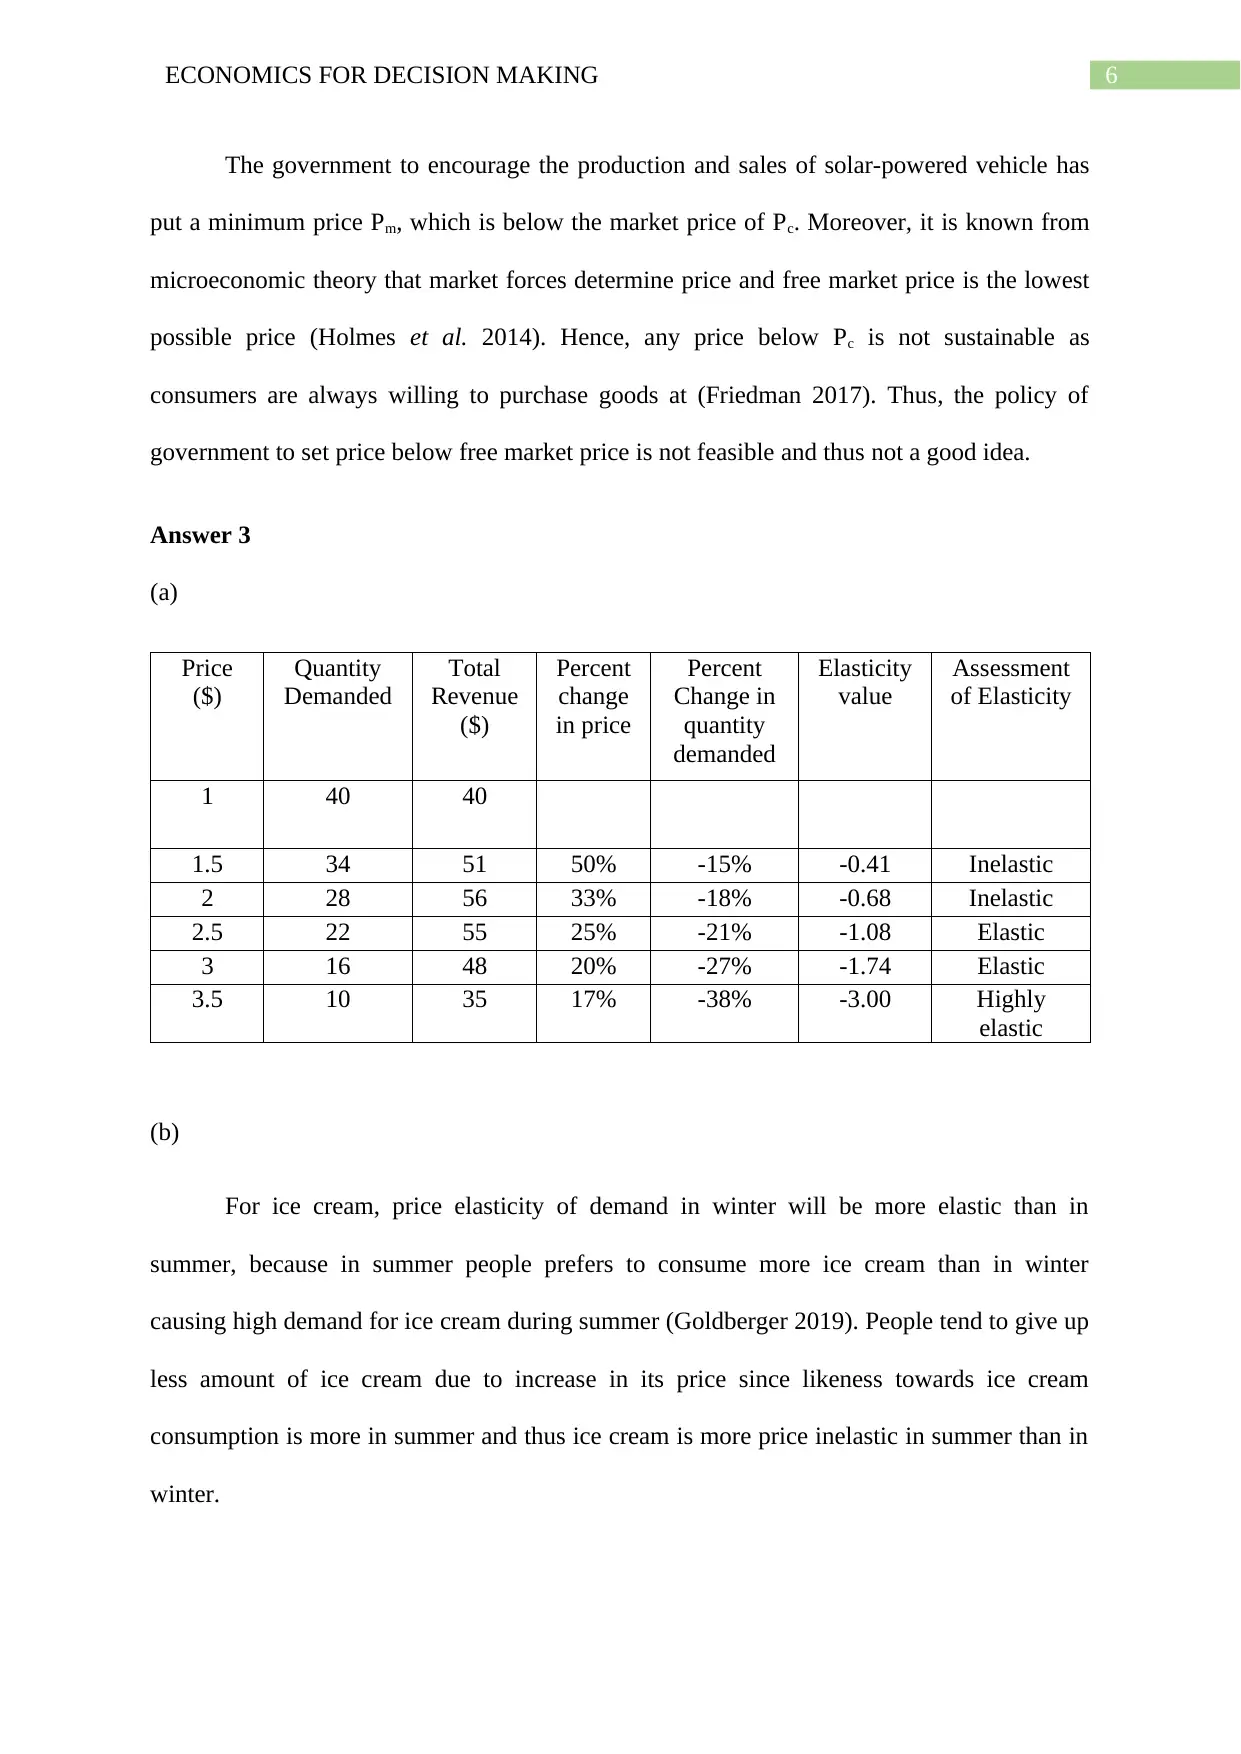
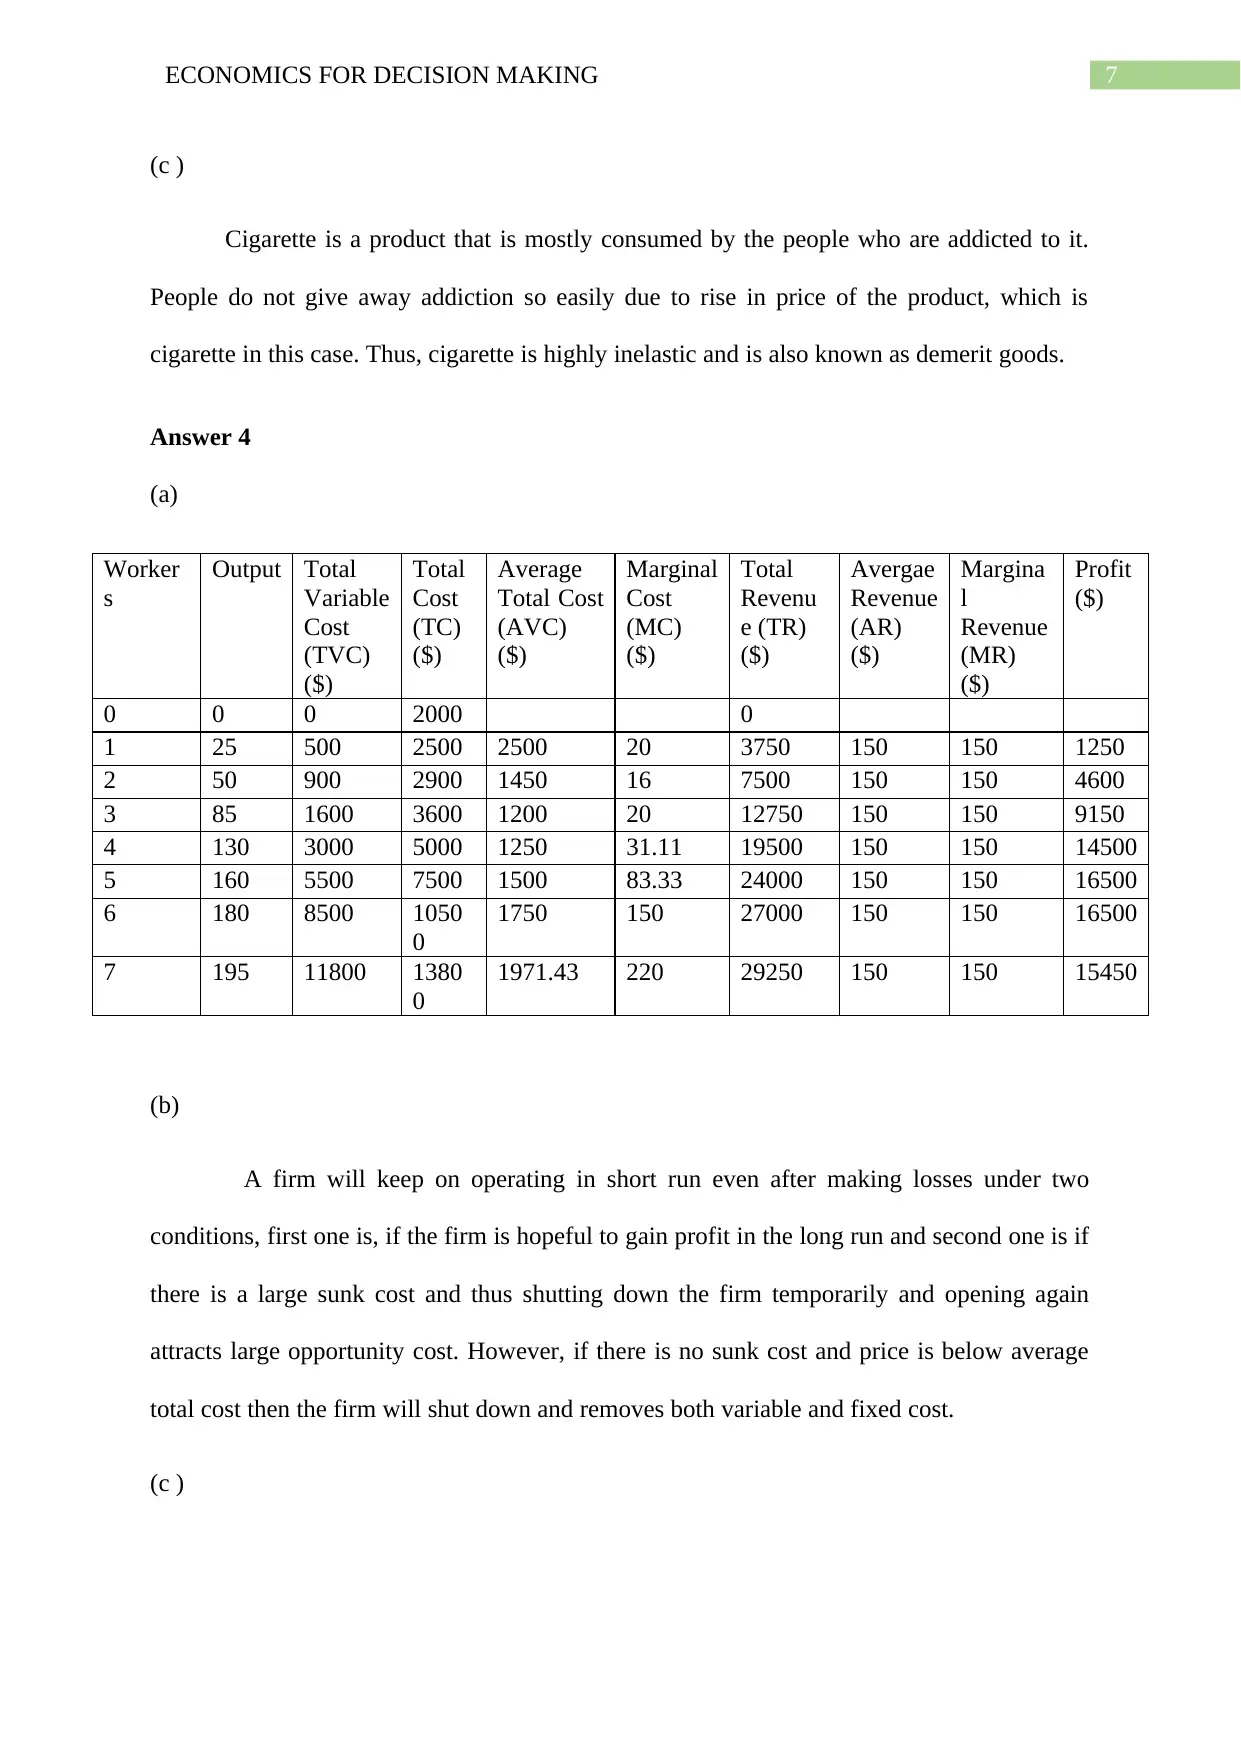
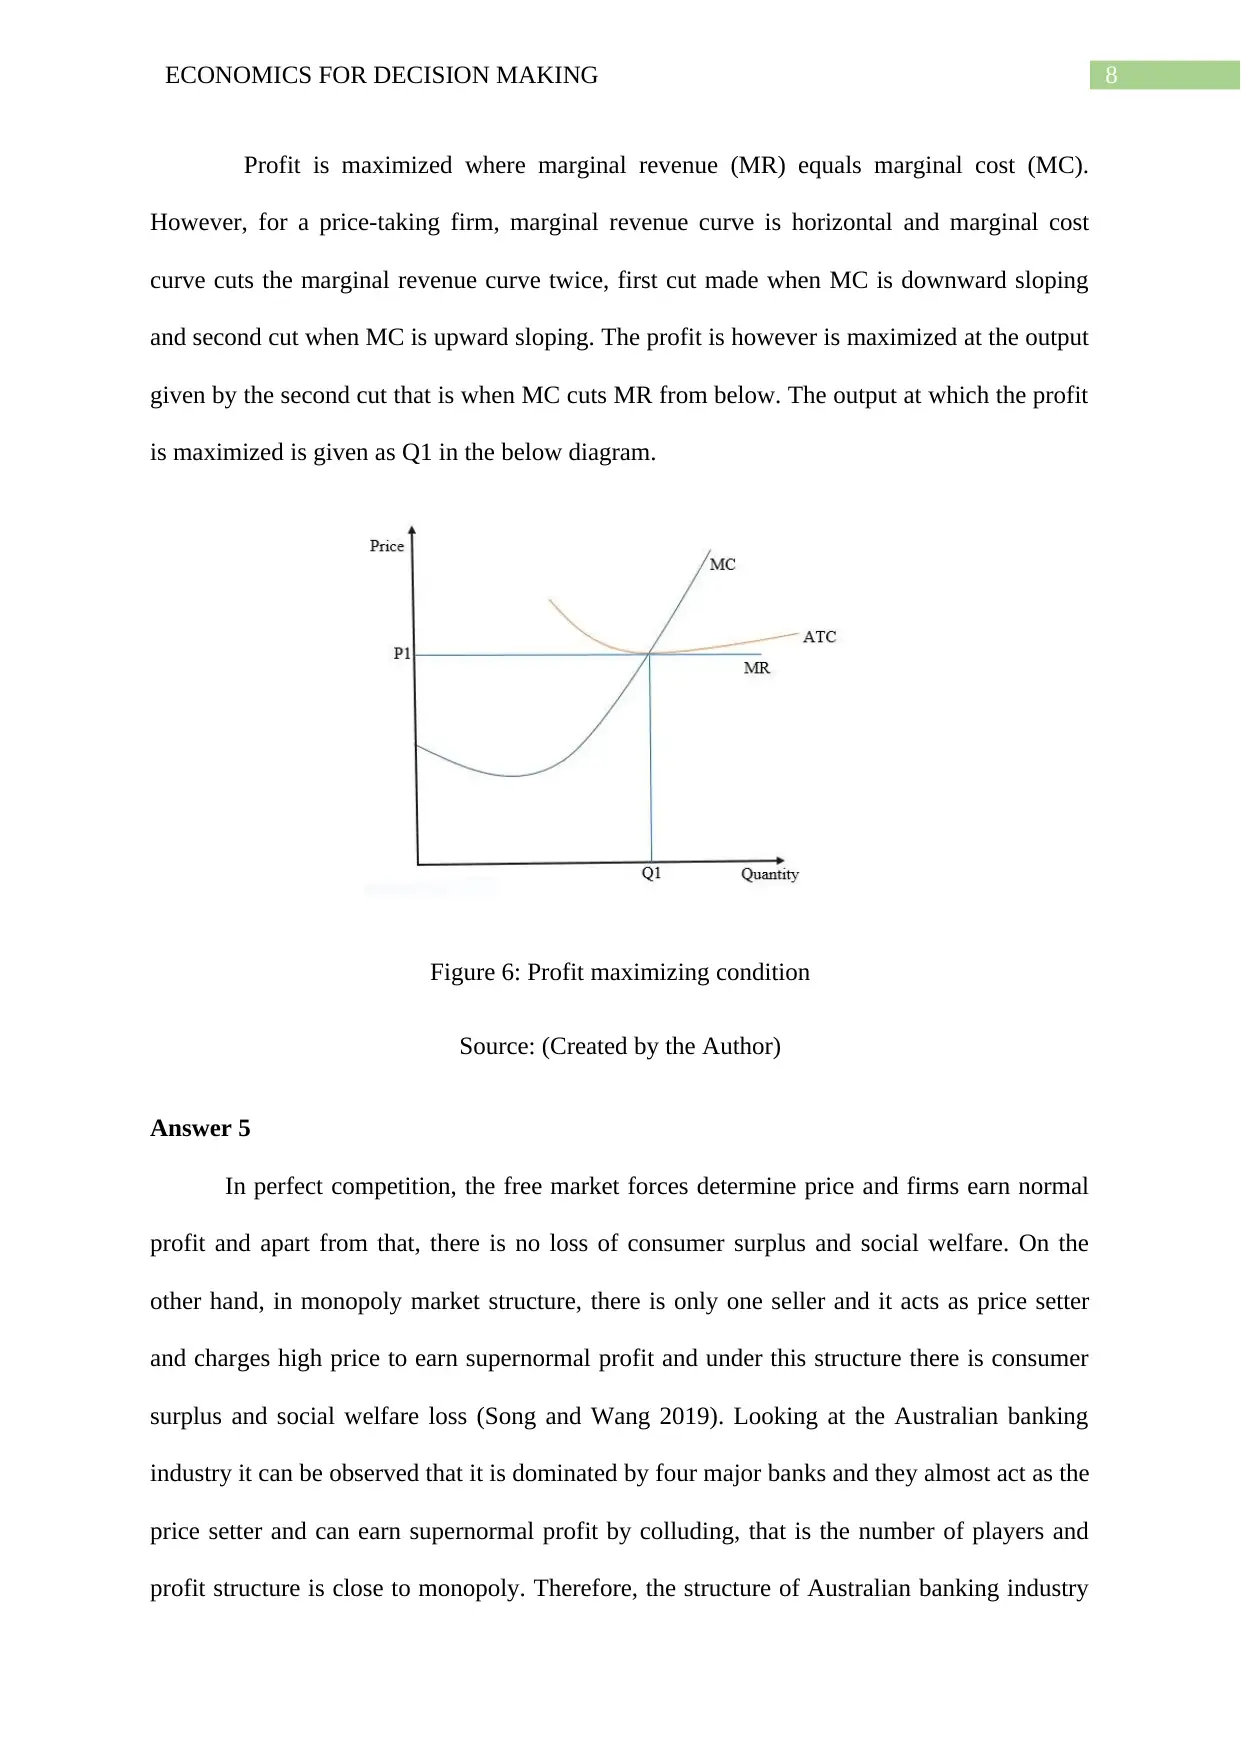
This economics assignment delves into key concepts including price elasticity of demand, opportunity cost, and market structures. The student analyzes a production possibility curve (PPC) to illustrate opportunity cost and inefficiency. The assignment further examines market dynamics, including shifts in supply and demand, equilibrium, and the impact of price controls. Elasticity calculations are performed, and real-world examples, such as the demand for ice cream and cigarettes, are used to illustrate different elasticity scenarios. The assignment also explores cost structures, profit maximization, and the behavior of firms in the short run. Finally, it compares perfect competition and monopoly, applying these concepts to the Australian banking industry and the cab app market, highlighting consumer welfare implications.

Running head: ECONOMICS FOR DECISION MAKING
Economics for Decision Making
Name of the Student
Name of the University
Student ID
Economics for Decision Making
Name of the Student
Name of the University
Student ID
Paraphrase This Document
Need a fresh take? Get an instant paraphrase of this document with our AI Paraphraser

1ECONOMICS FOR DECISION MAKING
Table of Contents
Answer 1....................................................................................................................................2
Answer 2....................................................................................................................................4
Answer 3....................................................................................................................................6
Answer 4....................................................................................................................................7
Answer 5....................................................................................................................................8
References................................................................................................................................10

2ECONOMICS FOR DECISION MAKING
Answer 1
(a) (i)
Choices
Production
possibilities
Grade (%) Work
(hours per week)
A
B
C
D
E
0
20
40
60
80
60
55
45
30
0
Figure 1: PPC of Joan
Source: (Created by the Author)
0 10 20 30 40 50 60 70 80 90
0
10
20
30
40
50
60
70
A
B
C
D
E
Production Possibility Curve
Grade %
Work hours per week
Answer 1
(a) (i)
Choices
Production
possibilities
Grade (%) Work
(hours per week)
A
B
C
D
E
0
20
40
60
80
60
55
45
30
0
Figure 1: PPC of Joan
Source: (Created by the Author)
0 10 20 30 40 50 60 70 80 90
0
10
20
30
40
50
60
70
A
B
C
D
E
Production Possibility Curve
Grade %
Work hours per week
⊘ This is a preview!⊘
Do you want full access?
Subscribe today to unlock all pages.

Trusted by 1+ million students worldwide

3ECONOMICS FOR DECISION MAKING
(ii)
Curved shape of PPC occurs when opportunity cost is increasing and the PPC is
straight line when opportunity cost is constant. In figure 1, the PPC is curved and it is
observed that Joan has to give up 5 hours of work to increase first 20% of the grade and to
increase from 20 to 40% then Joan has to give up 10 more hours and it increases further
showing an increasing opportunity cost.
(iii)
Figure 2: Increasing grade % - constant opportunity cost
Source: (Created by the Author)
In figure 2, the PPC curve takes a straight-line shape and this happens due to constant
opportunity cost that means Joan has to give up 15 hours of work for every 20% rise in grade
percent (Kelly and Pevehouse 2015). This constant change in opportunity cost makes the
straight-line shape suitable for PPC
(iv)
A point inside the PPC is an inefficient point and gives lower level of outcome, thus if
Joan’s combination points of work hours and grades is inside the PPC then she will face loss.
0 10 20 30 40 50 60 70 80 90
0
10
20
30
40
50
60
70
A
B
C
D
E
Constant Opportunity Cost
Grade %
Work hours per week
Paraphrase This Document
Need a fresh take? Get an instant paraphrase of this document with our AI Paraphraser

4ECONOMICS FOR DECISION MAKING
(v)
To push the combination point of work hours and grade outside or above the PPC,
Joan has to increase her level of skill at work such that she can do more work in less hours. It
can also be done by taking help from others in studies to increase grades, since the point
outside PPC gives a higher outcome point that is not yet attained (Carbaugh 2016).
(b)
Scarcity problem is one of the fundamental problems of economics and thus even
when Joan got a high remunerative job after one year of unemployment she will experience
problem of scarcity as she has to give up other work options or leisure time to do the new job
(Becker 2017). Hence, time is the scarce resource in this case.
Answer 2
(a) (i)
Figure 3: Demand and supply of solar-
powered motor vehicle
Source: (Created by the Author)
The production cost of solar-powered vehicles has reduced due to innovation in the
manufacturing process. Thus, the companies will be able to supply more number of cars at

5ECONOMICS FOR DECISION MAKING
same cost. As a result, supply curve shift from S to S1and price falls thus demand rise and
demand curve shift from D to D1. Thus, new equilibrium price occurs at P*.
(ii)
Figure 4: Decline in demand and supply of conventional cars
Source: (Created by the Author)
Fall in price of solar-powered vehicles reduced the market share of conventional
vehicles, since solar-powered vehicles are environmental friendly it sells more. Thus, the
demand falls for conventional vehicles and realizing the fall in market the manufacturer of
reduces the production to meet the market demand (Brim 2017). Therefore, the quantity of
conventional vehicles falls to Q.
(b)
Figure 5: Minimum price policy
Source: (Created by the Author)
⊘ This is a preview!⊘
Do you want full access?
Subscribe today to unlock all pages.

Trusted by 1+ million students worldwide

6ECONOMICS FOR DECISION MAKING
The government to encourage the production and sales of solar-powered vehicle has
put a minimum price Pm, which is below the market price of Pc. Moreover, it is known from
microeconomic theory that market forces determine price and free market price is the lowest
possible price (Holmes et al. 2014). Hence, any price below Pc is not sustainable as
consumers are always willing to purchase goods at (Friedman 2017). Thus, the policy of
government to set price below free market price is not feasible and thus not a good idea.
Answer 3
(a)
Price
($)
Quantity
Demanded
Total
Revenue
($)
Percent
change
in price
Percent
Change in
quantity
demanded
Elasticity
value
Assessment
of Elasticity
1 40 40
1.5 34 51 50% -15% -0.41 Inelastic
2 28 56 33% -18% -0.68 Inelastic
2.5 22 55 25% -21% -1.08 Elastic
3 16 48 20% -27% -1.74 Elastic
3.5 10 35 17% -38% -3.00 Highly
elastic
(b)
For ice cream, price elasticity of demand in winter will be more elastic than in
summer, because in summer people prefers to consume more ice cream than in winter
causing high demand for ice cream during summer (Goldberger 2019). People tend to give up
less amount of ice cream due to increase in its price since likeness towards ice cream
consumption is more in summer and thus ice cream is more price inelastic in summer than in
winter.
Paraphrase This Document
Need a fresh take? Get an instant paraphrase of this document with our AI Paraphraser

7ECONOMICS FOR DECISION MAKING
(c )
Cigarette is a product that is mostly consumed by the people who are addicted to it.
People do not give away addiction so easily due to rise in price of the product, which is
cigarette in this case. Thus, cigarette is highly inelastic and is also known as demerit goods.
Answer 4
(a)
Worker
s
Output Total
Variable
Cost
(TVC)
($)
Total
Cost
(TC)
($)
Average
Total Cost
(AVC)
($)
Marginal
Cost
(MC)
($)
Total
Revenu
e (TR)
($)
Avergae
Revenue
(AR)
($)
Margina
l
Revenue
(MR)
($)
Profit
($)
0 0 0 2000 0
1 25 500 2500 2500 20 3750 150 150 1250
2 50 900 2900 1450 16 7500 150 150 4600
3 85 1600 3600 1200 20 12750 150 150 9150
4 130 3000 5000 1250 31.11 19500 150 150 14500
5 160 5500 7500 1500 83.33 24000 150 150 16500
6 180 8500 1050
0
1750 150 27000 150 150 16500
7 195 11800 1380
0
1971.43 220 29250 150 150 15450
(b)
A firm will keep on operating in short run even after making losses under two
conditions, first one is, if the firm is hopeful to gain profit in the long run and second one is if
there is a large sunk cost and thus shutting down the firm temporarily and opening again
attracts large opportunity cost. However, if there is no sunk cost and price is below average
total cost then the firm will shut down and removes both variable and fixed cost.
(c )
(c )
Cigarette is a product that is mostly consumed by the people who are addicted to it.
People do not give away addiction so easily due to rise in price of the product, which is
cigarette in this case. Thus, cigarette is highly inelastic and is also known as demerit goods.
Answer 4
(a)
Worker
s
Output Total
Variable
Cost
(TVC)
($)
Total
Cost
(TC)
($)
Average
Total Cost
(AVC)
($)
Marginal
Cost
(MC)
($)
Total
Revenu
e (TR)
($)
Avergae
Revenue
(AR)
($)
Margina
l
Revenue
(MR)
($)
Profit
($)
0 0 0 2000 0
1 25 500 2500 2500 20 3750 150 150 1250
2 50 900 2900 1450 16 7500 150 150 4600
3 85 1600 3600 1200 20 12750 150 150 9150
4 130 3000 5000 1250 31.11 19500 150 150 14500
5 160 5500 7500 1500 83.33 24000 150 150 16500
6 180 8500 1050
0
1750 150 27000 150 150 16500
7 195 11800 1380
0
1971.43 220 29250 150 150 15450
(b)
A firm will keep on operating in short run even after making losses under two
conditions, first one is, if the firm is hopeful to gain profit in the long run and second one is if
there is a large sunk cost and thus shutting down the firm temporarily and opening again
attracts large opportunity cost. However, if there is no sunk cost and price is below average
total cost then the firm will shut down and removes both variable and fixed cost.
(c )

8ECONOMICS FOR DECISION MAKING
Profit is maximized where marginal revenue (MR) equals marginal cost (MC).
However, for a price-taking firm, marginal revenue curve is horizontal and marginal cost
curve cuts the marginal revenue curve twice, first cut made when MC is downward sloping
and second cut when MC is upward sloping. The profit is however is maximized at the output
given by the second cut that is when MC cuts MR from below. The output at which the profit
is maximized is given as Q1 in the below diagram.
Figure 6: Profit maximizing condition
Source: (Created by the Author)
Answer 5
In perfect competition, the free market forces determine price and firms earn normal
profit and apart from that, there is no loss of consumer surplus and social welfare. On the
other hand, in monopoly market structure, there is only one seller and it acts as price setter
and charges high price to earn supernormal profit and under this structure there is consumer
surplus and social welfare loss (Song and Wang 2019). Looking at the Australian banking
industry it can be observed that it is dominated by four major banks and they almost act as the
price setter and can earn supernormal profit by colluding, that is the number of players and
profit structure is close to monopoly. Therefore, the structure of Australian banking industry
⊘ This is a preview!⊘
Do you want full access?
Subscribe today to unlock all pages.

Trusted by 1+ million students worldwide

9ECONOMICS FOR DECISION MAKING
is harmful for the consumers, as it possesses the characteristics of monopoly market.
However, as there is more than one firm the market structure is actually oligopoly one and
cab app industry is oligopoly one and is similar to the banking industry.
is harmful for the consumers, as it possesses the characteristics of monopoly market.
However, as there is more than one firm the market structure is actually oligopoly one and
cab app industry is oligopoly one and is similar to the banking industry.
Paraphrase This Document
Need a fresh take? Get an instant paraphrase of this document with our AI Paraphraser

10ECONOMICS FOR DECISION MAKING
References
Becker, G.S., 2017. Economic theory. Routledge.
Brim, O., 2017. The economic theory of representative government. Routledge.
Carbaugh, R., 2016. Contemporary economics: an applications approach. Routledge.
Friedman, M., 2017. Price theory. Routledge.
Goldberger, A., 2019. Functional form and utility: A review of consumer demand theory.
Routledge.
Holmes, J., Meng, Y., Meier, P.S., Brennan, A., Angus, C., Campbell-Burton, A., Guo, Y.,
Hill-McManus, D. and Purshouse, R.C., 2014. Effects of minimum unit pricing for alcohol on
different income and socioeconomic groups: a modelling study. The Lancet, 383(9929),
pp.1655-1664.
Kelley, J.G. and Pevehouse, J.C., 2015. An opportunity cost theory of US treaty
behavior. International Studies Quarterly, 59(3), pp.531-543.
Song, M. and Wang, S., 2018. Market competition, green technology progress and
comparative advantages in China. Management Decision, 56(1), pp.188-203.
White, M.D., 2019, July. Nudging Merit Goods: Conceptual, Normative, and Practical
Connections. In Forum for Social Economics (Vol. 48, No. 3, pp. 248-263). Routledge.
1 out of 11
Related Documents

Your All-in-One AI-Powered Toolkit for Academic Success.
 +13062052269
info@desklib.com
Available 24*7 on WhatsApp / Email
Unlock your academic potential
Copyright © 2020–2025 A2Z Services. All Rights Reserved. Developed and managed by ZUCOL.