Exploring Perfect Competition, Elasticity & Externalities in Economics
VerifiedAdded on 2023/06/07
|10
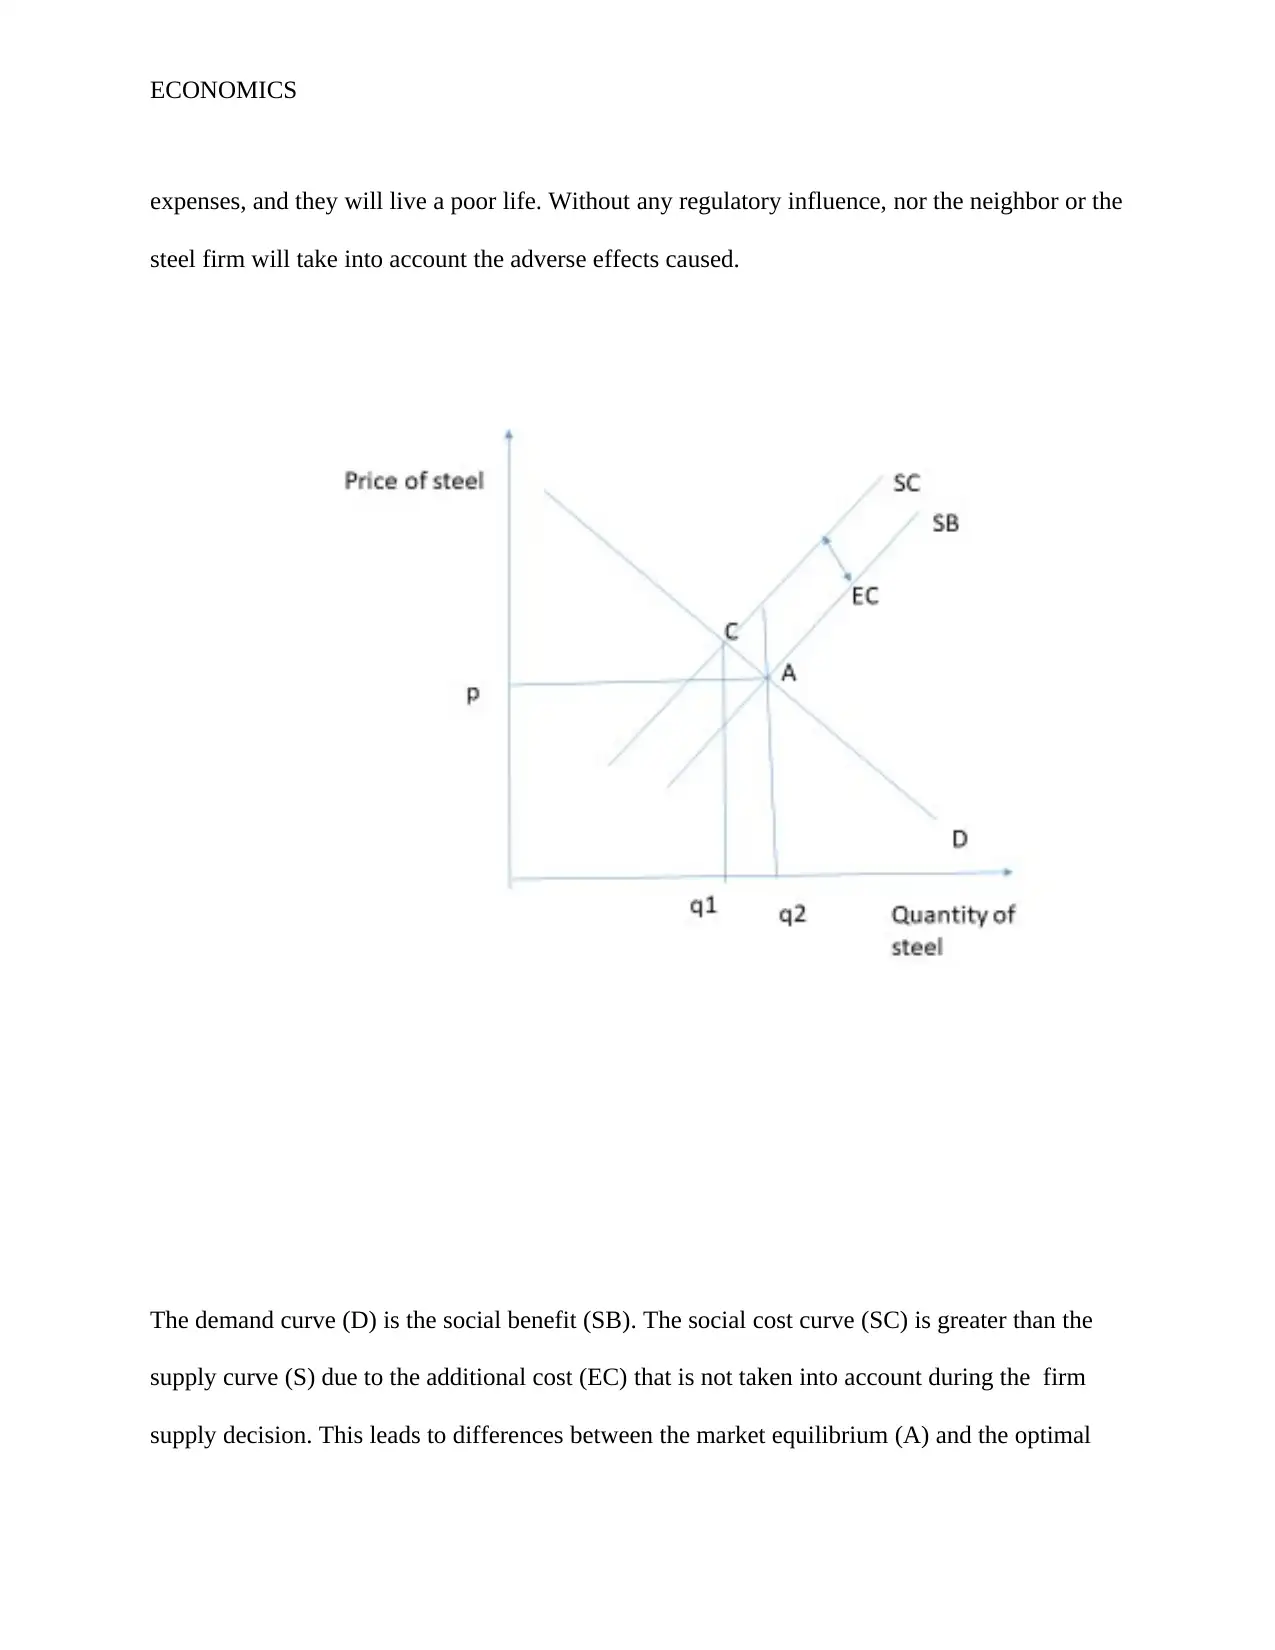
|1414
|178
Homework Assignment
AI Summary
This economics assignment provides an analysis of three key concepts: perfect competition, price elasticity of supply, and negative externalities. The assignment begins by defining and illustrating perfect competition with the example of street food vendors, highlighting the characteristics such as free entry and exit, perfect knowledge, homogenous products, and price-taking behavior. It then calculates and interprets the price elasticity of supply for Australian rice production over a decade, discussing factors influencing supply elasticity like storage capacity, reaction costs, and the number of producers. Finally, the assignment explains negative externalities, differentiating between production and consumption externalities, using the example of a steel producing firm and loud music, and discusses government interventions such as taxes and tradable emission permits to internalize these externalities, emphasizing the need for collaboration between government and business for sustainable economic and environmental decisions.

1 out of 10
Your All-in-One AI-Powered Toolkit for Academic Success.
+13062052269
info@desklib.com
Available 24*7 on WhatsApp / Email
![[object Object]](/_next/static/media/star-bottom.7253800d.svg)
Copyright © 2020–2026 A2Z Services. All Rights Reserved. Developed and managed by ZUCOL.