Economics Assignment: Micro and Macroeconomic Analysis - 2018
VerifiedAdded on 2023/06/08
|13
|2574
|90
Homework Assignment
AI Summary
This economics assignment addresses microeconomic and macroeconomic concepts, including market structures, pricing strategies, and business cycles. The first section analyzes the duopoly market structure of Coles and Woolworths, exploring pricing effects, and the interests of firms in a price discount war, along with the monopolistic competition of vegetable farmers. The second part examines business cycles in Spain and India, analyzing unemployment rates, inflation, and the effects of falling energy costs. The assignment requires the use of economic theories, diagrams, and analysis of macroeconomic indicators, such as interest rates, GDP, and consumer price index to understand the dynamics of various economies. The answers provided in this assignment are well researched and referenced.

QUESTIONS & ANSWERS 1
QUESTIONS & ANSWERS
Student Name
Institution Affiliation
Facilitator
Course
Date
QUESTIONS & ANSWERS
Student Name
Institution Affiliation
Facilitator
Course
Date
Paraphrase This Document
Need a fresh take? Get an instant paraphrase of this document with our AI Paraphraser
QUESTIONS & ANSWERS 2
1. What type of market structure do Coles and Woolworths operate in? Justify your
answer with reference to some limited research and the appropriate economic theories.
Your answer should include a diagram. (5 marks)
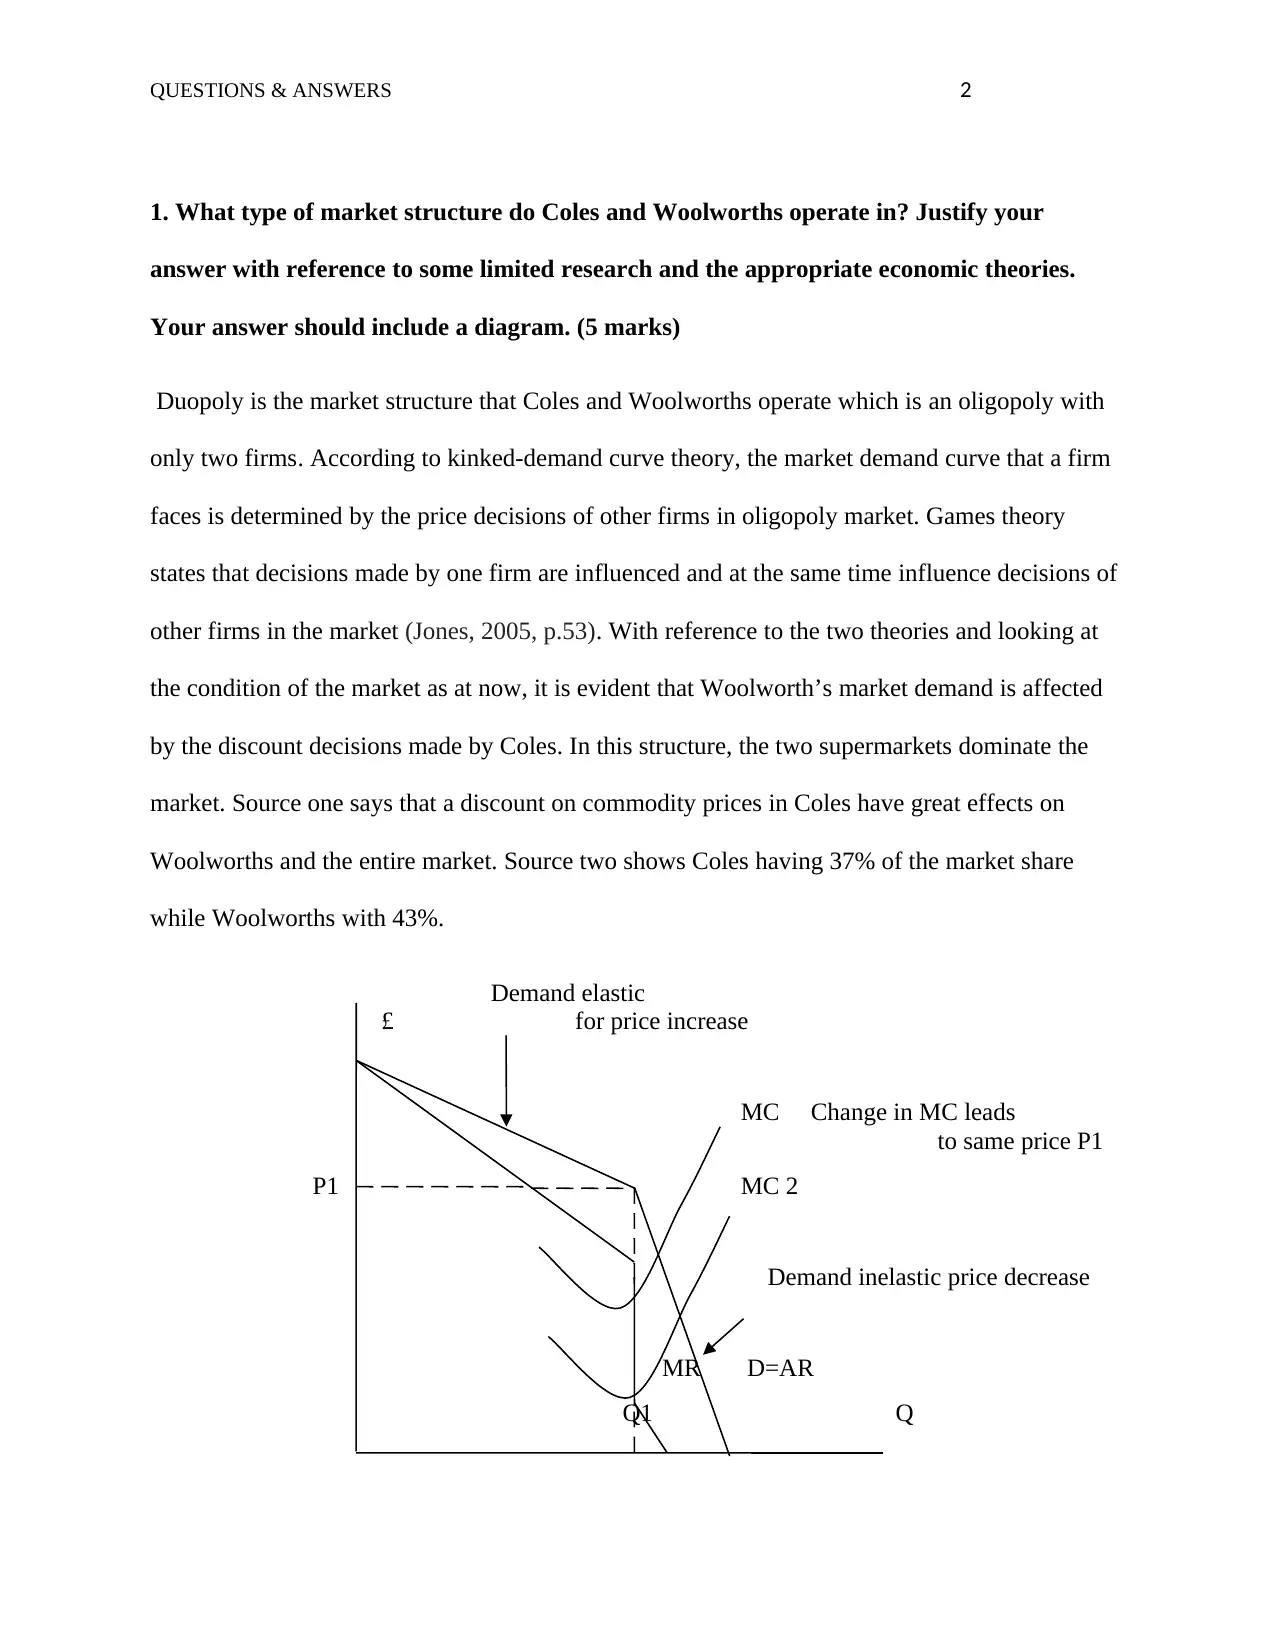
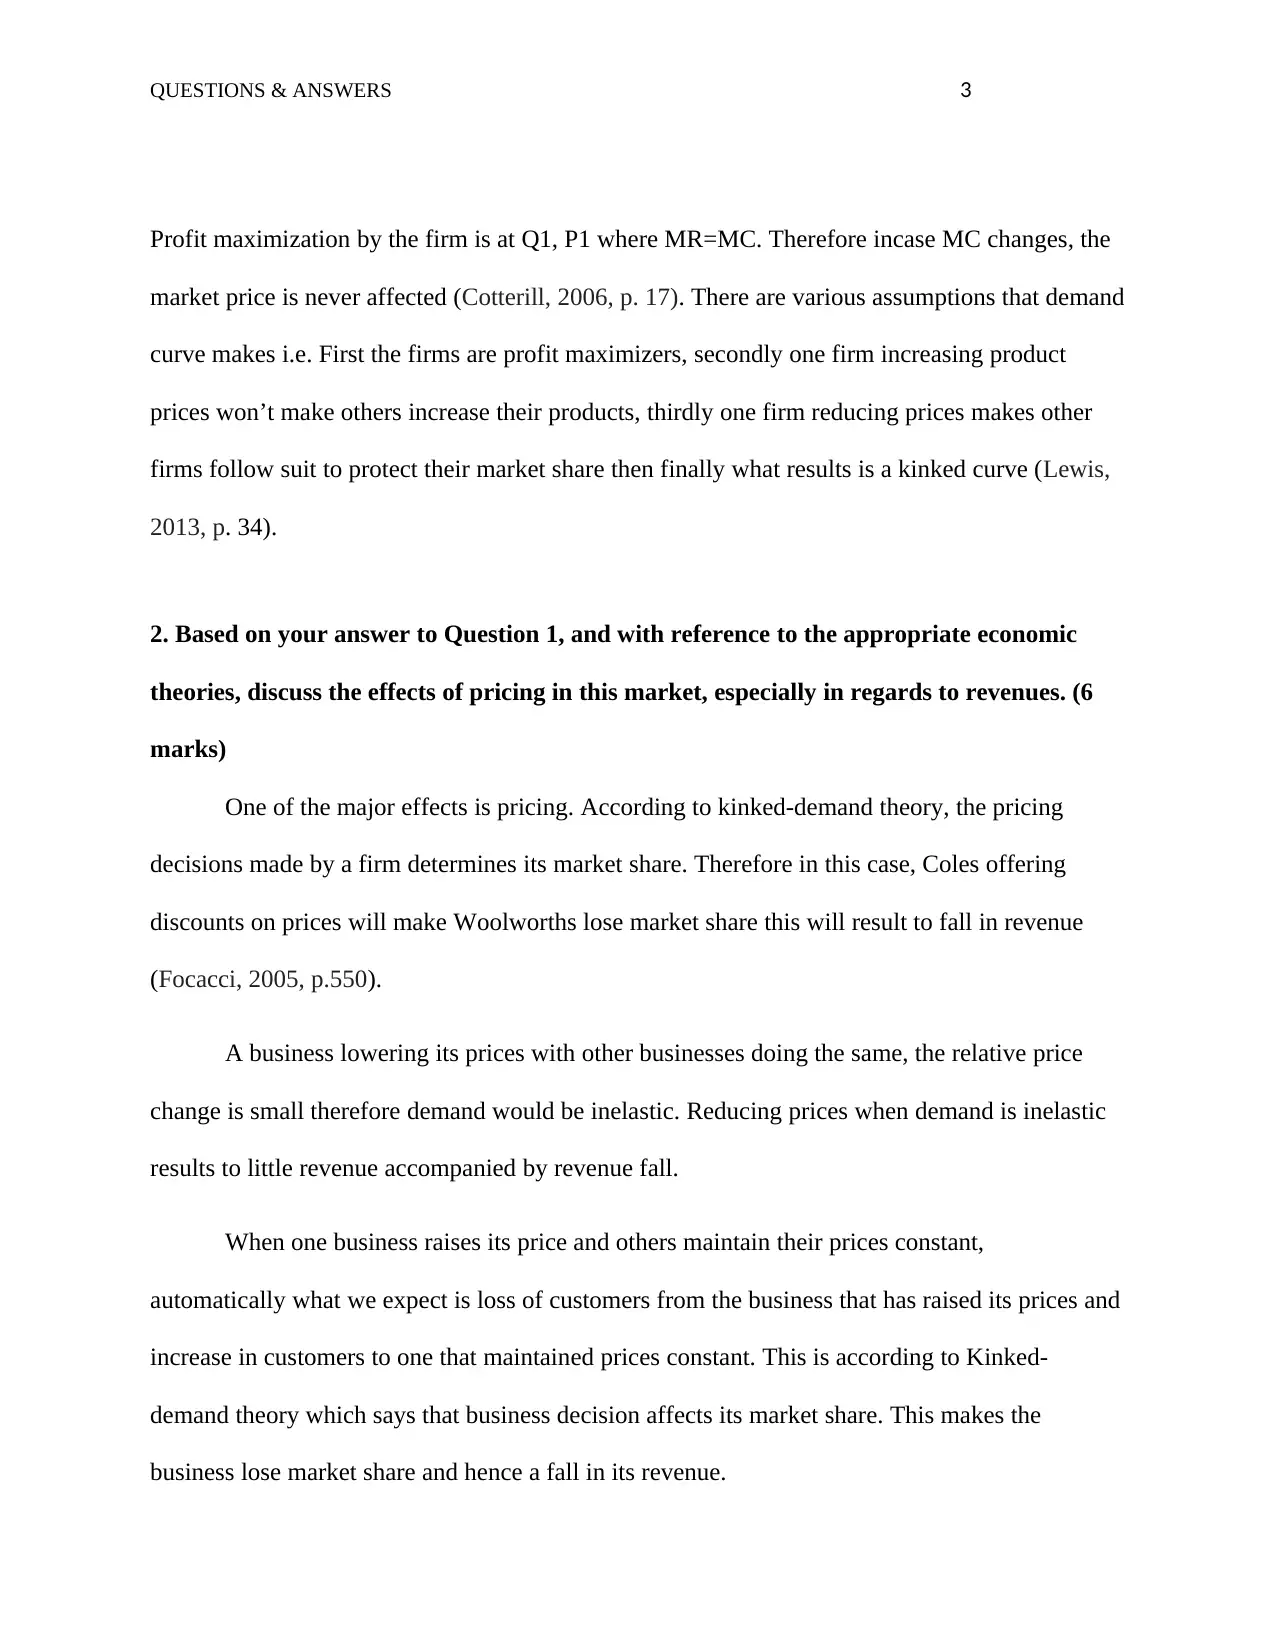
Duopoly is the market structure that Coles and Woolworths operate which is an oligopoly with
only two firms. According to kinked-demand curve theory, the market demand curve that a firm
faces is determined by the price decisions of other firms in oligopoly market. Games theory
states that decisions made by one firm are influenced and at the same time influence decisions of
other firms in the market (Jones, 2005, p.53). With reference to the two theories and looking at
the condition of the market as at now, it is evident that Woolworth’s market demand is affected
by the discount decisions made by Coles. In this structure, the two supermarkets dominate the
market. Source one says that a discount on commodity prices in Coles have great effects on
Woolworths and the entire market. Source two shows Coles having 37% of the market share
while Woolworths with 43%.
Demand elastic
£ for price increase
MC Change in MC leads
to same price P1
P1 MC 2
Demand inelastic price decrease
MR D=AR
Q1 Q
1. What type of market structure do Coles and Woolworths operate in? Justify your
answer with reference to some limited research and the appropriate economic theories.
Your answer should include a diagram. (5 marks)
Duopoly is the market structure that Coles and Woolworths operate which is an oligopoly with
only two firms. According to kinked-demand curve theory, the market demand curve that a firm
faces is determined by the price decisions of other firms in oligopoly market. Games theory
states that decisions made by one firm are influenced and at the same time influence decisions of
other firms in the market (Jones, 2005, p.53). With reference to the two theories and looking at
the condition of the market as at now, it is evident that Woolworth’s market demand is affected
by the discount decisions made by Coles. In this structure, the two supermarkets dominate the
market. Source one says that a discount on commodity prices in Coles have great effects on
Woolworths and the entire market. Source two shows Coles having 37% of the market share
while Woolworths with 43%.
Demand elastic
£ for price increase
MC Change in MC leads
to same price P1
P1 MC 2
Demand inelastic price decrease
MR D=AR
Q1 Q
QUESTIONS & ANSWERS 3
Profit maximization by the firm is at Q1, P1 where MR=MC. Therefore incase MC changes, the
market price is never affected (Cotterill, 2006, p. 17). There are various assumptions that demand
curve makes i.e. First the firms are profit maximizers, secondly one firm increasing product
prices won’t make others increase their products, thirdly one firm reducing prices makes other
firms follow suit to protect their market share then finally what results is a kinked curve (Lewis,
2013, p. 34).
2. Based on your answer to Question 1, and with reference to the appropriate economic
theories, discuss the effects of pricing in this market, especially in regards to revenues. (6
marks)
One of the major effects is pricing. According to kinked-demand theory, the pricing
decisions made by a firm determines its market share. Therefore in this case, Coles offering
discounts on prices will make Woolworths lose market share this will result to fall in revenue
(Focacci, 2005, p.550).
A business lowering its prices with other businesses doing the same, the relative price
change is small therefore demand would be inelastic. Reducing prices when demand is inelastic
results to little revenue accompanied by revenue fall.
When one business raises its price and others maintain their prices constant,
automatically what we expect is loss of customers from the business that has raised its prices and
increase in customers to one that maintained prices constant. This is according to Kinked-
demand theory which says that business decision affects its market share. This makes the
business lose market share and hence a fall in its revenue.
⊘ This is a preview!⊘
Do you want full access?
Subscribe today to unlock all pages.
Trusted by 1+ million students worldwide
QUESTIONS & ANSWERS 4
Is it in the interests of Woolworths and Coles to have a price discount war? Why or why
not?
No. Because the type of competition that exists between Coles and Woolworths is Oligopolistic.
This implies that they are not interdependent. Therefore, the war of prices and discounts in
existence is not as a result of their interests (Focacci, 2005, p.550).
3. What type of market structure is the market for vegetables provided by farmers?
Explain why with reference to Sources 2 and 3 and the appropriate economic theories. (4
marks)
Monopolistic competition is the market structure for vegetables provided by farmers. According
to theory of monopolistic competition which is the existence of imperfect competition in the
market, the monopoly market structure results from the collaboration between the Coles and
Woolworths thus pressing the farmer too hard. Putting aside high production costs by famers,
vegetable farming is going down because of poor compensation by the two supermarkets
(Alchian, 2016, p.212). The market of the other products is seen to be much lower than that of
vegetables. This is stated in source two.
Paraphrase This Document
Need a fresh take? Get an instant paraphrase of this document with our AI Paraphraser
QUESTIONS & ANSWERS 5
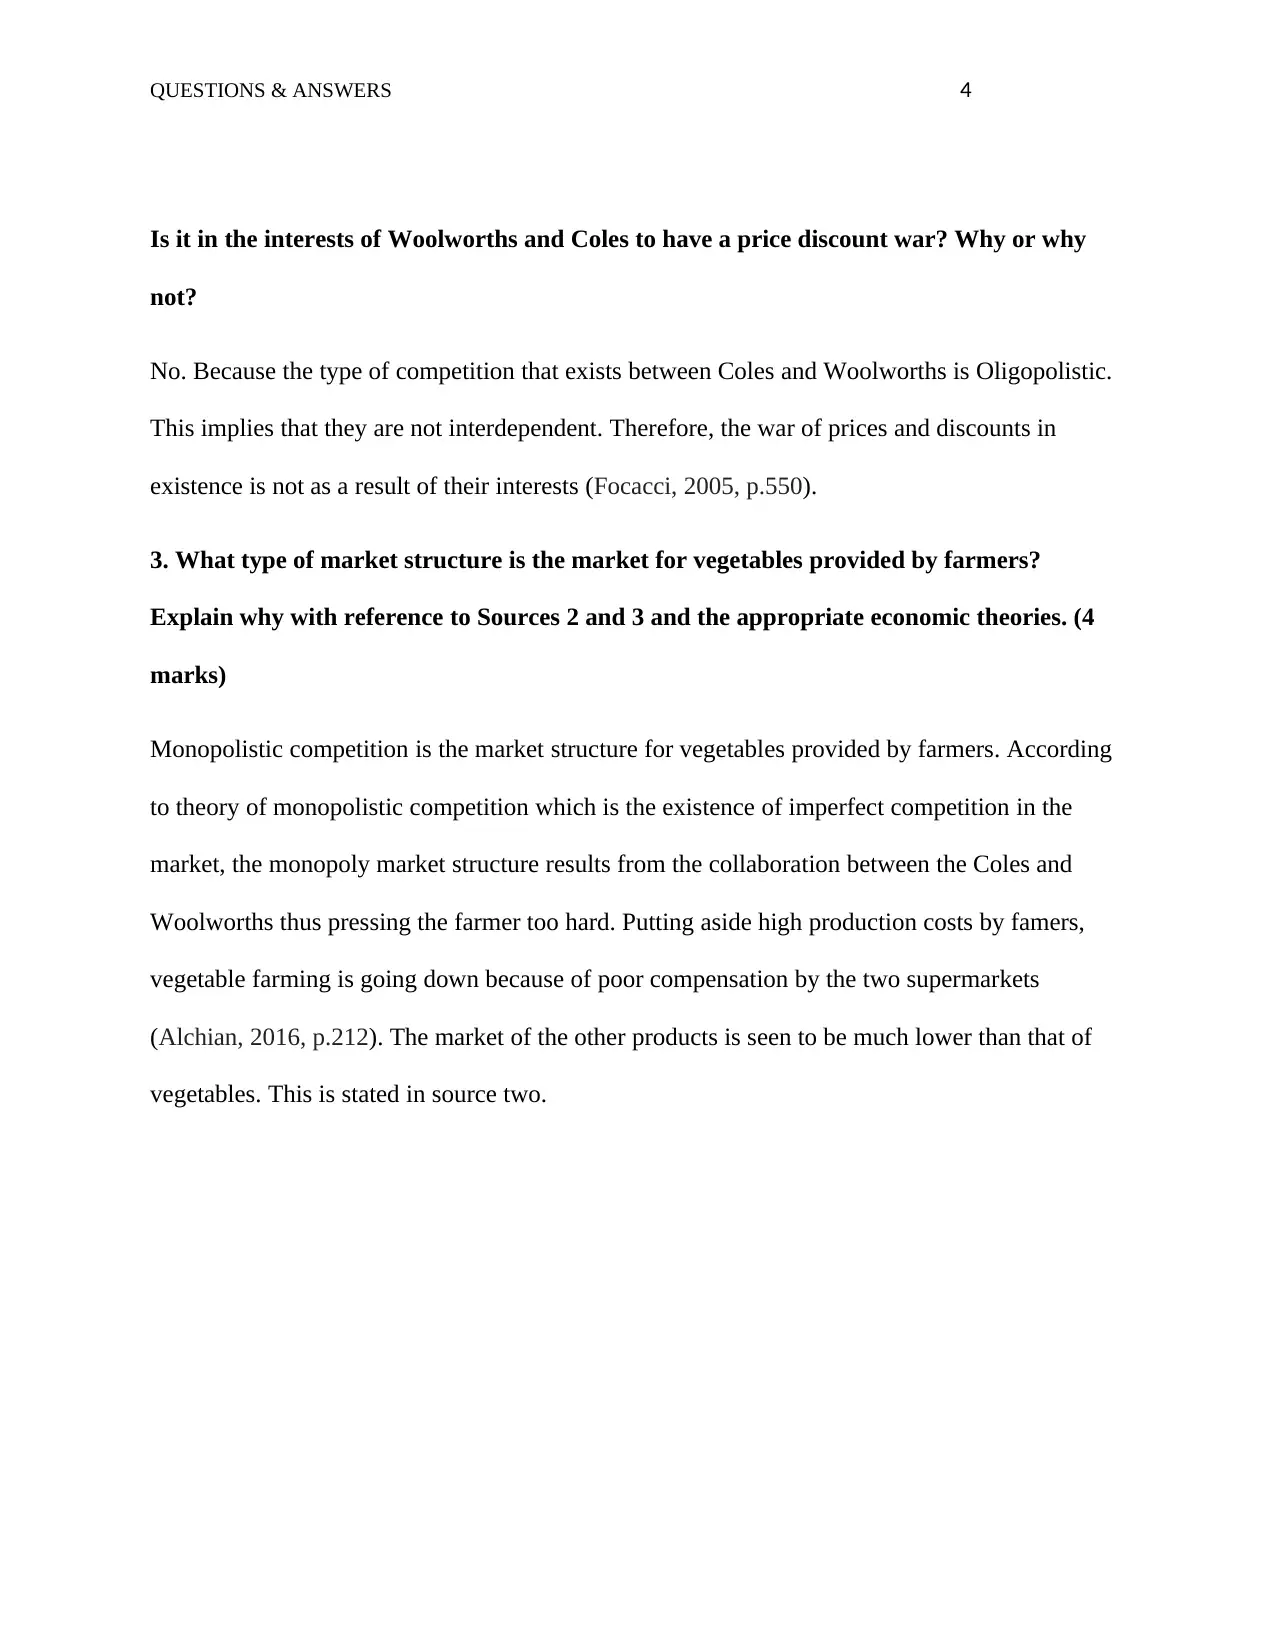
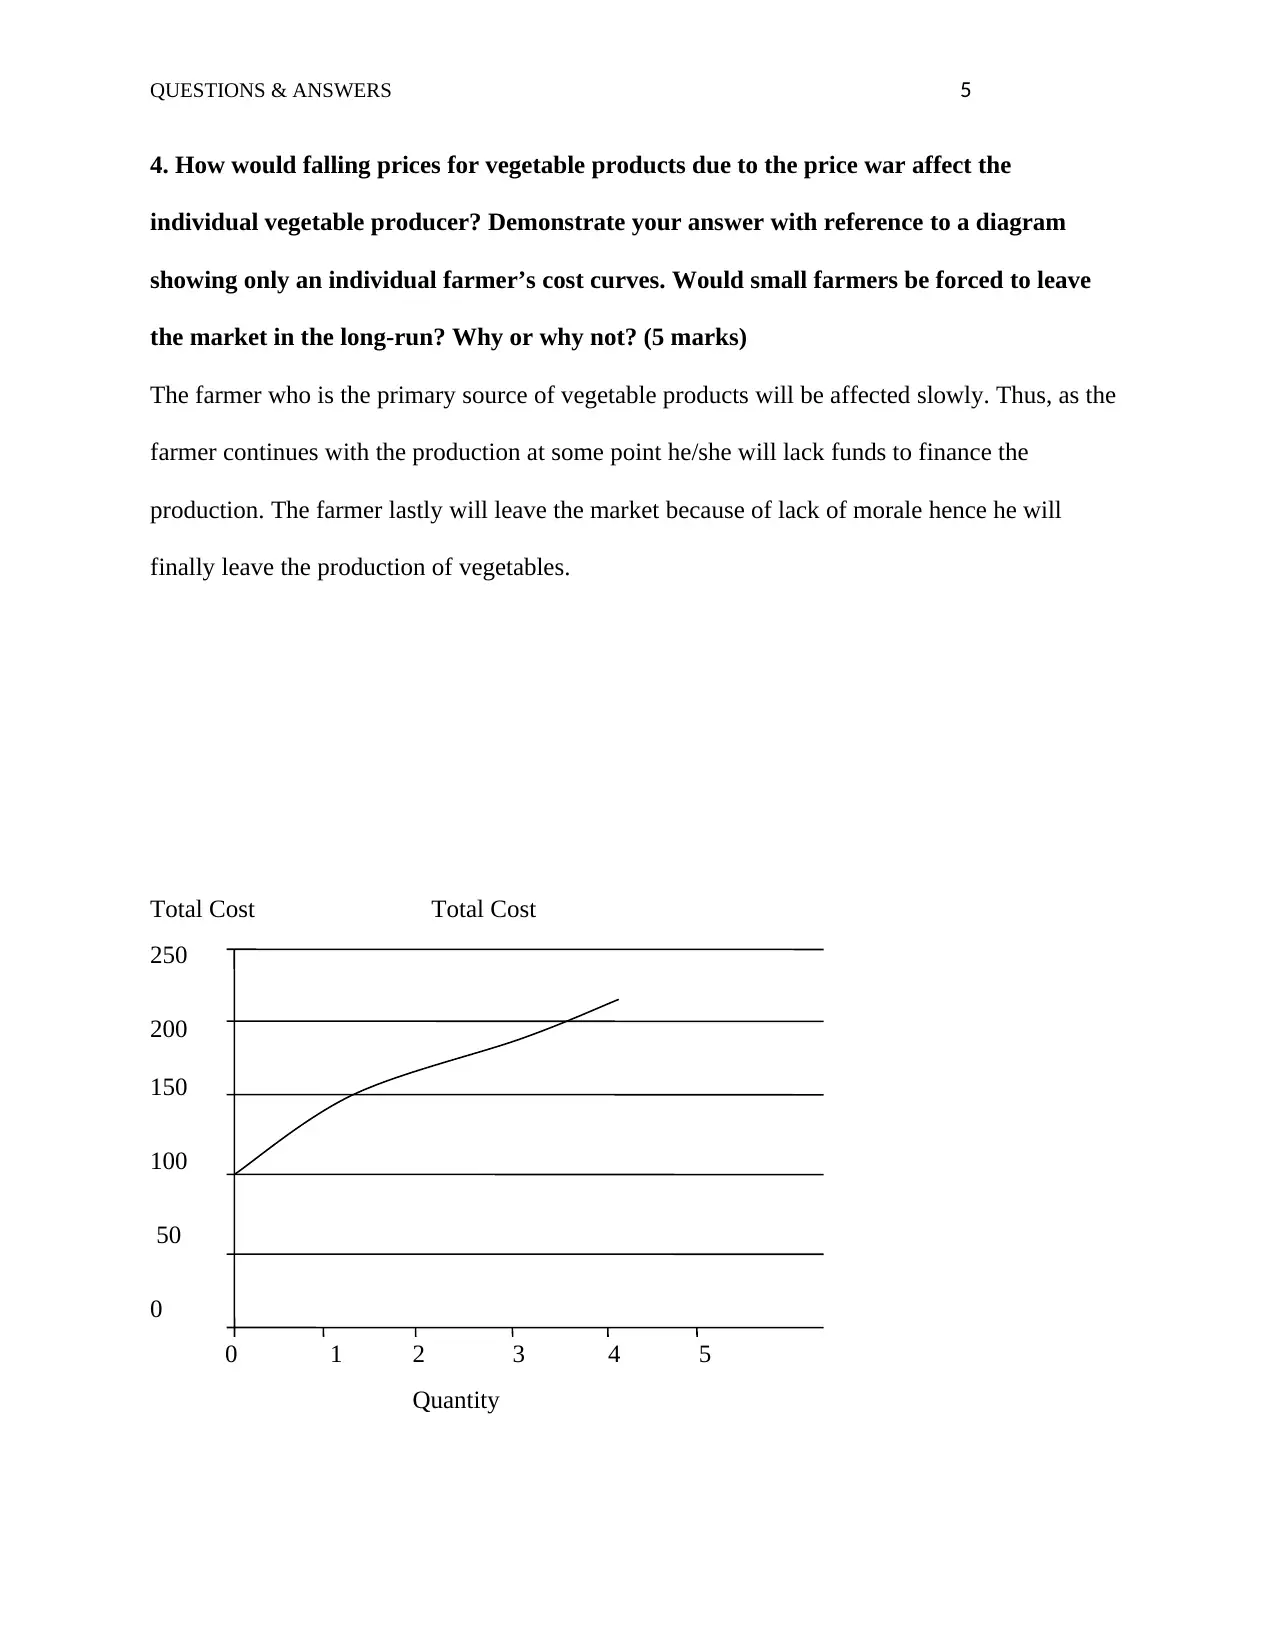
4. How would falling prices for vegetable products due to the price war affect the
individual vegetable producer? Demonstrate your answer with reference to a diagram
showing only an individual farmer’s cost curves. Would small farmers be forced to leave
the market in the long-run? Why or why not? (5 marks)
The farmer who is the primary source of vegetable products will be affected slowly. Thus, as the
farmer continues with the production at some point he/she will lack funds to finance the
production. The farmer lastly will leave the market because of lack of morale hence he will
finally leave the production of vegetables.
Total Cost Total Cost
250
200
150
100
50
0
0 1 2 3 4 5
Quantity
QUESTIONS & ANSWERS 6
1. Based on the article and graphs above, what phase of the business cycle do you believe
Spain was in during 2013? Explain why with reference to theory and represent this phase
of the business cycle using an aggregate demand and supply model. (5 marks)
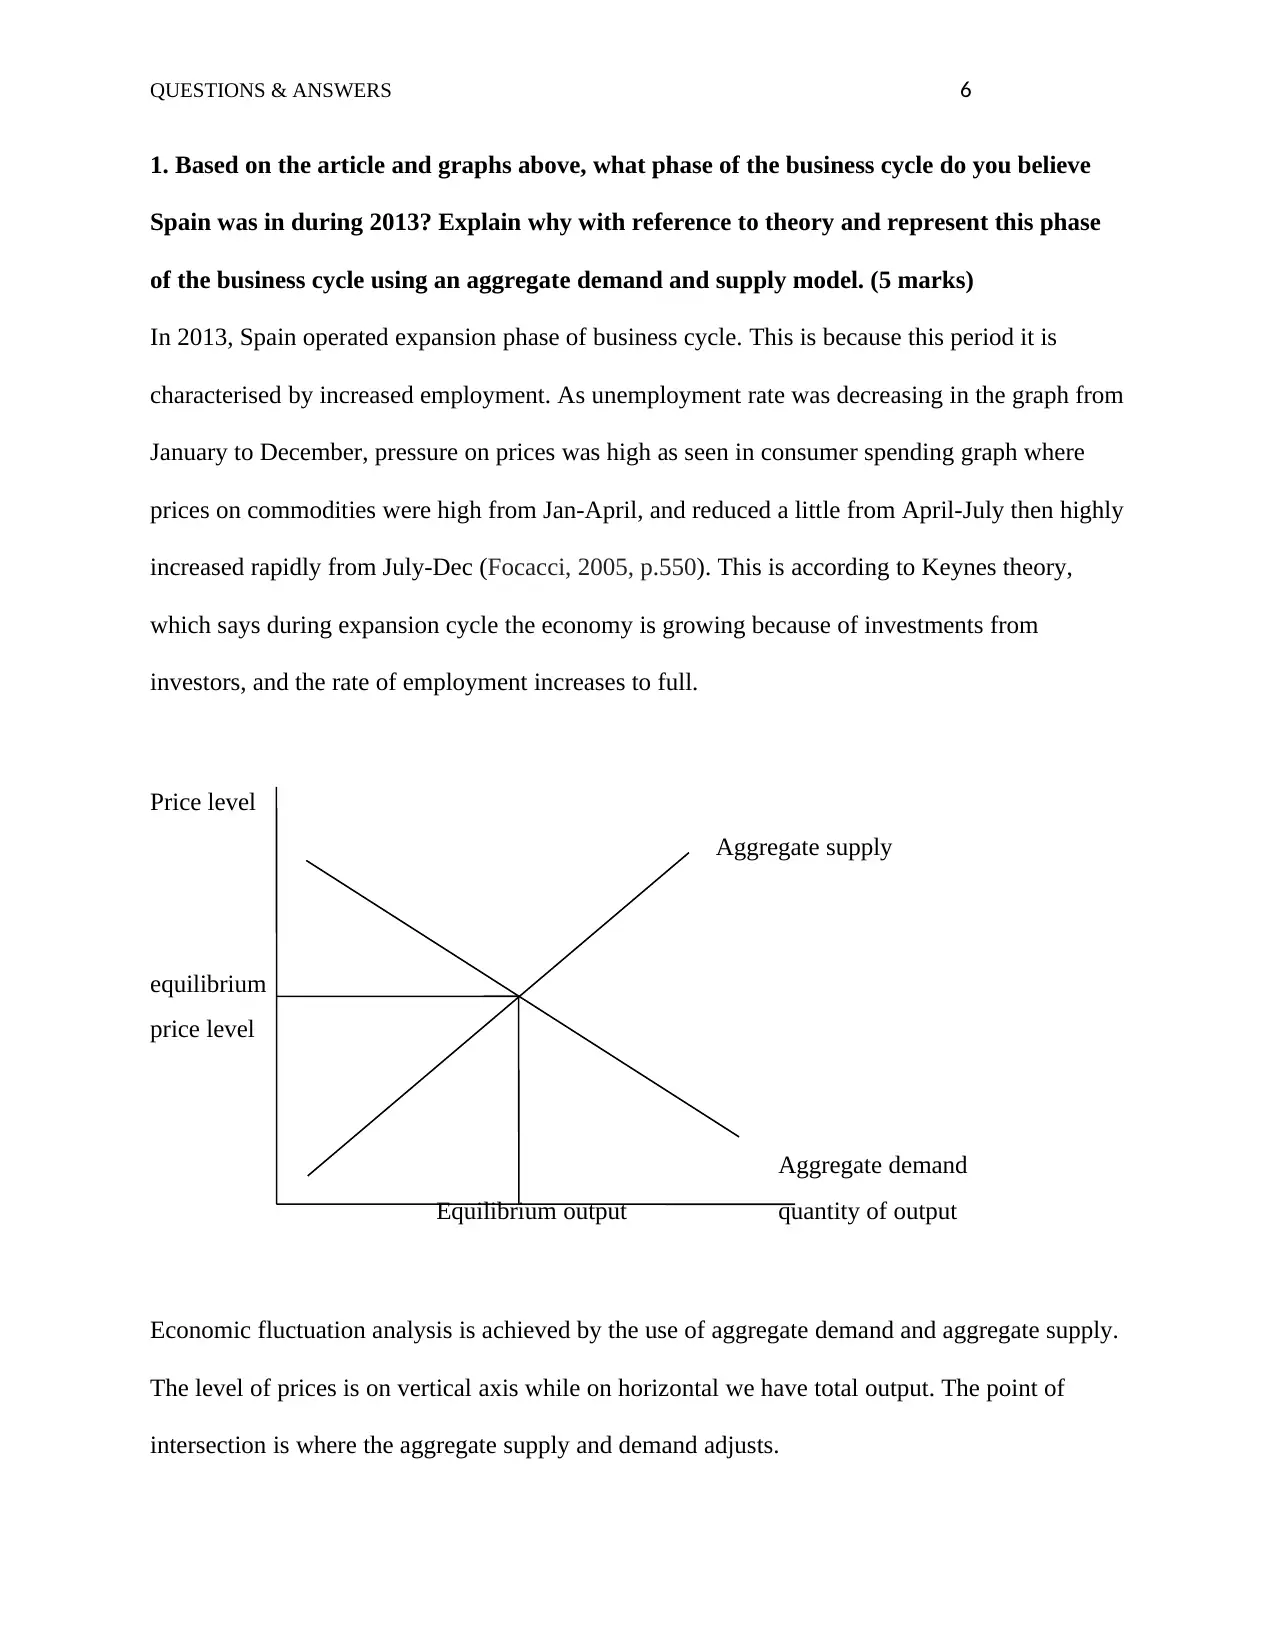
In 2013, Spain operated expansion phase of business cycle. This is because this period it is
characterised by increased employment. As unemployment rate was decreasing in the graph from
January to December, pressure on prices was high as seen in consumer spending graph where
prices on commodities were high from Jan-April, and reduced a little from April-July then highly
increased rapidly from July-Dec (Focacci, 2005, p.550). This is according to Keynes theory,
which says during expansion cycle the economy is growing because of investments from
investors, and the rate of employment increases to full.
Price level
Aggregate supply
equilibrium
price level
Aggregate demand
Equilibrium output quantity of output
Economic fluctuation analysis is achieved by the use of aggregate demand and aggregate supply.
The level of prices is on vertical axis while on horizontal we have total output. The point of
intersection is where the aggregate supply and demand adjusts.
1. Based on the article and graphs above, what phase of the business cycle do you believe
Spain was in during 2013? Explain why with reference to theory and represent this phase
of the business cycle using an aggregate demand and supply model. (5 marks)
In 2013, Spain operated expansion phase of business cycle. This is because this period it is
characterised by increased employment. As unemployment rate was decreasing in the graph from
January to December, pressure on prices was high as seen in consumer spending graph where
prices on commodities were high from Jan-April, and reduced a little from April-July then highly
increased rapidly from July-Dec (Focacci, 2005, p.550). This is according to Keynes theory,
which says during expansion cycle the economy is growing because of investments from
investors, and the rate of employment increases to full.
Price level
Aggregate supply
equilibrium
price level
Aggregate demand
Equilibrium output quantity of output
Economic fluctuation analysis is achieved by the use of aggregate demand and aggregate supply.
The level of prices is on vertical axis while on horizontal we have total output. The point of
intersection is where the aggregate supply and demand adjusts.
⊘ This is a preview!⊘
Do you want full access?
Subscribe today to unlock all pages.
Trusted by 1+ million students worldwide
QUESTIONS & ANSWERS 7
2. Based on the article and graphs above, what phase of the business cycle do you think
Spain has entered in 2014? Why? (8 marks)
In 2014, Spain entered the peak cycle. This is because during the peak cycle, the business is at
the highest point. The employment is at full as seen in the unemployment graph rate where
unemployment is very low in 2014 (Filardo, 2014, p.300). Additionally at the peak cycle
inflation is very high. This is visible in consumer spending graph where expenditure is very high
on commodities.
3. Given Spain’s most recent unemployment rate, if 17,353,000 people were currently
employed how many people would be unemployed? (7 marks)
Unemployment rate = 24.47
Currently employed people = 17, 353, 000
Thus the rate of employed people = 100 – 24.47 = 75.53
If 75.53 = 17, 353, 000
24.47 = ?
(24.47 * 17, 353, 000) / 75.53
=562197.6830
Paraphrase This Document
Need a fresh take? Get an instant paraphrase of this document with our AI Paraphraser
QUESTIONS & ANSWERS 8
=562198 people
1. Based on the article above, what phase of the business cycle is the Indian economy
experiencing in 2016? Justify your answer with reference to economics theory and support
your analysis with a graph showing where the Indian economy is operating. (8 marks)
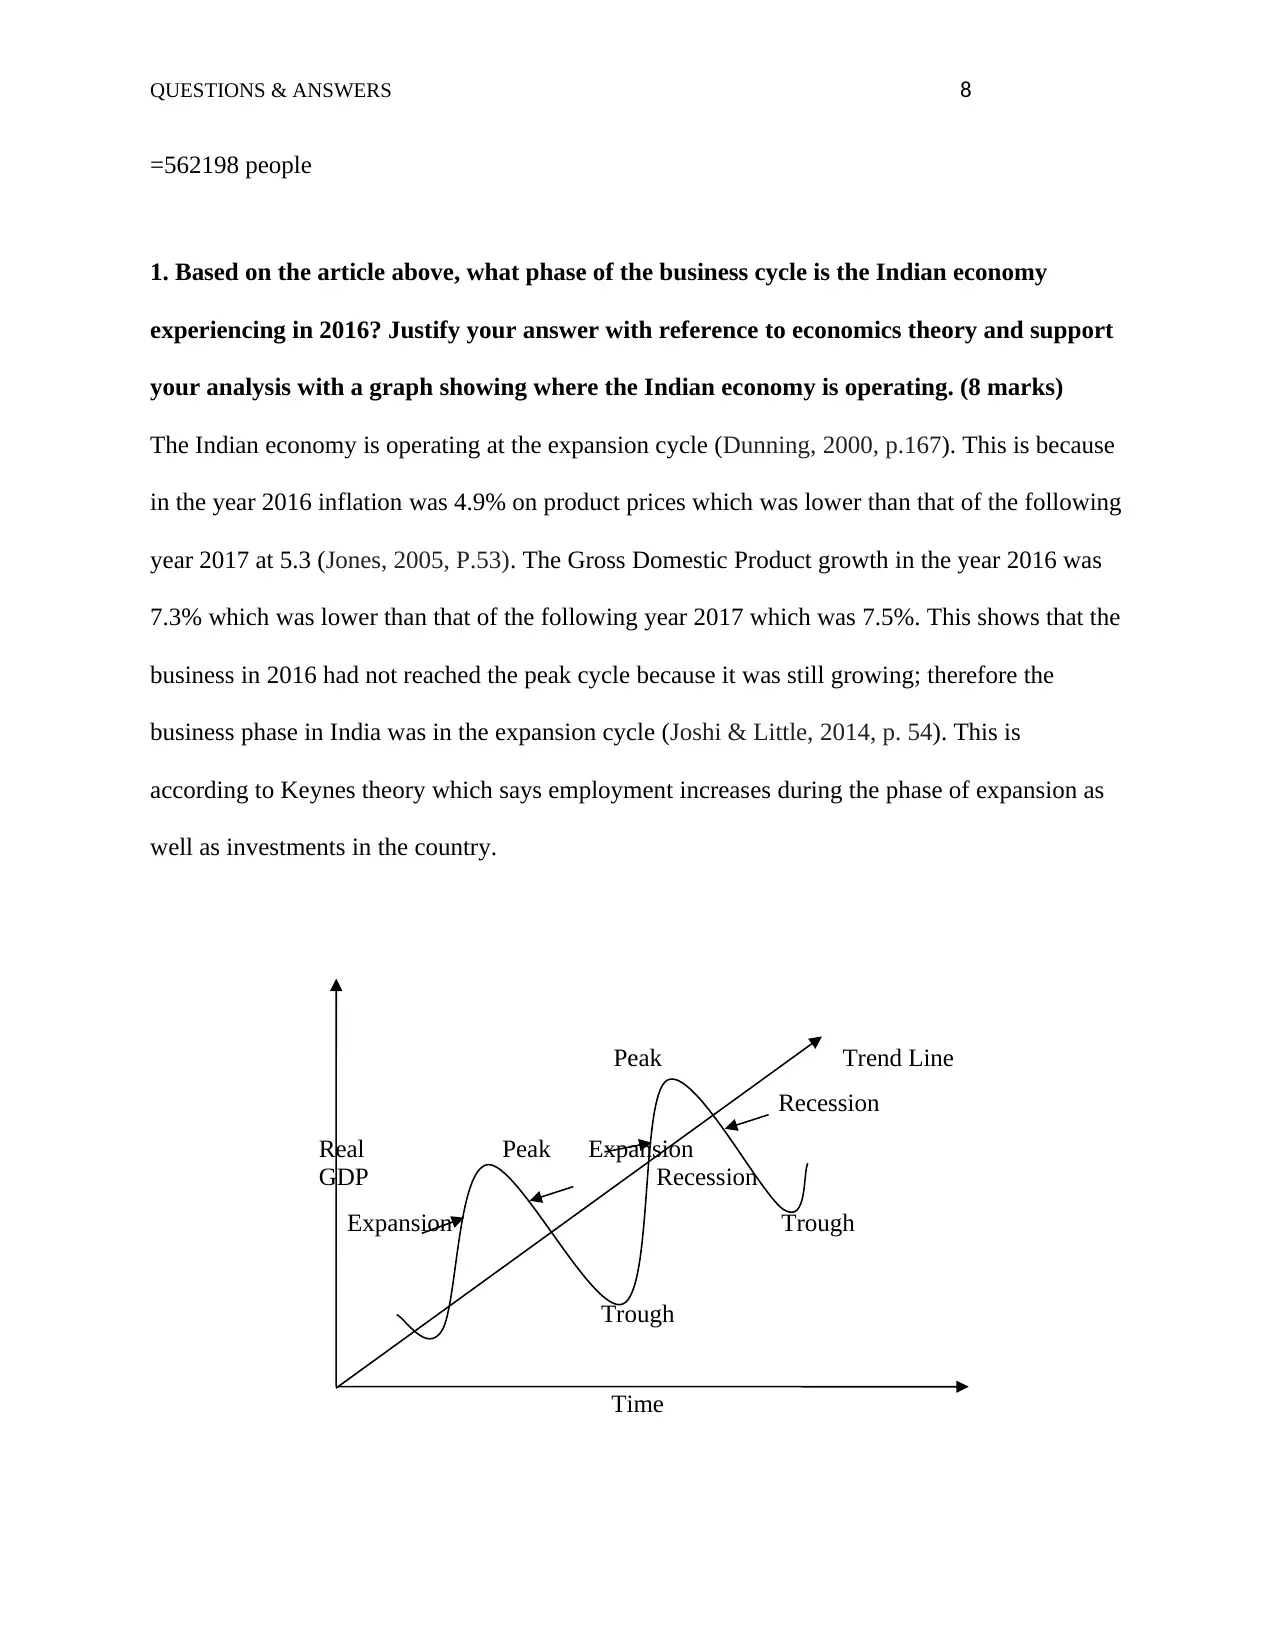
The Indian economy is operating at the expansion cycle (Dunning, 2000, p.167). This is because
in the year 2016 inflation was 4.9% on product prices which was lower than that of the following
year 2017 at 5.3 (Jones, 2005, P.53). The Gross Domestic Product growth in the year 2016 was
7.3% which was lower than that of the following year 2017 which was 7.5%. This shows that the
business in 2016 had not reached the peak cycle because it was still growing; therefore the
business phase in India was in the expansion cycle (Joshi & Little, 2014, p. 54). This is
according to Keynes theory which says employment increases during the phase of expansion as
well as investments in the country.
Peak Trend Line
Recession
Real Peak Expansion
GDP Recession
Expansion Trough
Trough
Time
=562198 people
1. Based on the article above, what phase of the business cycle is the Indian economy
experiencing in 2016? Justify your answer with reference to economics theory and support
your analysis with a graph showing where the Indian economy is operating. (8 marks)
The Indian economy is operating at the expansion cycle (Dunning, 2000, p.167). This is because
in the year 2016 inflation was 4.9% on product prices which was lower than that of the following
year 2017 at 5.3 (Jones, 2005, P.53). The Gross Domestic Product growth in the year 2016 was
7.3% which was lower than that of the following year 2017 which was 7.5%. This shows that the
business in 2016 had not reached the peak cycle because it was still growing; therefore the
business phase in India was in the expansion cycle (Joshi & Little, 2014, p. 54). This is
according to Keynes theory which says employment increases during the phase of expansion as
well as investments in the country.
Peak Trend Line
Recession
Real Peak Expansion
GDP Recession
Expansion Trough
Trough
Time
QUESTIONS & ANSWERS 9
As shown in the graph above, the Indian economy is operating at the expansion cycle. Here, the
economy is growing heading towards the peak cycle.
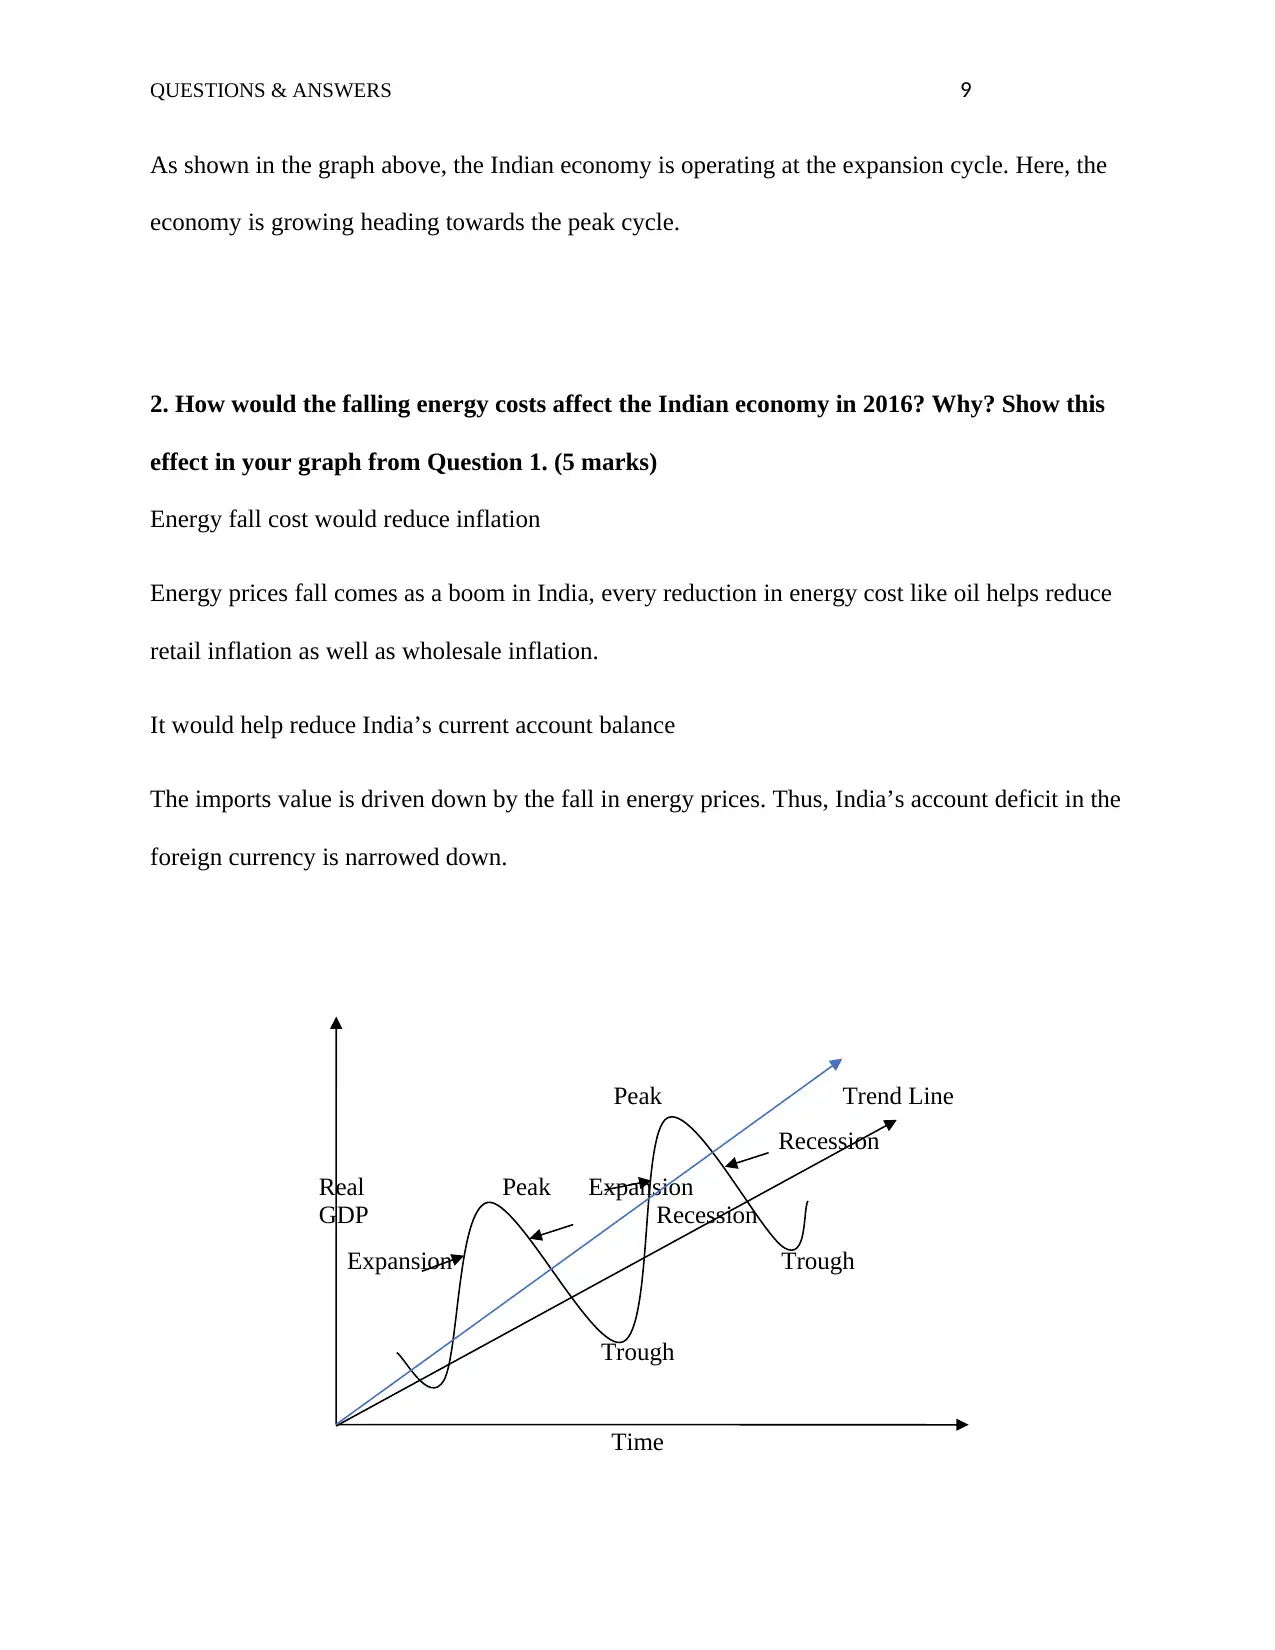
2. How would the falling energy costs affect the Indian economy in 2016? Why? Show this
effect in your graph from Question 1. (5 marks)
Energy fall cost would reduce inflation
Energy prices fall comes as a boom in India, every reduction in energy cost like oil helps reduce
retail inflation as well as wholesale inflation.
It would help reduce India’s current account balance
The imports value is driven down by the fall in energy prices. Thus, India’s account deficit in the
foreign currency is narrowed down.
Peak Trend Line
Recession
Real Peak Expansion
GDP Recession
Expansion Trough
Trough
Time
As shown in the graph above, the Indian economy is operating at the expansion cycle. Here, the
economy is growing heading towards the peak cycle.
2. How would the falling energy costs affect the Indian economy in 2016? Why? Show this
effect in your graph from Question 1. (5 marks)
Energy fall cost would reduce inflation
Energy prices fall comes as a boom in India, every reduction in energy cost like oil helps reduce
retail inflation as well as wholesale inflation.
It would help reduce India’s current account balance
The imports value is driven down by the fall in energy prices. Thus, India’s account deficit in the
foreign currency is narrowed down.
Peak Trend Line
Recession
Real Peak Expansion
GDP Recession
Expansion Trough
Trough
Time
⊘ This is a preview!⊘
Do you want full access?
Subscribe today to unlock all pages.
Trusted by 1+ million students worldwide
QUESTIONS & ANSWERS 10
Falling in energy costs will make the trend line in question one shift to the blue line as shown in
the diagram below.
3. What macroeconomic indicator should be monitored closely in India in 2016? What can
the Reserve bank of India do to control this indicator? (You may need to do some research
into Topics 10 and 11 by yourself) (7 marks)
Interest Rates Announcement,
The prices of currencies in the foreign exchange market are moved by interest rates. The
most influential actors are the central banks specifically as institutions set their interest rates.
Investments are controlled by interest rates (Pal & Mittal, 2011, p.87). In this case the Reserve
Bank of India changing interest rates will lead to forex market suffering volatility and
movement. Thus the accurate speculation of Reserve bank of India can enhance the trader’s
chances of as successful trade.
Government Fiscal and Monetary Policy
Economy stability is among the major goals that the government needs to achieve by
manipulating fiscal and monetary policies. Reserve bank of India should check the Fiscal and
monetary policy in order to stabilize economy.
Gross Domestic Product (GDP)
The country’s economy is measured using GDP. The GDP is a representation of value all
goods produced annually in a country. The GDP is one of the indicators that the Reserve bank of
India can control. In this scenario, Reserve bank of India can control interest rates imposed on
loans to control GDP.
Paraphrase This Document
Need a fresh take? Get an instant paraphrase of this document with our AI Paraphraser
QUESTIONS & ANSWERS 11
Consumer Price Index
The other indicator of inflation is the Consumer Price Index. This is representation of
product prices of the basic consumer. Inflation has greater effects to countries currency
purchasing power and also its international market standing. In this case, Reserve bank of India
can control the interest rates in order to create an attractive currency in the country.
Employment Indicators
The economy and health of a country is also reflected by the employment indicators. The
knowledge of the jobs in existence and knowing the number of people working and how many
people are claiming unemployment helps understand the economy (Focacci, 2005, p.550).
Reserve bank of India should understand the unemployment rate to determine the level of
inflation in the country..
Retail Sales
The strength of a consumer expenditure as well as retail store success is important to
those who do foreign exchange trade since it shows their strength. In every month, the retail sales
indicator is released. This report shows the partial consumer spending patterns that adjust with
varying in seasons (Pal and Mittal, 2011, p.84). The performance of some of lagging indicators
can be predicted using retail sales. In addition to that, the immediate economy direction can also
be assessed using retail sales.
Balance of Payments
The ratio between the payment going abroad and the payments coming from abroad is
what is defined as the balance of payments. This includes the operations in foreign trade, the
QUESTIONS & ANSWERS 12
import & export balance, payment transfer, trade balance (Keith, 2012, p.50). The balance of
payment is considered positive when the payment into the country exceeds the payment the
country makes to other countries and other international organizations. Here the Reserve bank of
India can control what the country imports and allow more exports to increase payments into the
country.
References
Alchian, A.A., 2016. Uncertainty, evolution, and economic theory. Journal of political
economy, 58(3), pp.211-221.
Cotterill, R.W., 2006. Antitrust analysis of supermarkets: global concerns playing out in local
markets. Australian Journal of Agricultural and Resource Economics, 50(1), pp.17-32.
Dunning, J.H., 2000. The eclectic paradigm as an envelope for economic and business theories
of MNE activity. International business review, 9(2), pp.163-190.
Filardo, A.J., 2014. Business-cycle phases and their transitional dynamics. Journal of Business &
Economic Statistics, 12(3), pp.299-308.
Focacci, A., 2005. Empirical analysis of the environmental and energy policies in some
developing countries using widely employed macroeconomic indicators: the cases of
Brazil, China and India. Energy Policy, 33(4), pp.543-554.
Joshi, V. and Little, I.M.D., 2014. India: Macroeconomics and political economy, 1964-1991.
The World Bank.
⊘ This is a preview!⊘
Do you want full access?
Subscribe today to unlock all pages.
Trusted by 1+ million students worldwide
1 out of 13
Related Documents


Your All-in-One AI-Powered Toolkit for Academic Success.
+13062052269
info@desklib.com
Available 24*7 on WhatsApp / Email
![[object Object]](/_next/static/media/star-bottom.7253800d.svg)
Unlock your academic potential
Copyright © 2020–2026 A2Z Services. All Rights Reserved. Developed and managed by ZUCOL.