University Economics Assignment: Micro and Macro Economics
VerifiedAdded on 2020/05/16
|15
|2109
|185
Homework Assignment
AI Summary
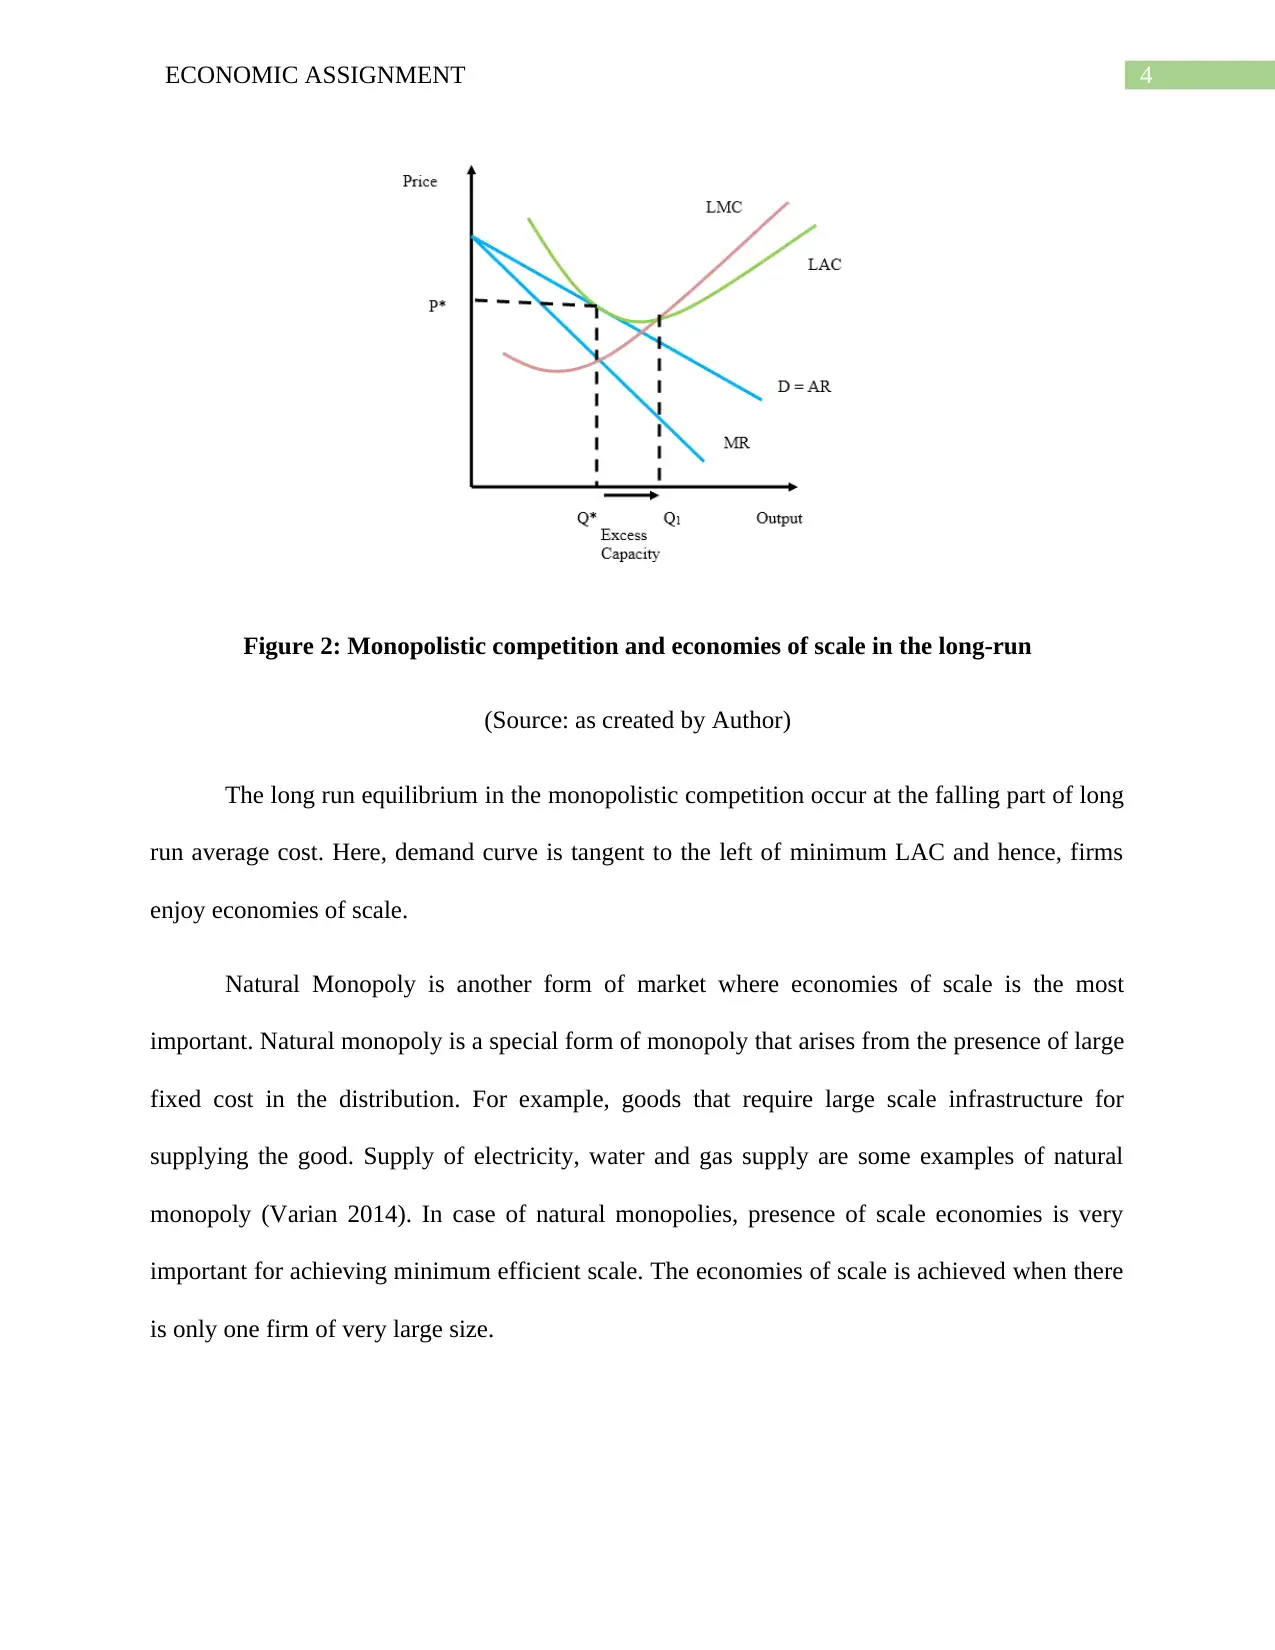
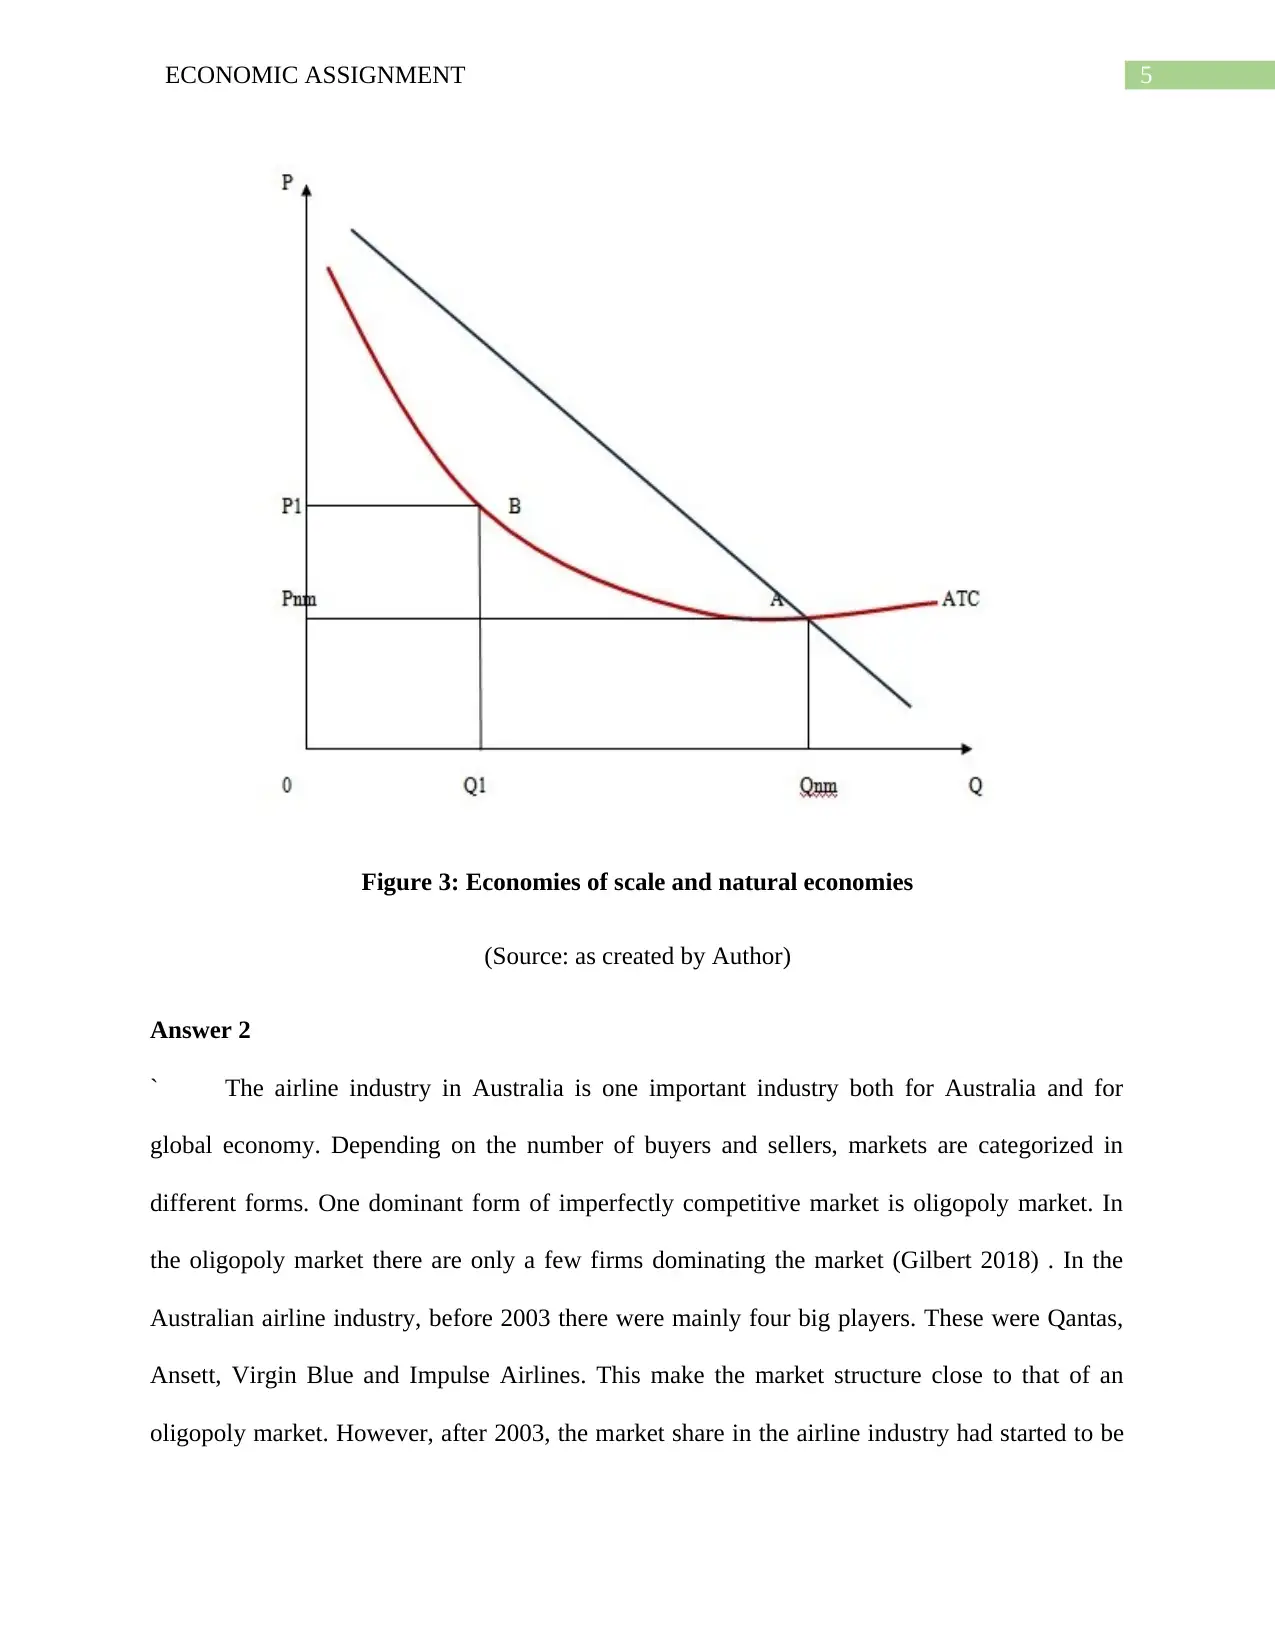
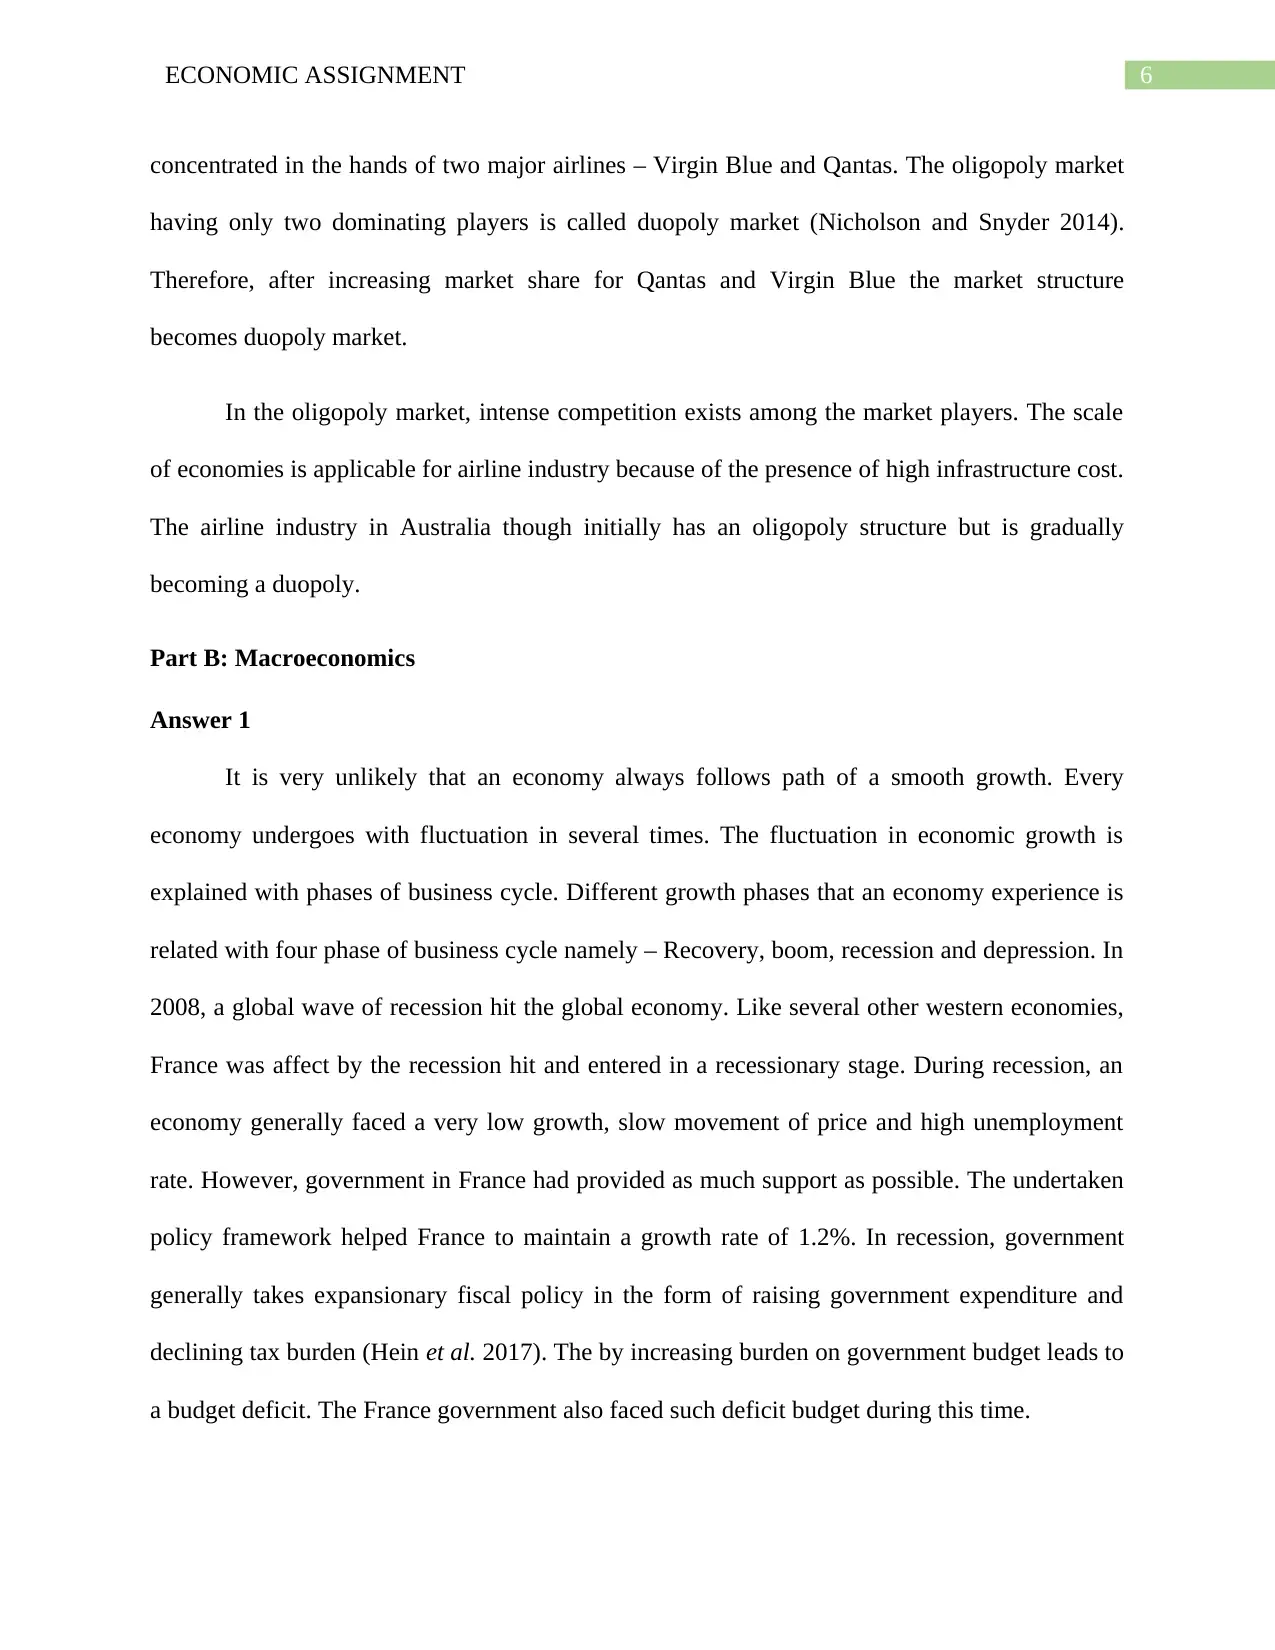
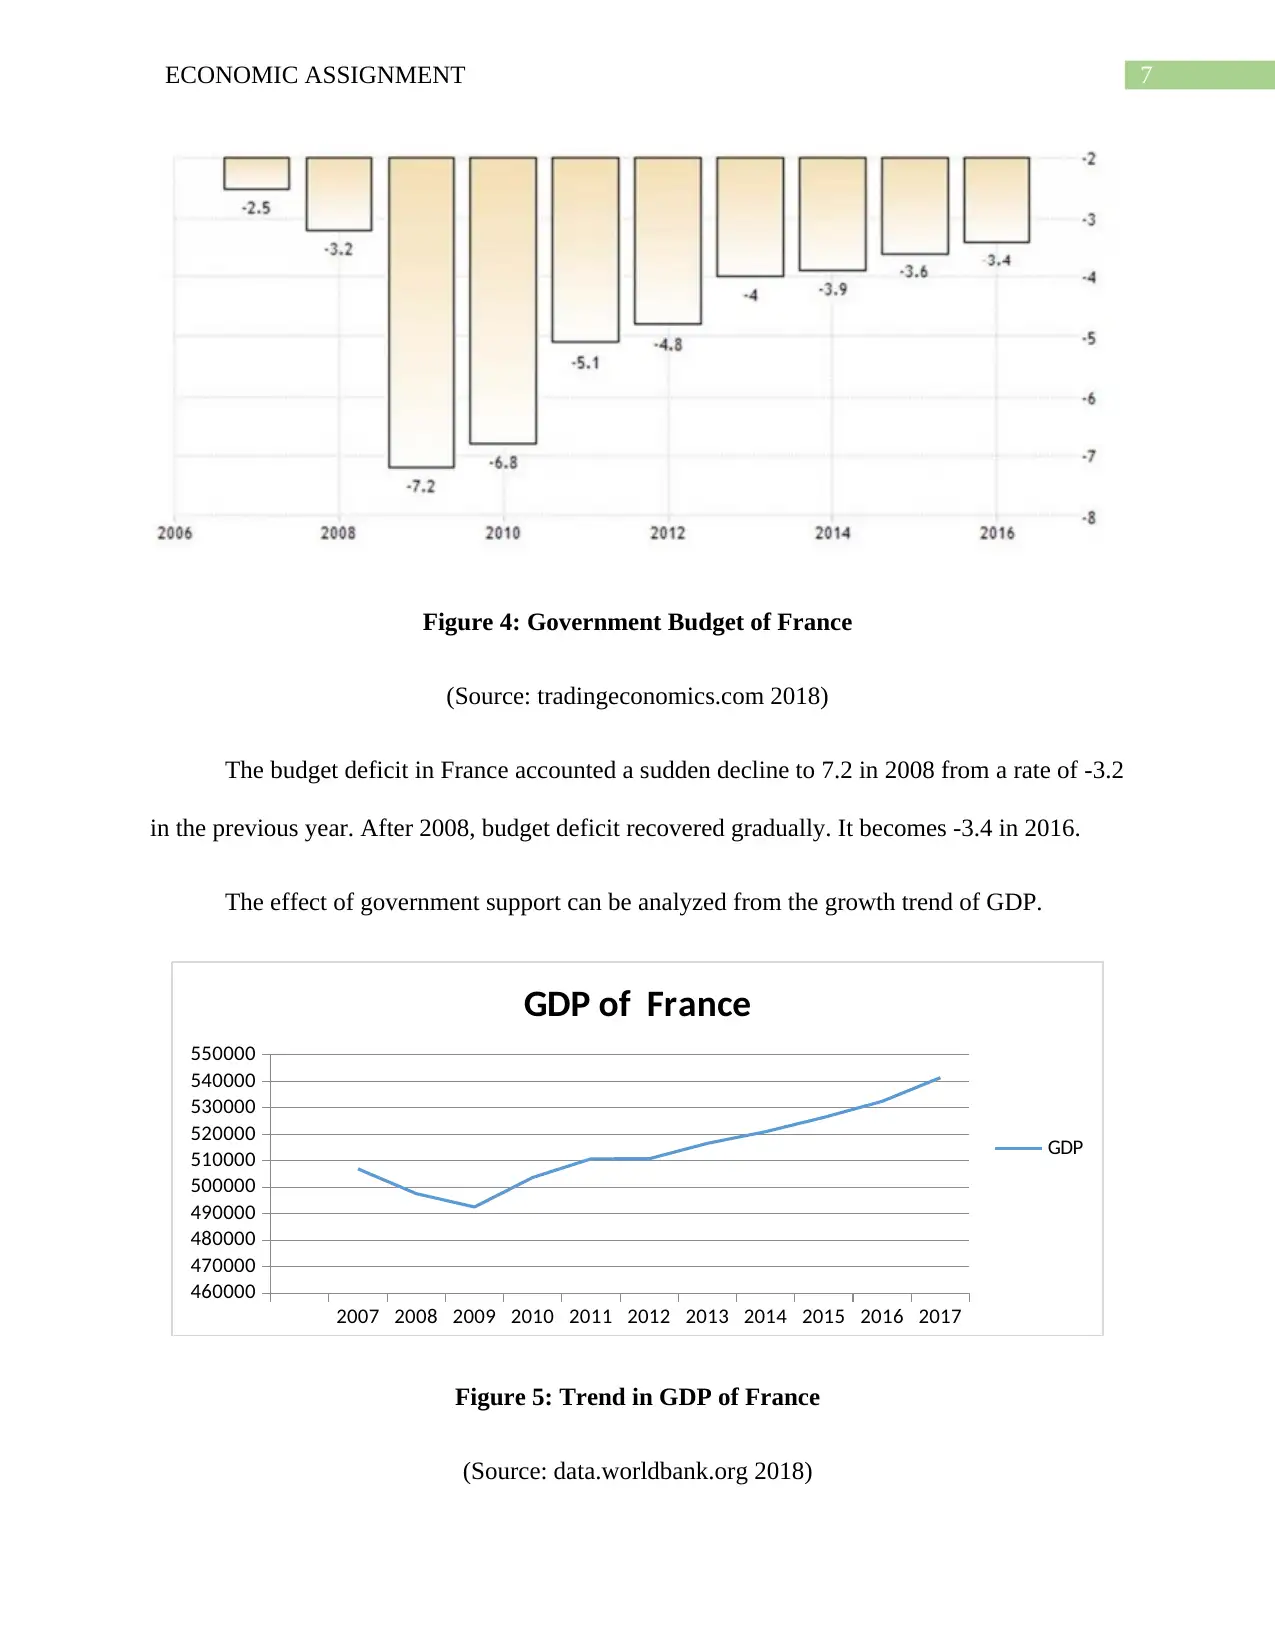
This economics assignment delves into both microeconomic and macroeconomic principles, providing a comprehensive analysis of economic concepts. Part A focuses on microeconomics, exploring economies of scale and market structures like monopolistic competition and natural monopolies. It examines internal and external economies of scale, illustrating their impact on firm efficiency and market dynamics. Part B shifts to macroeconomics, analyzing the business cycle, specifically the French economy's recession in 2008 and its subsequent recovery. The assignment uses aggregate demand and aggregate supply models to explain economic scenarios and government policies, including fiscal measures and investments in education. It evaluates economic indicators such as GDP growth, inflation, and unemployment, offering insights into the economy's performance and potential growth strategies. The analysis includes graphical representations and real-world examples, providing a thorough understanding of economic principles and their practical applications.

Running Head: ECONOMIC ASSIGNMENT
Economic Assignment
Name of the Student
Name of the University
Author note
Economic Assignment
Name of the Student
Name of the University
Author note
Paraphrase This Document
Need a fresh take? Get an instant paraphrase of this document with our AI Paraphraser

1ECONOMIC ASSIGNMENT
Table of Contents
Part A: Microeconomics..................................................................................................................2
Answer 1......................................................................................................................................2
Answer 2......................................................................................................................................5
Part B: Macroeconomics..............................................................................................................6
Answer 1......................................................................................................................................6
Answer 2......................................................................................................................................8
Answer 3....................................................................................................................................10
Answer 4....................................................................................................................................11

2ECONOMIC ASSIGNMENT
Part A: Microeconomics
Answer 1
Economies of Scale
The efficiency of a firm is determined from its size. The large firms expand from gain in
economies of scale. The benefits of scale is defined in terms of its relative cost advantage. A firm
is said to experience economies of scale when expanding production operation leads to a
continuous reduction in average production cost. This means a larger firm will attain a range of
lower production cost as compared to other small competitors. This increases the risk of takeover
for small competitors. There are both internal and external economies of scale. The internal
economies of scale is related with expansion of the single firm. Different types of internal
economy of scale involved technical economies, purchasing economies, administrative savings
and financial savings (Fine 2016). External economies of scale on the other hand arises from
external factors. Firms often enjoy a positive externality because of development of several
industries or the economy as a whole. The average cost curve for most of the firms in the long
run is U shaped reflecting presence of external economies and diseconomies of scale.
⊘ This is a preview!⊘
Do you want full access?
Subscribe today to unlock all pages.

Trusted by 1+ million students worldwide

3ECONOMIC ASSIGNMENT
Figure 1: Long run Average Cost
(Source: as created by Author)
The falling part of long run average cost curve indicates economies of scale. To the left
of minimum point of LAC, M economies of scale is present (Baumol and Blinder 2015).
In economy, different forms of market exists depending on the presence of buyers and
sellers, the nature of goods, extent of market power, barriers to entry and exists and others. The
popularly known forms of market are competitive, monopoly, monopolistic competition and
oligopoly. Economies of scales are more relevant for markets like monopolistic competition and
monopoly (Rader 2014).
Paraphrase This Document
Need a fresh take? Get an instant paraphrase of this document with our AI Paraphraser

4ECONOMIC ASSIGNMENT
Figure 2: Monopolistic competition and economies of scale in the long-run
(Source: as created by Author)
The long run equilibrium in the monopolistic competition occur at the falling part of long
run average cost. Here, demand curve is tangent to the left of minimum LAC and hence, firms
enjoy economies of scale.
Natural Monopoly is another form of market where economies of scale is the most
important. Natural monopoly is a special form of monopoly that arises from the presence of large
fixed cost in the distribution. For example, goods that require large scale infrastructure for
supplying the good. Supply of electricity, water and gas supply are some examples of natural
monopoly (Varian 2014). In case of natural monopolies, presence of scale economies is very
important for achieving minimum efficient scale. The economies of scale is achieved when there
is only one firm of very large size.

5ECONOMIC ASSIGNMENT
Figure 3: Economies of scale and natural economies
(Source: as created by Author)
Answer 2
` The airline industry in Australia is one important industry both for Australia and for
global economy. Depending on the number of buyers and sellers, markets are categorized in
different forms. One dominant form of imperfectly competitive market is oligopoly market. In
the oligopoly market there are only a few firms dominating the market (Gilbert 2018) . In the
Australian airline industry, before 2003 there were mainly four big players. These were Qantas,
Ansett, Virgin Blue and Impulse Airlines. This make the market structure close to that of an
oligopoly market. However, after 2003, the market share in the airline industry had started to be
⊘ This is a preview!⊘
Do you want full access?
Subscribe today to unlock all pages.

Trusted by 1+ million students worldwide

6ECONOMIC ASSIGNMENT
concentrated in the hands of two major airlines – Virgin Blue and Qantas. The oligopoly market
having only two dominating players is called duopoly market (Nicholson and Snyder 2014).
Therefore, after increasing market share for Qantas and Virgin Blue the market structure
becomes duopoly market.
In the oligopoly market, intense competition exists among the market players. The scale
of economies is applicable for airline industry because of the presence of high infrastructure cost.
The airline industry in Australia though initially has an oligopoly structure but is gradually
becoming a duopoly.
Part B: Macroeconomics
Answer 1
It is very unlikely that an economy always follows path of a smooth growth. Every
economy undergoes with fluctuation in several times. The fluctuation in economic growth is
explained with phases of business cycle. Different growth phases that an economy experience is
related with four phase of business cycle namely – Recovery, boom, recession and depression. In
2008, a global wave of recession hit the global economy. Like several other western economies,
France was affect by the recession hit and entered in a recessionary stage. During recession, an
economy generally faced a very low growth, slow movement of price and high unemployment
rate. However, government in France had provided as much support as possible. The undertaken
policy framework helped France to maintain a growth rate of 1.2%. In recession, government
generally takes expansionary fiscal policy in the form of raising government expenditure and
declining tax burden (Hein et al. 2017). The by increasing burden on government budget leads to
a budget deficit. The France government also faced such deficit budget during this time.
Paraphrase This Document
Need a fresh take? Get an instant paraphrase of this document with our AI Paraphraser

7ECONOMIC ASSIGNMENT
Figure 4: Government Budget of France
(Source: tradingeconomics.com 2018)
The budget deficit in France accounted a sudden decline to 7.2 in 2008 from a rate of -3.2
in the previous year. After 2008, budget deficit recovered gradually. It becomes -3.4 in 2016.
The effect of government support can be analyzed from the growth trend of GDP.
2007 2008 2009 2010 2011 2012 2013 2014 2015 2016 2017
460000
470000
480000
490000
500000
510000
520000
530000
540000
550000
GDP of France
GDP
Figure 5: Trend in GDP of France
(Source: data.worldbank.org 2018)

8ECONOMIC ASSIGNMENT
From 2008, the GDP growth of France constitutes a steady upward trend. After facing
severe recession, the gradual recovery of economic growth indicates the France economy has
entered to a phase of business cycle recovery. The movement of prices has slowed down with a
fall in the inflation rate to 0.8% from 1.2% in the previous year. With this, the growth rate has
declined by 0.1 percentage point. Another indicator of economic performance is the prevailing
unemployment rate (Bec, Bouabdallah and Ferrara 2015). Unemployment in the economy has
declined slightly and reached to 9.8%. The rate though is significantly high but indicates a better
state as compared to earlier rate of 10%. The performance indicators of Franc economy assert
that the economy is gradually making recovery and make a step towards expansionary stage.
Answer 2
The macroeconomic scenario of an economy can be presented using tools of aggregate
demand and aggregate supply. The aggregate demand represents goods and services demanded
in an economy at a certain point of time. Aggregate supply on the other hand presents goods and
services actually produced and supplied in the economy. AD and AS curve together determines
macroeconomic equilibrium indicting the level of national income and prices. The economic
scenario differs in the short run from that in the long run. The aggregate demand curve slopes
downward both in the short run and in the long run (Bernanke, Antonovics and Frank 2015). So
far as aggregate supply is concerned, it slopes upward in the short run and is a vertical straight
line corresponding to potential GDP in the long run.
⊘ This is a preview!⊘
Do you want full access?
Subscribe today to unlock all pages.

Trusted by 1+ million students worldwide

9ECONOMIC ASSIGNMENT
Figure 6: AD-AS framework for economy of France
(Source: as created by the Author)
The gradual recovery of the France economy can be seen from the shift of the
equilibrium points from E0 to E1 to E2. SRAS and LRAS represent the short run and long run
supply curve respectively. A decline in the cost of production leads to an increase in productive
activity, which in turn cause the aggregate supply curve to shift outward. As the short run
supply curve shifts from SRAS0 to SRAS1 and finally to SRAS2. Along with this, long run
supply curve also shifts raising income and pushing down price.
Paraphrase This Document
Need a fresh take? Get an instant paraphrase of this document with our AI Paraphraser

10ECONOMIC ASSIGNMENT
Figure 7: France economy in 2017
(Source: as created by Author)
Recently, the economy needs a stimulus to aggregate demand. With a lack of aggregate
demand, the aggregate demand curve shifts leftward from AD to AD1. Consequently, there is a
decline in both income and price level. This is revealed from the current data on France
economy.
Answer 3
The main indicator of economic performance are growth of GDP, inflation and
unemployment. Currently France follows a rigid labor law. By increasing availability of
unemployment benefit, making hiring, and firing easy government intends to increase labor
supply in the economy. However, what France currently need is to undertake expansionary
policy to increase aggregate demand (Agénor and Montiel 2015). Rise of aggregate demand will

11ECONOMIC ASSIGNMENT
create more jobs in the economy. This in turn will help to create more demand contributing to
productivity and growth of the economy.
Answer 4
Education is a significant contributor of workers’ productivity. An educated and skilled
workforce increase the supply of human capital in the economy. Once the economy rich in
human capital it can produce better quality goods and services with less time. Therefore, the
decision of Macron for investing in education will increases country’s productivity and brings
economic growth. This can be explained as follows.
Figure 8: Benefit of education
(Source: as created by Author)
The benefit of education is explained using the framework of aggregate demand and
aggregate supply. The investment in education will enhance development of skill. The labor
market when enriched with skilled labor force then raise both short run and long run supply in
⊘ This is a preview!⊘
Do you want full access?
Subscribe today to unlock all pages.

Trusted by 1+ million students worldwide
1 out of 15
Related Documents

Your All-in-One AI-Powered Toolkit for Academic Success.
+13062052269
info@desklib.com
Available 24*7 on WhatsApp / Email
Unlock your academic potential
Copyright © 2020–2025 A2Z Services. All Rights Reserved. Developed and managed by ZUCOL.