University Economics Report: Micro and Macro Analysis
VerifiedAdded on 2022/10/10
|22
|3918
|315
Report
AI Summary
This report provides a comprehensive analysis of microeconomic and macroeconomic concepts. Part A delves into microeconomic principles, examining the impact of changes in demand and supply on the market price of wheat flour, comparing returns to scale and diminishing marginal returns, and exploring the behavior of firms in perfect competition. The report also differentiates between income and price elasticity of demand and explains cross-price elasticity. Part B focuses on macroeconomic topics, including the business cycle, its four stages, and types of unemployment. It explains the money market, GDP measurement, recession, and expansionary fiscal policy. Finally, the report differentiates between demand-pull and cost-push inflation, their causes, and their interaction. This detailed analysis offers a clear understanding of the key concepts in both microeconomics and macroeconomics.
Running head: MICROECONOMICS AND MACROECONOMICS
MICROECONOMICS AND MACROECONOMICS
Name of the Student
Name of the University
Author Note
Course ID:
MICROECONOMICS AND MACROECONOMICS
Name of the Student
Name of the University
Author Note
Course ID:
Paraphrase This Document
Need a fresh take? Get an instant paraphrase of this document with our AI Paraphraser
1MICROECONOMICS AND MACROECONOMICS
Table of Contents
Introduction................................................................................................................................3
Discussion..................................................................................................................................3
Part A.....................................................................................................................................3
Response to question 2...........................................................................................................3
Consumption of bread rises................................................................................................3
Cheaper technique of grinding flour..................................................................................4
Rise of price of other grains...............................................................................................5
Price of potato and rice increases.......................................................................................6
Response to question 3...........................................................................................................7
Comparison of Returns to Scale and Law of diminishing marginal returns......................7
Firms are price takers in perfect competition.........................................................................9
Response to question 5.........................................................................................................10
Difference between income elasticity of demand and price elasticity of demand...........10
Cross Price Elasticity of demand.....................................................................................11
Firms knowledge about the three models.........................................................................12
Part B....................................................................................................................................12
Response to question 7.........................................................................................................12
Business Cycle.................................................................................................................12
Four stages of the Business Cycle....................................................................................13
Types of Unemployment..................................................................................................13
Money market..................................................................................................................14
2MICROECONOMICS AND MACROECONOMICS
Response to question 8.........................................................................................................15
GDP measured on quarterly basis....................................................................................15
Recession..........................................................................................................................15
Expansionary Fiscal Policy..............................................................................................16
Response to question 9.........................................................................................................17
Difference between demand-pull and cost-push inflation...............................................17
Causes of demand-pull and cost-push inflation...............................................................18
Interaction of Cost-Push and Demand-Pull inflation.......................................................18
Conclusion................................................................................................................................19
Reference..................................................................................................................................20
⊘ This is a preview!⊘
Do you want full access?
Subscribe today to unlock all pages.
Trusted by 1+ million students worldwide
3MICROECONOMICS AND MACROECONOMICS
Introduction
The report is prepared to understand the microeconomic and macroeconomic
concepts. The response to the question related to microeconomics will provide a clear view
on the theories of change in demand and supply when the market price of wheat flour
changes, the difference between returns to scale and diminishing marginal returns, firms
being a price-taker. Whereas, the macroeconomic answers will clear the idea of the business
cycle, money market, a measure of GDP quarterly, recession and difference between
demand-pull and cost-push inflation.
Discussion
Part A
Response to question 2
Consumption of bread rises
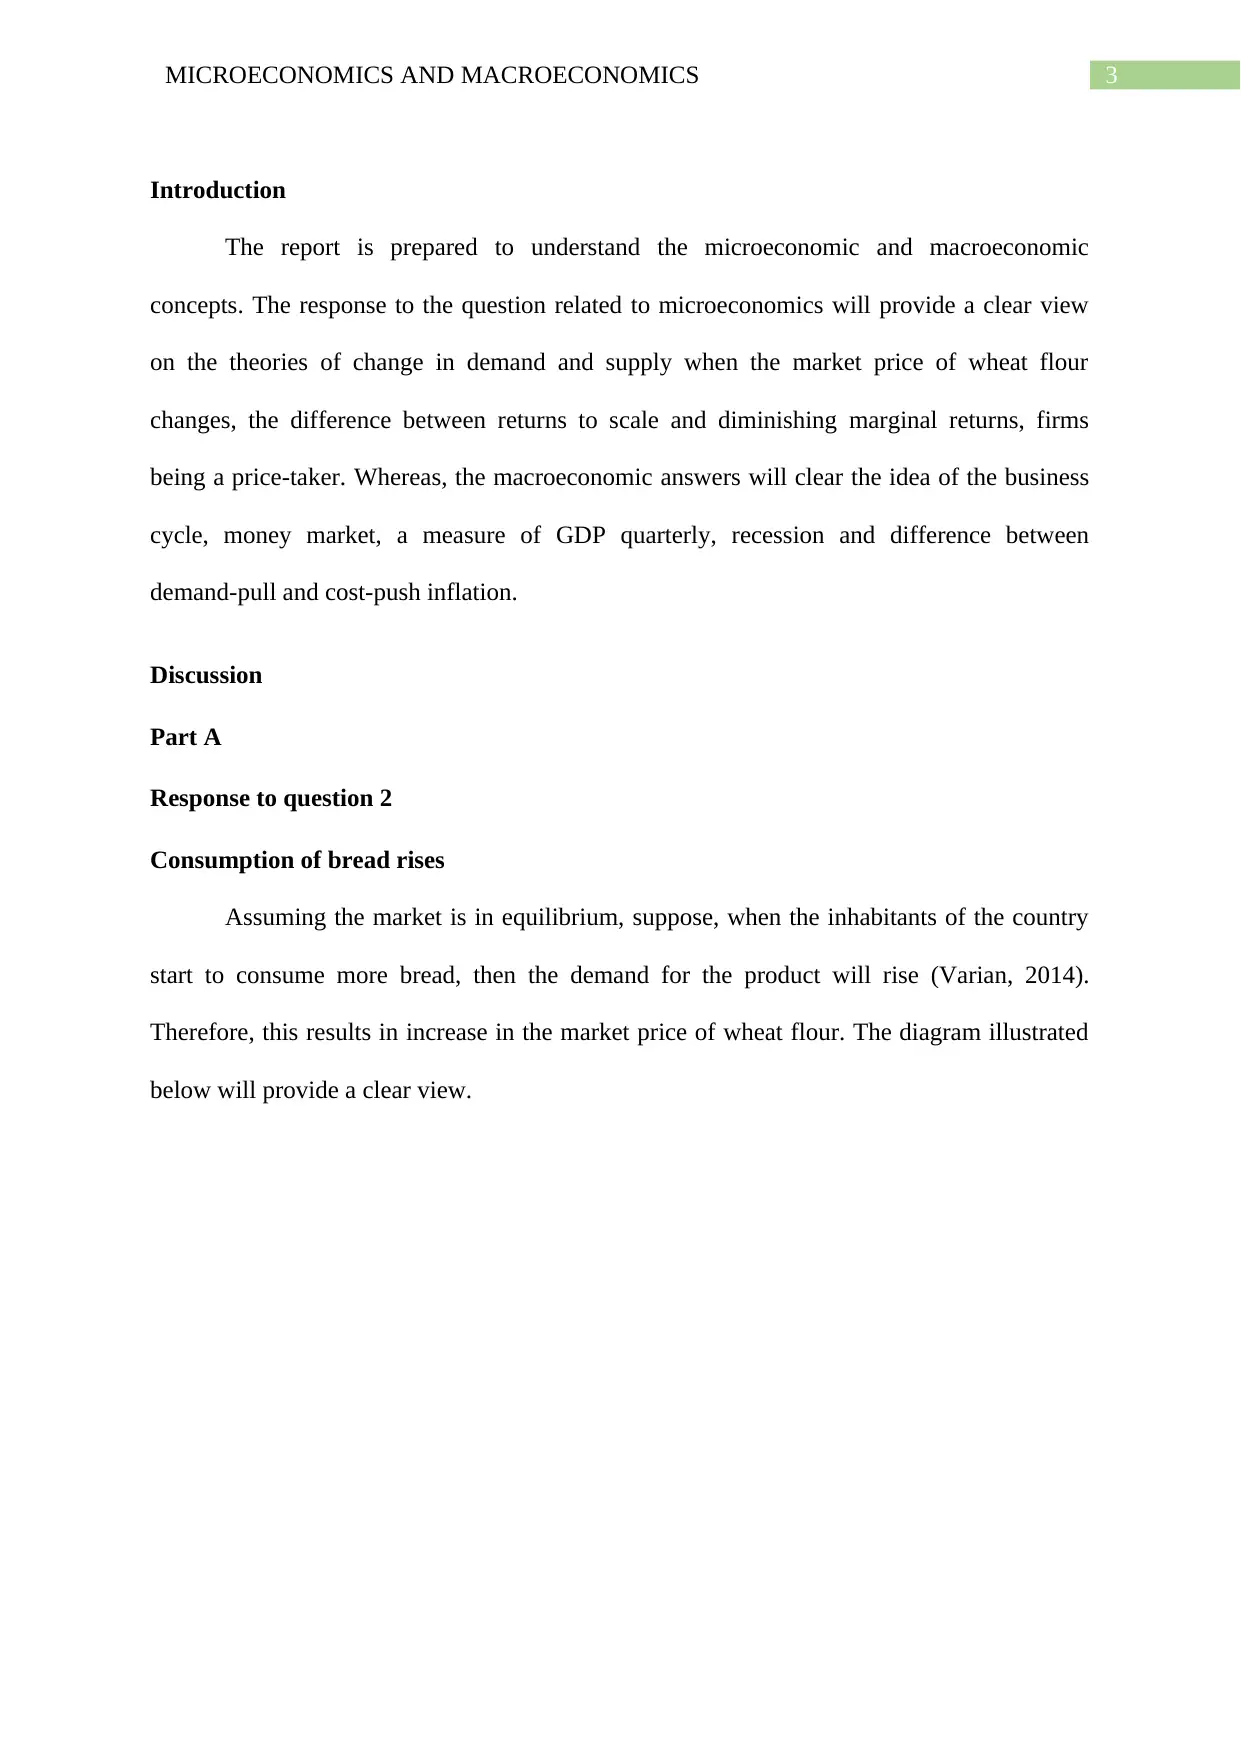
Assuming the market is in equilibrium, suppose, when the inhabitants of the country
start to consume more bread, then the demand for the product will rise (Varian, 2014).
Therefore, this results in increase in the market price of wheat flour. The diagram illustrated
below will provide a clear view.
Introduction
The report is prepared to understand the microeconomic and macroeconomic
concepts. The response to the question related to microeconomics will provide a clear view
on the theories of change in demand and supply when the market price of wheat flour
changes, the difference between returns to scale and diminishing marginal returns, firms
being a price-taker. Whereas, the macroeconomic answers will clear the idea of the business
cycle, money market, a measure of GDP quarterly, recession and difference between
demand-pull and cost-push inflation.
Discussion
Part A
Response to question 2
Consumption of bread rises
Assuming the market is in equilibrium, suppose, when the inhabitants of the country
start to consume more bread, then the demand for the product will rise (Varian, 2014).
Therefore, this results in increase in the market price of wheat flour. The diagram illustrated
below will provide a clear view.
Paraphrase This Document
Need a fresh take? Get an instant paraphrase of this document with our AI Paraphraser
4MICROECONOMICS AND MACROECONOMICS
S
S D
D D1
D1
E
E1
Price
QuantityQ Q1
P
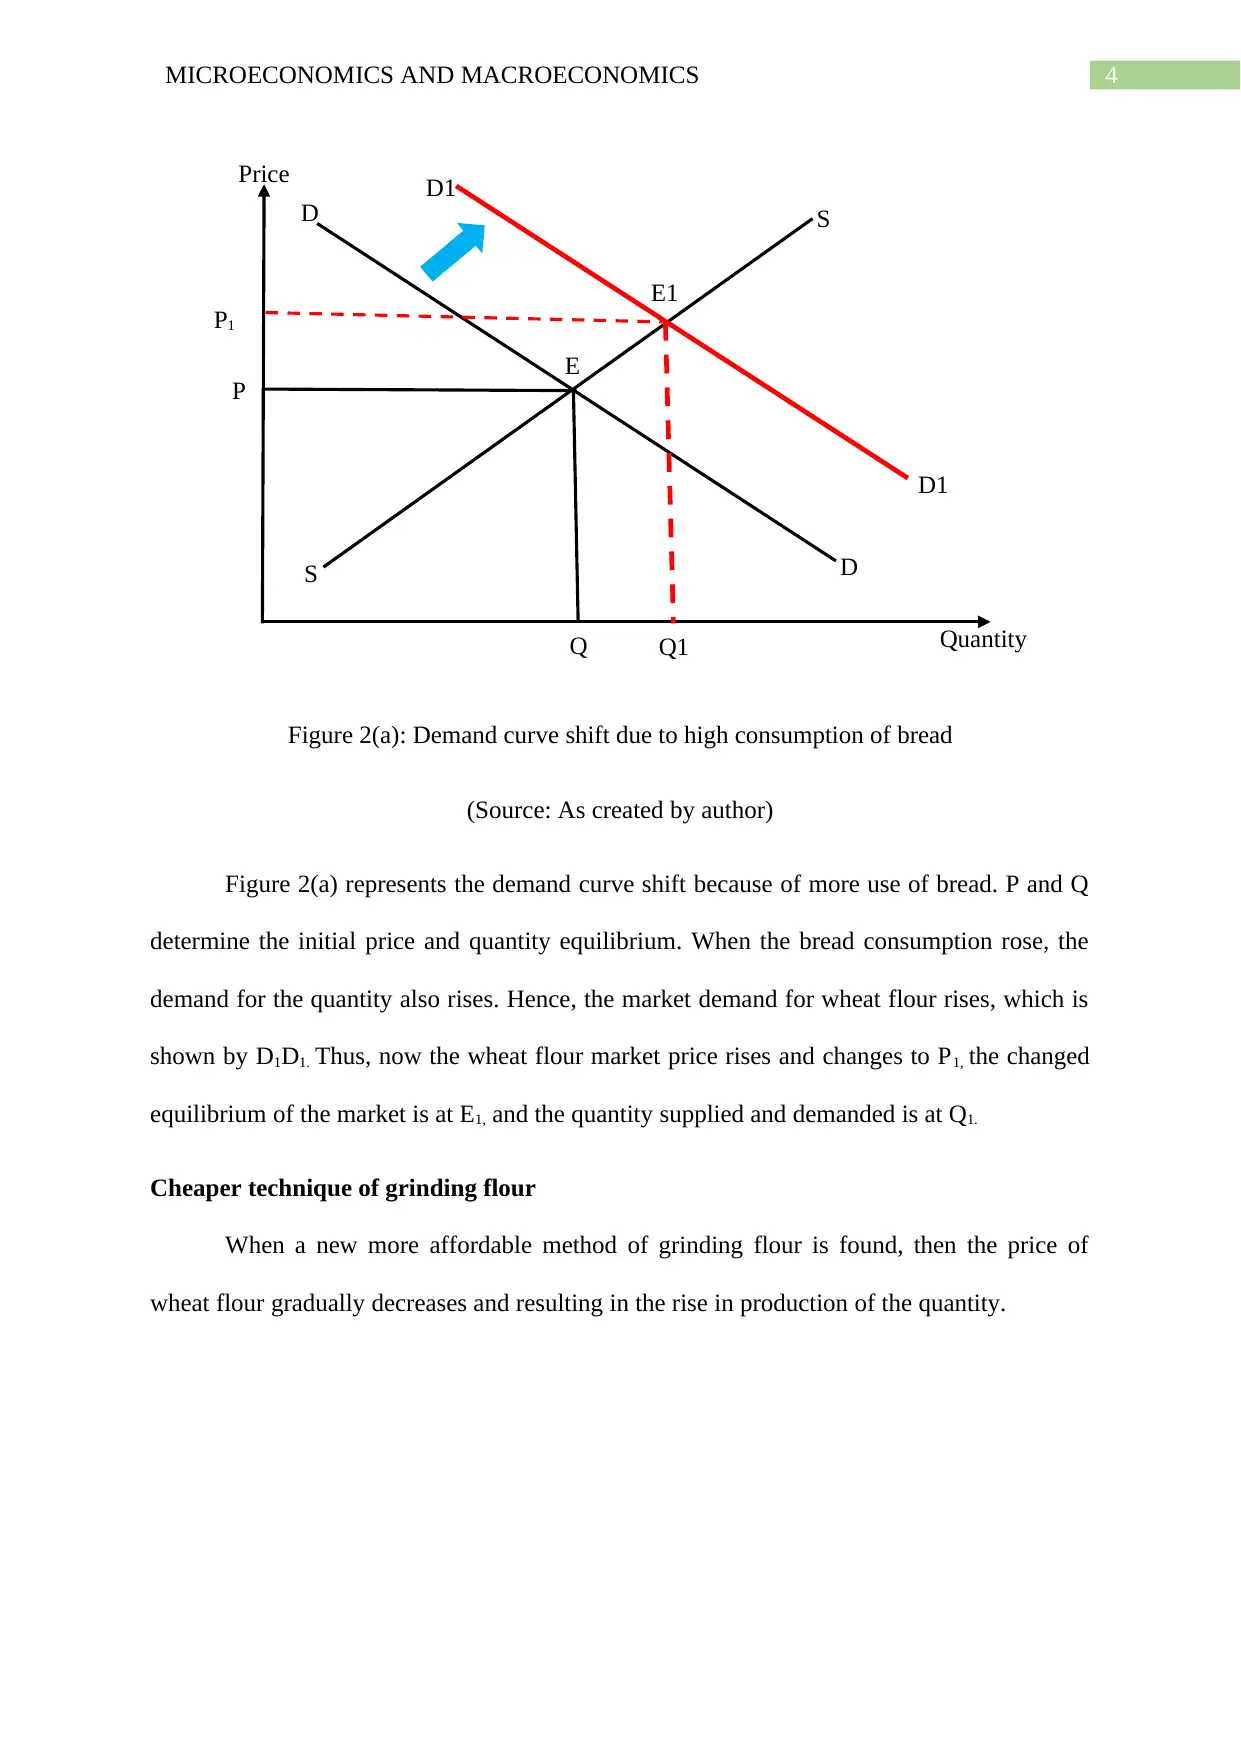
Figure 2(a): Demand curve shift due to high consumption of bread
(Source: As created by author)
Figure 2(a) represents the demand curve shift because of more use of bread. P and Q
determine the initial price and quantity equilibrium. When the bread consumption rose, the
demand for the quantity also rises. Hence, the market demand for wheat flour rises, which is
shown by D1D1. Thus, now the wheat flour market price rises and changes to P1, the changed
equilibrium of the market is at E1, and the quantity supplied and demanded is at Q1.
Cheaper technique of grinding flour
When a new more affordable method of grinding flour is found, then the price of
wheat flour gradually decreases and resulting in the rise in production of the quantity.
P1
S
S D
D D1
D1
E
E1
Price
QuantityQ Q1
P
Figure 2(a): Demand curve shift due to high consumption of bread
(Source: As created by author)
Figure 2(a) represents the demand curve shift because of more use of bread. P and Q
determine the initial price and quantity equilibrium. When the bread consumption rose, the
demand for the quantity also rises. Hence, the market demand for wheat flour rises, which is
shown by D1D1. Thus, now the wheat flour market price rises and changes to P1, the changed
equilibrium of the market is at E1, and the quantity supplied and demanded is at Q1.
Cheaper technique of grinding flour
When a new more affordable method of grinding flour is found, then the price of
wheat flour gradually decreases and resulting in the rise in production of the quantity.
P1
5MICROECONOMICS AND MACROECONOMICS
S
S D
D
S1
S1
E
E1
Price
QuantityQ Q1
P
P1
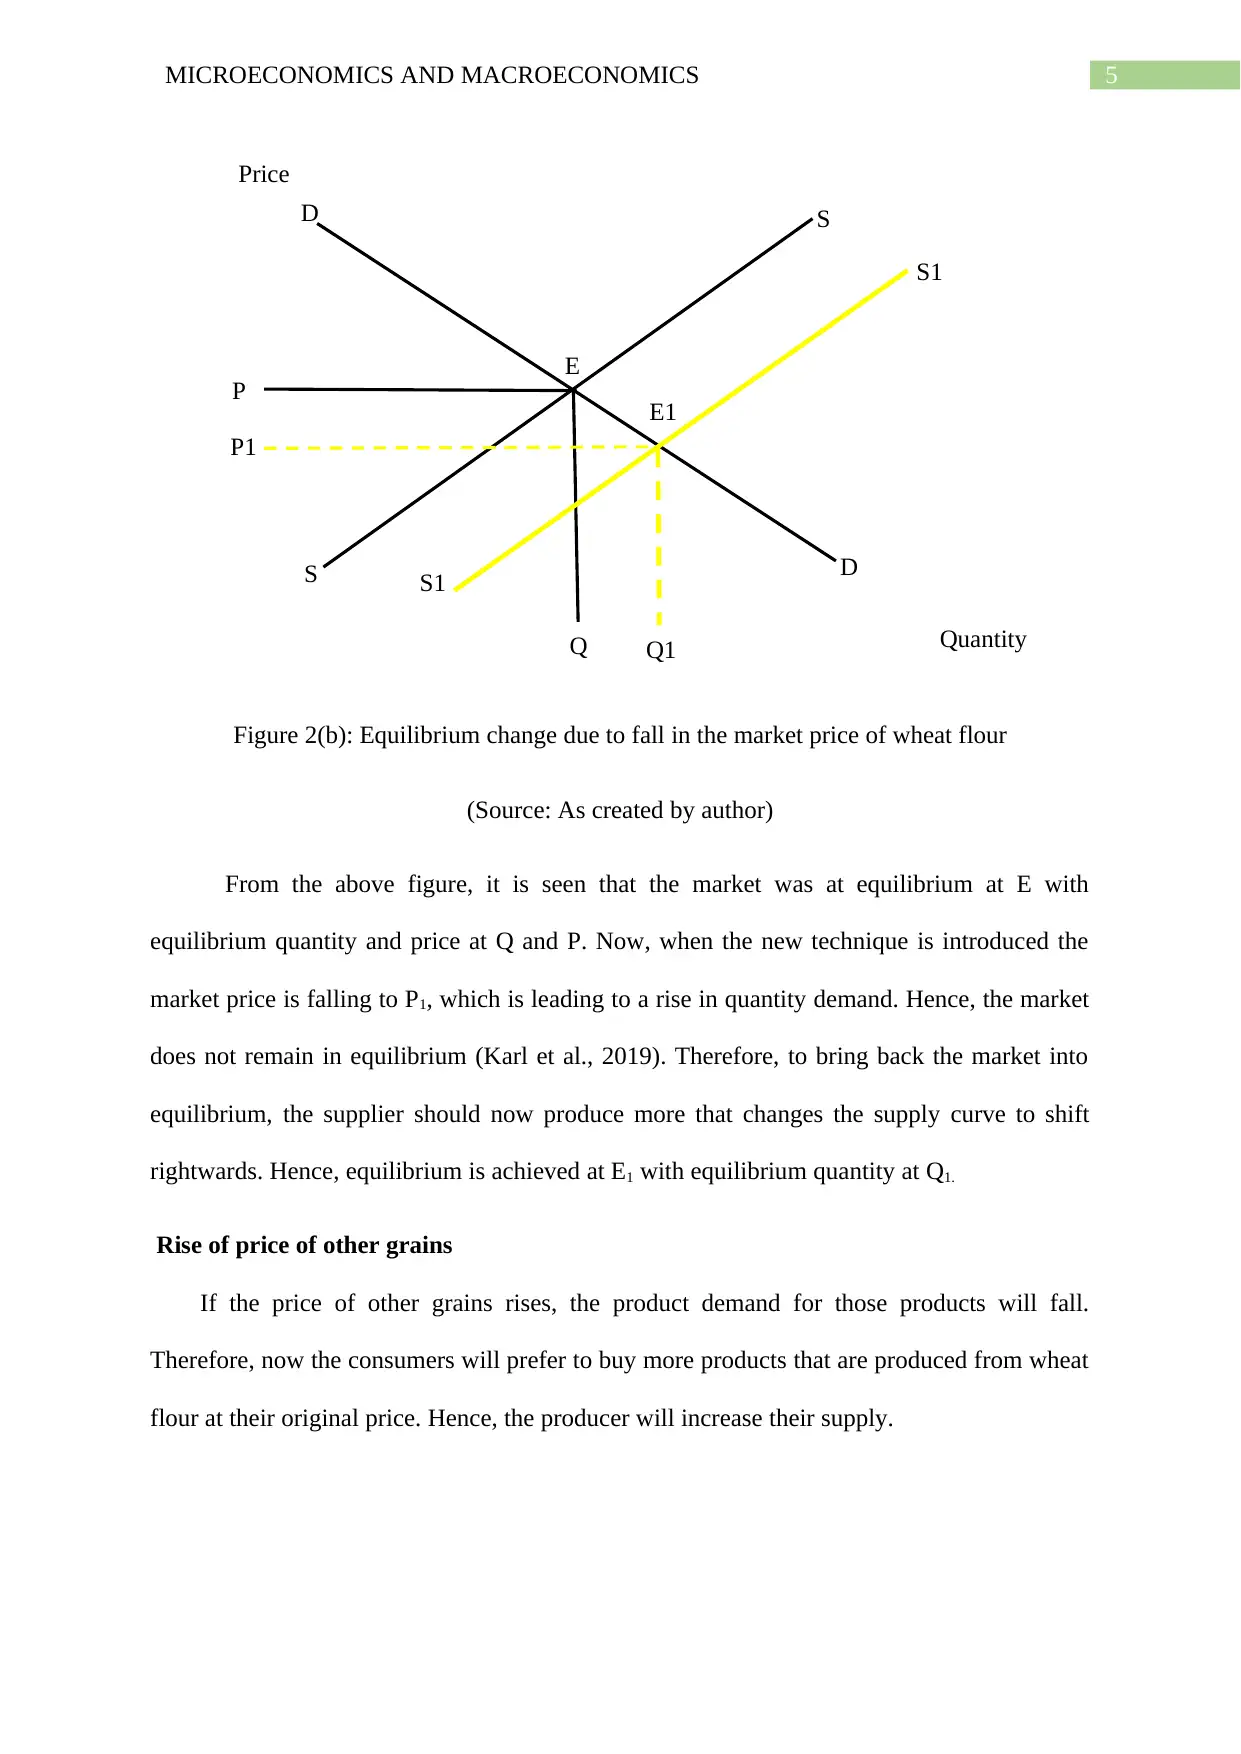
Figure 2(b): Equilibrium change due to fall in the market price of wheat flour
(Source: As created by author)
From the above figure, it is seen that the market was at equilibrium at E with
equilibrium quantity and price at Q and P. Now, when the new technique is introduced the
market price is falling to P1, which is leading to a rise in quantity demand. Hence, the market
does not remain in equilibrium (Karl et al., 2019). Therefore, to bring back the market into
equilibrium, the supplier should now produce more that changes the supply curve to shift
rightwards. Hence, equilibrium is achieved at E1 with equilibrium quantity at Q1.
Rise of price of other grains
If the price of other grains rises, the product demand for those products will fall.
Therefore, now the consumers will prefer to buy more products that are produced from wheat
flour at their original price. Hence, the producer will increase their supply.
S
S D
D
S1
S1
E
E1
Price
QuantityQ Q1
P
P1
Figure 2(b): Equilibrium change due to fall in the market price of wheat flour
(Source: As created by author)
From the above figure, it is seen that the market was at equilibrium at E with
equilibrium quantity and price at Q and P. Now, when the new technique is introduced the
market price is falling to P1, which is leading to a rise in quantity demand. Hence, the market
does not remain in equilibrium (Karl et al., 2019). Therefore, to bring back the market into
equilibrium, the supplier should now produce more that changes the supply curve to shift
rightwards. Hence, equilibrium is achieved at E1 with equilibrium quantity at Q1.
Rise of price of other grains
If the price of other grains rises, the product demand for those products will fall.
Therefore, now the consumers will prefer to buy more products that are produced from wheat
flour at their original price. Hence, the producer will increase their supply.
⊘ This is a preview!⊘
Do you want full access?
Subscribe today to unlock all pages.
Trusted by 1+ million students worldwide
6MICROECONOMICS AND MACROECONOMICS
S
S D
D D1
D1
E
Price
QuantityQ Q1
P
S1
S1
E1
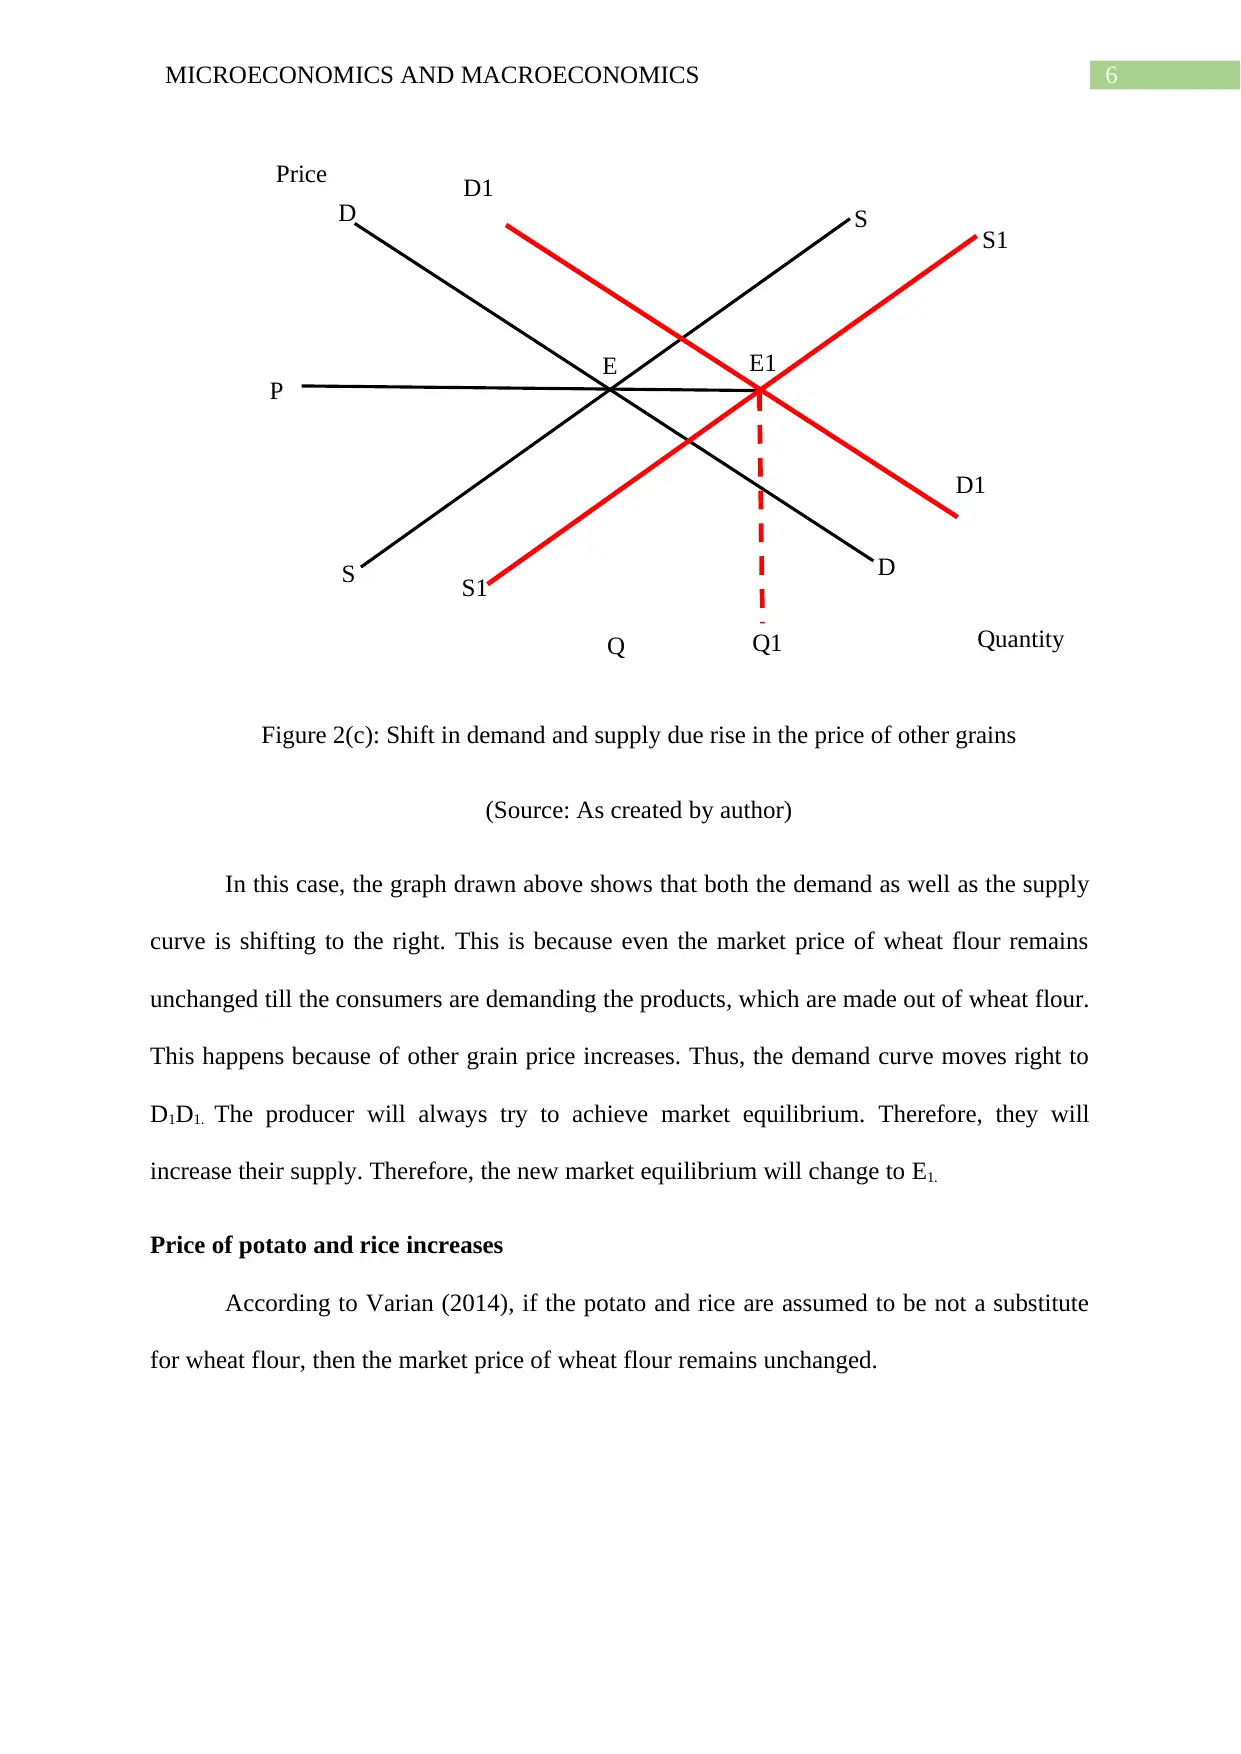
Figure 2(c): Shift in demand and supply due rise in the price of other grains
(Source: As created by author)
In this case, the graph drawn above shows that both the demand as well as the supply
curve is shifting to the right. This is because even the market price of wheat flour remains
unchanged till the consumers are demanding the products, which are made out of wheat flour.
This happens because of other grain price increases. Thus, the demand curve moves right to
D1D1. The producer will always try to achieve market equilibrium. Therefore, they will
increase their supply. Therefore, the new market equilibrium will change to E1.
Price of potato and rice increases
According to Varian (2014), if the potato and rice are assumed to be not a substitute
for wheat flour, then the market price of wheat flour remains unchanged.
S
S D
D D1
D1
E
Price
QuantityQ Q1
P
S1
S1
E1
Figure 2(c): Shift in demand and supply due rise in the price of other grains
(Source: As created by author)
In this case, the graph drawn above shows that both the demand as well as the supply
curve is shifting to the right. This is because even the market price of wheat flour remains
unchanged till the consumers are demanding the products, which are made out of wheat flour.
This happens because of other grain price increases. Thus, the demand curve moves right to
D1D1. The producer will always try to achieve market equilibrium. Therefore, they will
increase their supply. Therefore, the new market equilibrium will change to E1.
Price of potato and rice increases
According to Varian (2014), if the potato and rice are assumed to be not a substitute
for wheat flour, then the market price of wheat flour remains unchanged.
Paraphrase This Document
Need a fresh take? Get an instant paraphrase of this document with our AI Paraphraser
7MICROECONOMICS AND MACROECONOMICS
S
S D
D
E
Price
QuantityQ
P
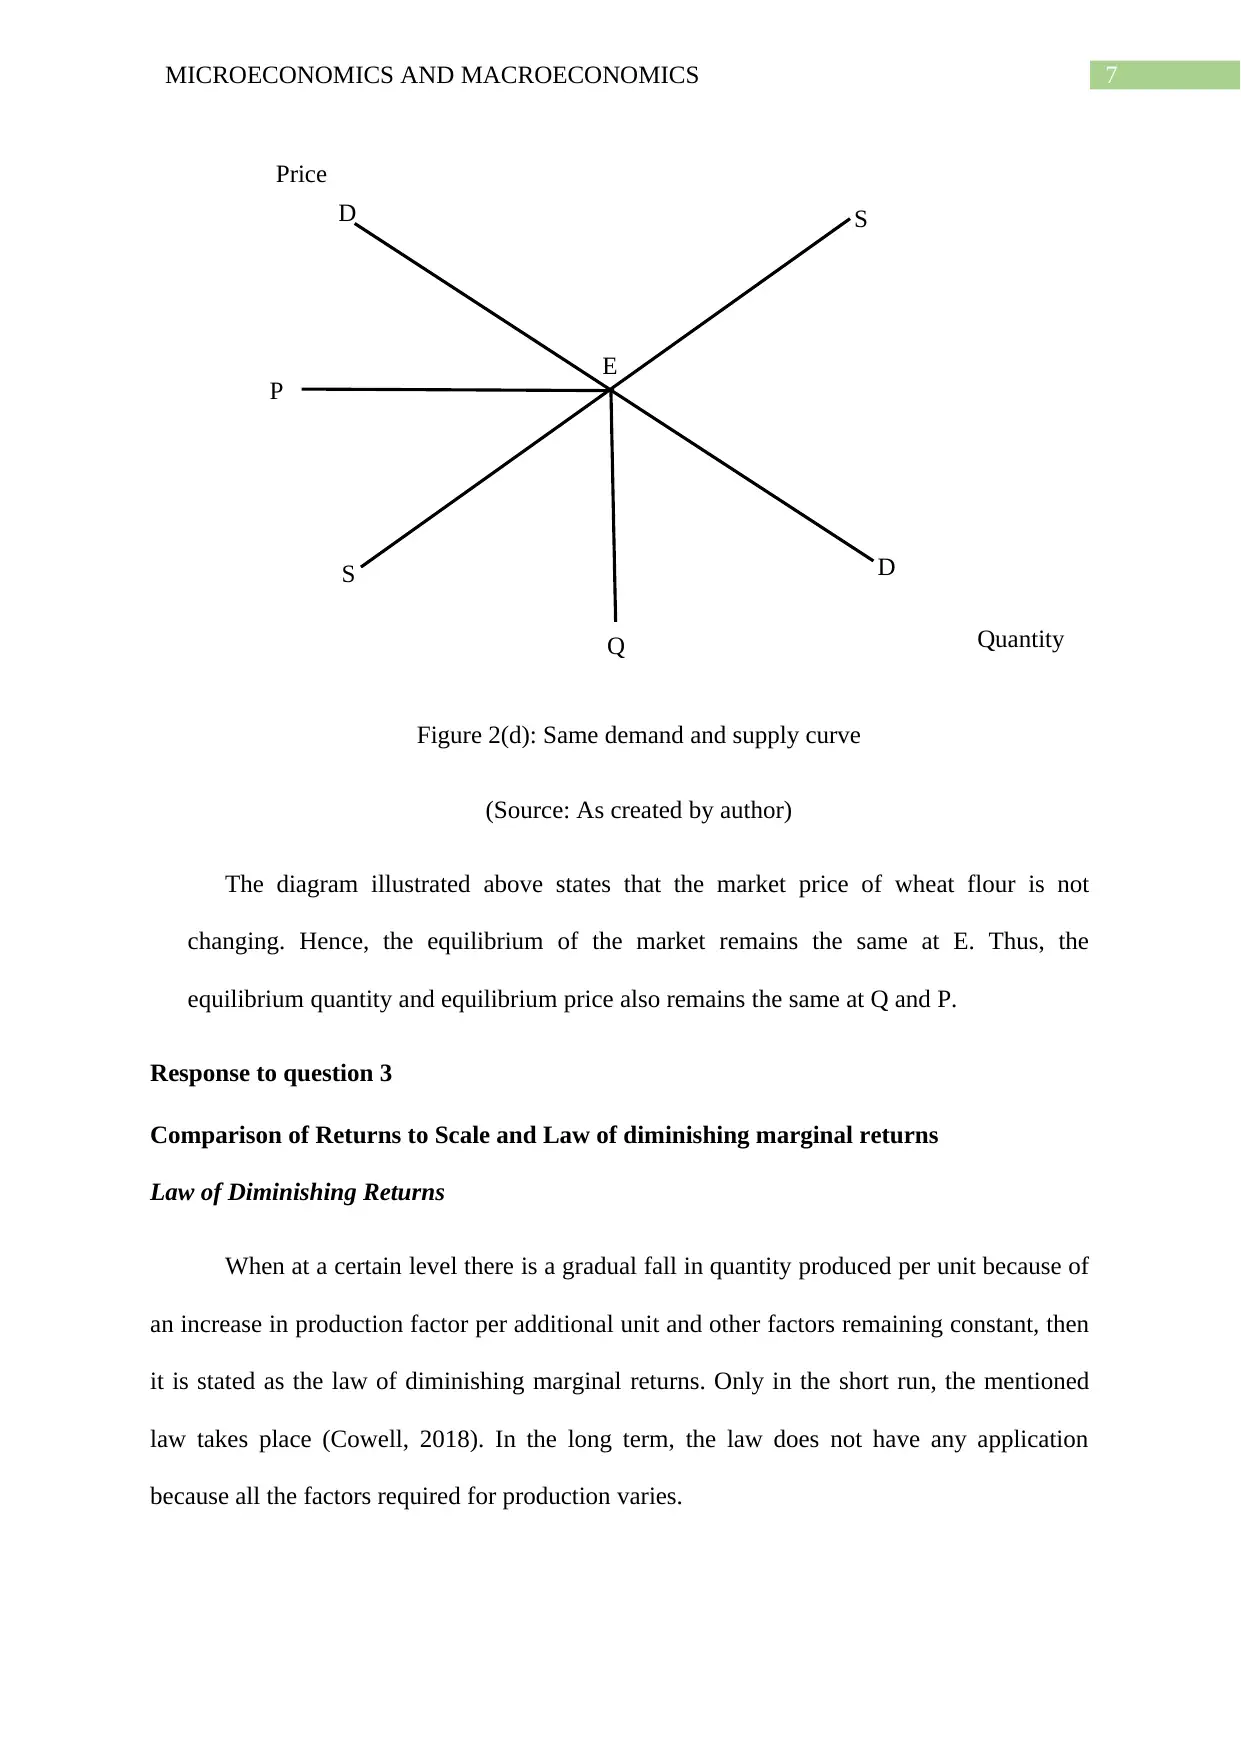
Figure 2(d): Same demand and supply curve
(Source: As created by author)
The diagram illustrated above states that the market price of wheat flour is not
changing. Hence, the equilibrium of the market remains the same at E. Thus, the
equilibrium quantity and equilibrium price also remains the same at Q and P.
Response to question 3
Comparison of Returns to Scale and Law of diminishing marginal returns
Law of Diminishing Returns
When at a certain level there is a gradual fall in quantity produced per unit because of
an increase in production factor per additional unit and other factors remaining constant, then
it is stated as the law of diminishing marginal returns. Only in the short run, the mentioned
law takes place (Cowell, 2018). In the long term, the law does not have any application
because all the factors required for production varies.
S
S D
D
E
Price
QuantityQ
P
Figure 2(d): Same demand and supply curve
(Source: As created by author)
The diagram illustrated above states that the market price of wheat flour is not
changing. Hence, the equilibrium of the market remains the same at E. Thus, the
equilibrium quantity and equilibrium price also remains the same at Q and P.
Response to question 3
Comparison of Returns to Scale and Law of diminishing marginal returns
Law of Diminishing Returns
When at a certain level there is a gradual fall in quantity produced per unit because of
an increase in production factor per additional unit and other factors remaining constant, then
it is stated as the law of diminishing marginal returns. Only in the short run, the mentioned
law takes place (Cowell, 2018). In the long term, the law does not have any application
because all the factors required for production varies.
8MICROECONOMICS AND MACROECONOMICS
TPL
Negative
Marginal
Returns
Increasing
Marginal
Returns Diminishing
Marginal
Returns
Production
Labor
APL
MP
L
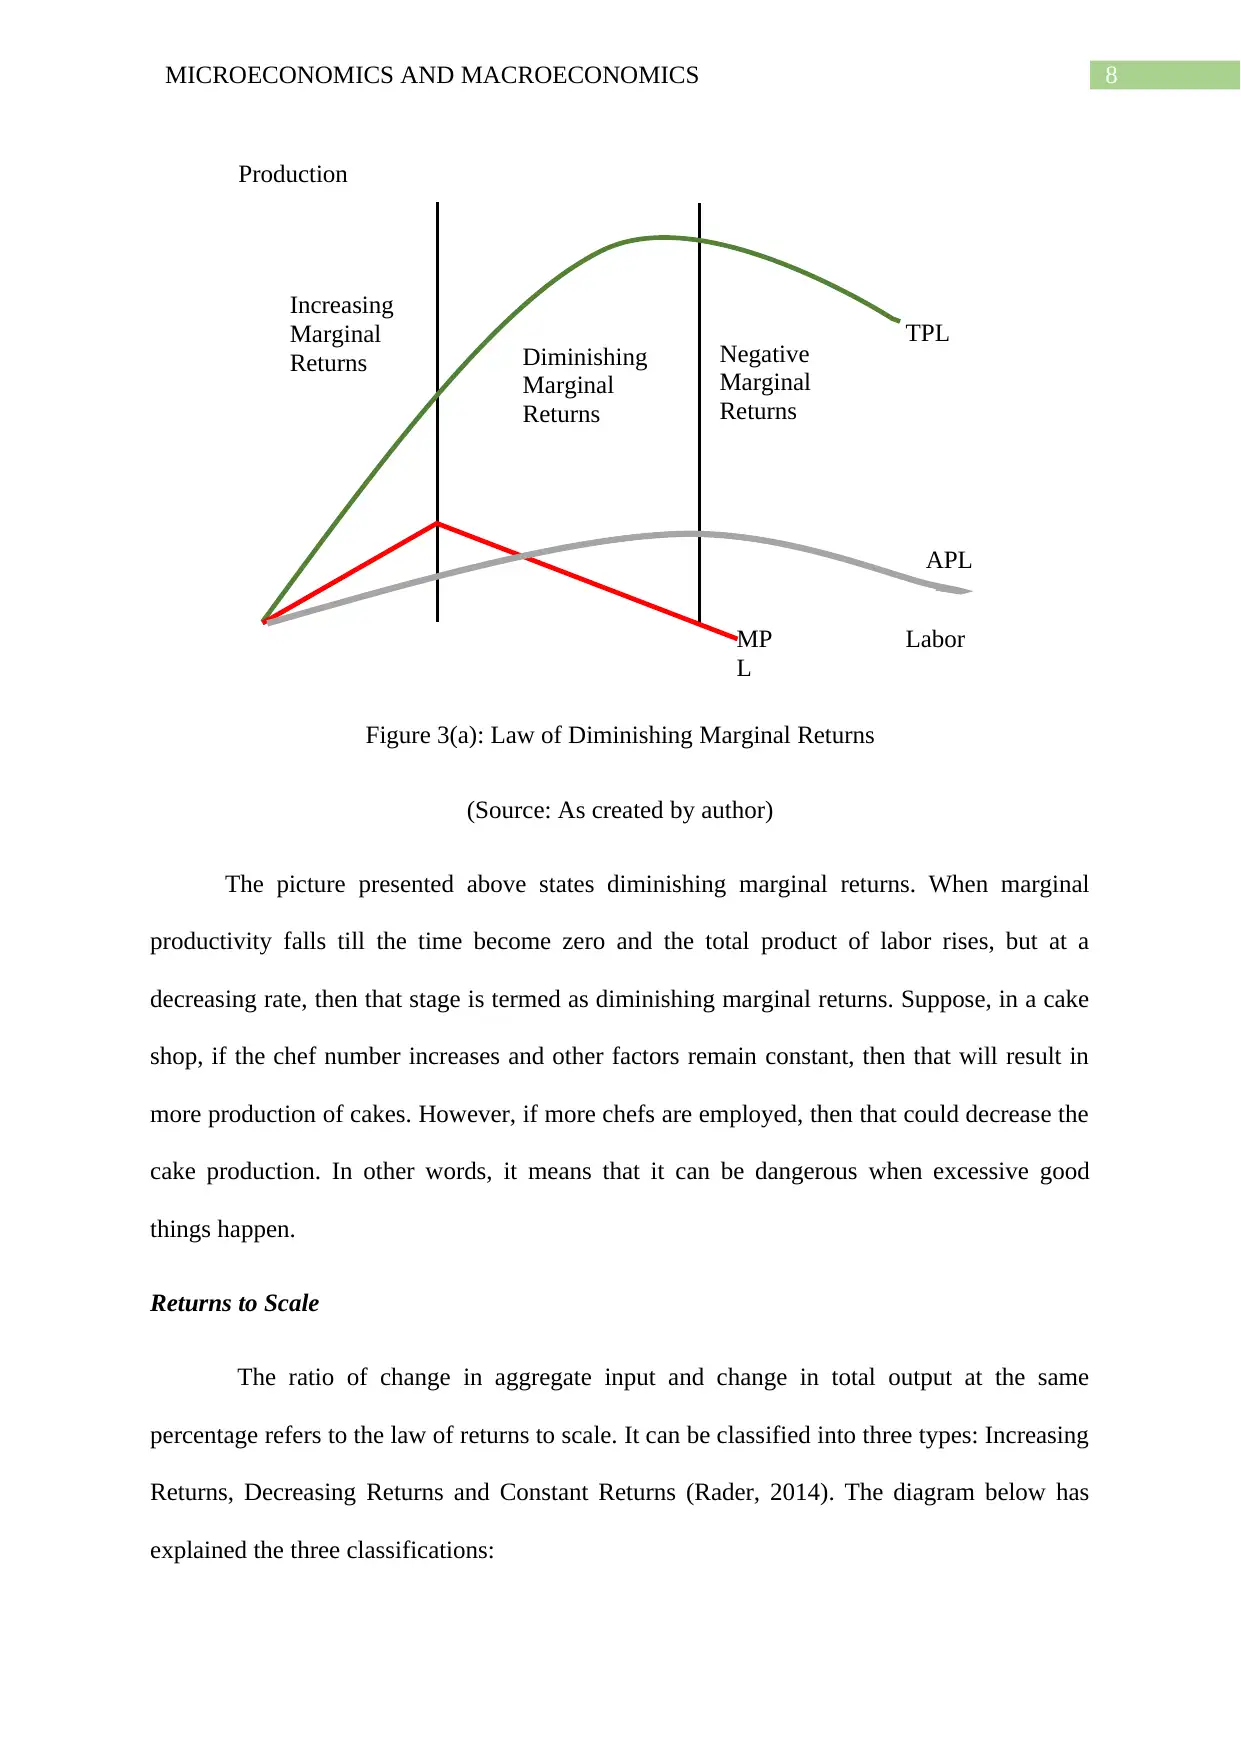
Figure 3(a): Law of Diminishing Marginal Returns
(Source: As created by author)
The picture presented above states diminishing marginal returns. When marginal
productivity falls till the time become zero and the total product of labor rises, but at a
decreasing rate, then that stage is termed as diminishing marginal returns. Suppose, in a cake
shop, if the chef number increases and other factors remain constant, then that will result in
more production of cakes. However, if more chefs are employed, then that could decrease the
cake production. In other words, it means that it can be dangerous when excessive good
things happen.
Returns to Scale
The ratio of change in aggregate input and change in total output at the same
percentage refers to the law of returns to scale. It can be classified into three types: Increasing
Returns, Decreasing Returns and Constant Returns (Rader, 2014). The diagram below has
explained the three classifications:
TPL
Negative
Marginal
Returns
Increasing
Marginal
Returns Diminishing
Marginal
Returns
Production
Labor
APL
MP
L
Figure 3(a): Law of Diminishing Marginal Returns
(Source: As created by author)
The picture presented above states diminishing marginal returns. When marginal
productivity falls till the time become zero and the total product of labor rises, but at a
decreasing rate, then that stage is termed as diminishing marginal returns. Suppose, in a cake
shop, if the chef number increases and other factors remain constant, then that will result in
more production of cakes. However, if more chefs are employed, then that could decrease the
cake production. In other words, it means that it can be dangerous when excessive good
things happen.
Returns to Scale
The ratio of change in aggregate input and change in total output at the same
percentage refers to the law of returns to scale. It can be classified into three types: Increasing
Returns, Decreasing Returns and Constant Returns (Rader, 2014). The diagram below has
explained the three classifications:
⊘ This is a preview!⊘
Do you want full access?
Subscribe today to unlock all pages.
Trusted by 1+ million students worldwide
9MICROECONOMICS AND MACROECONOMICS
Constant Return
Increasing Returns
Diminishing Returns
D
Output
Input
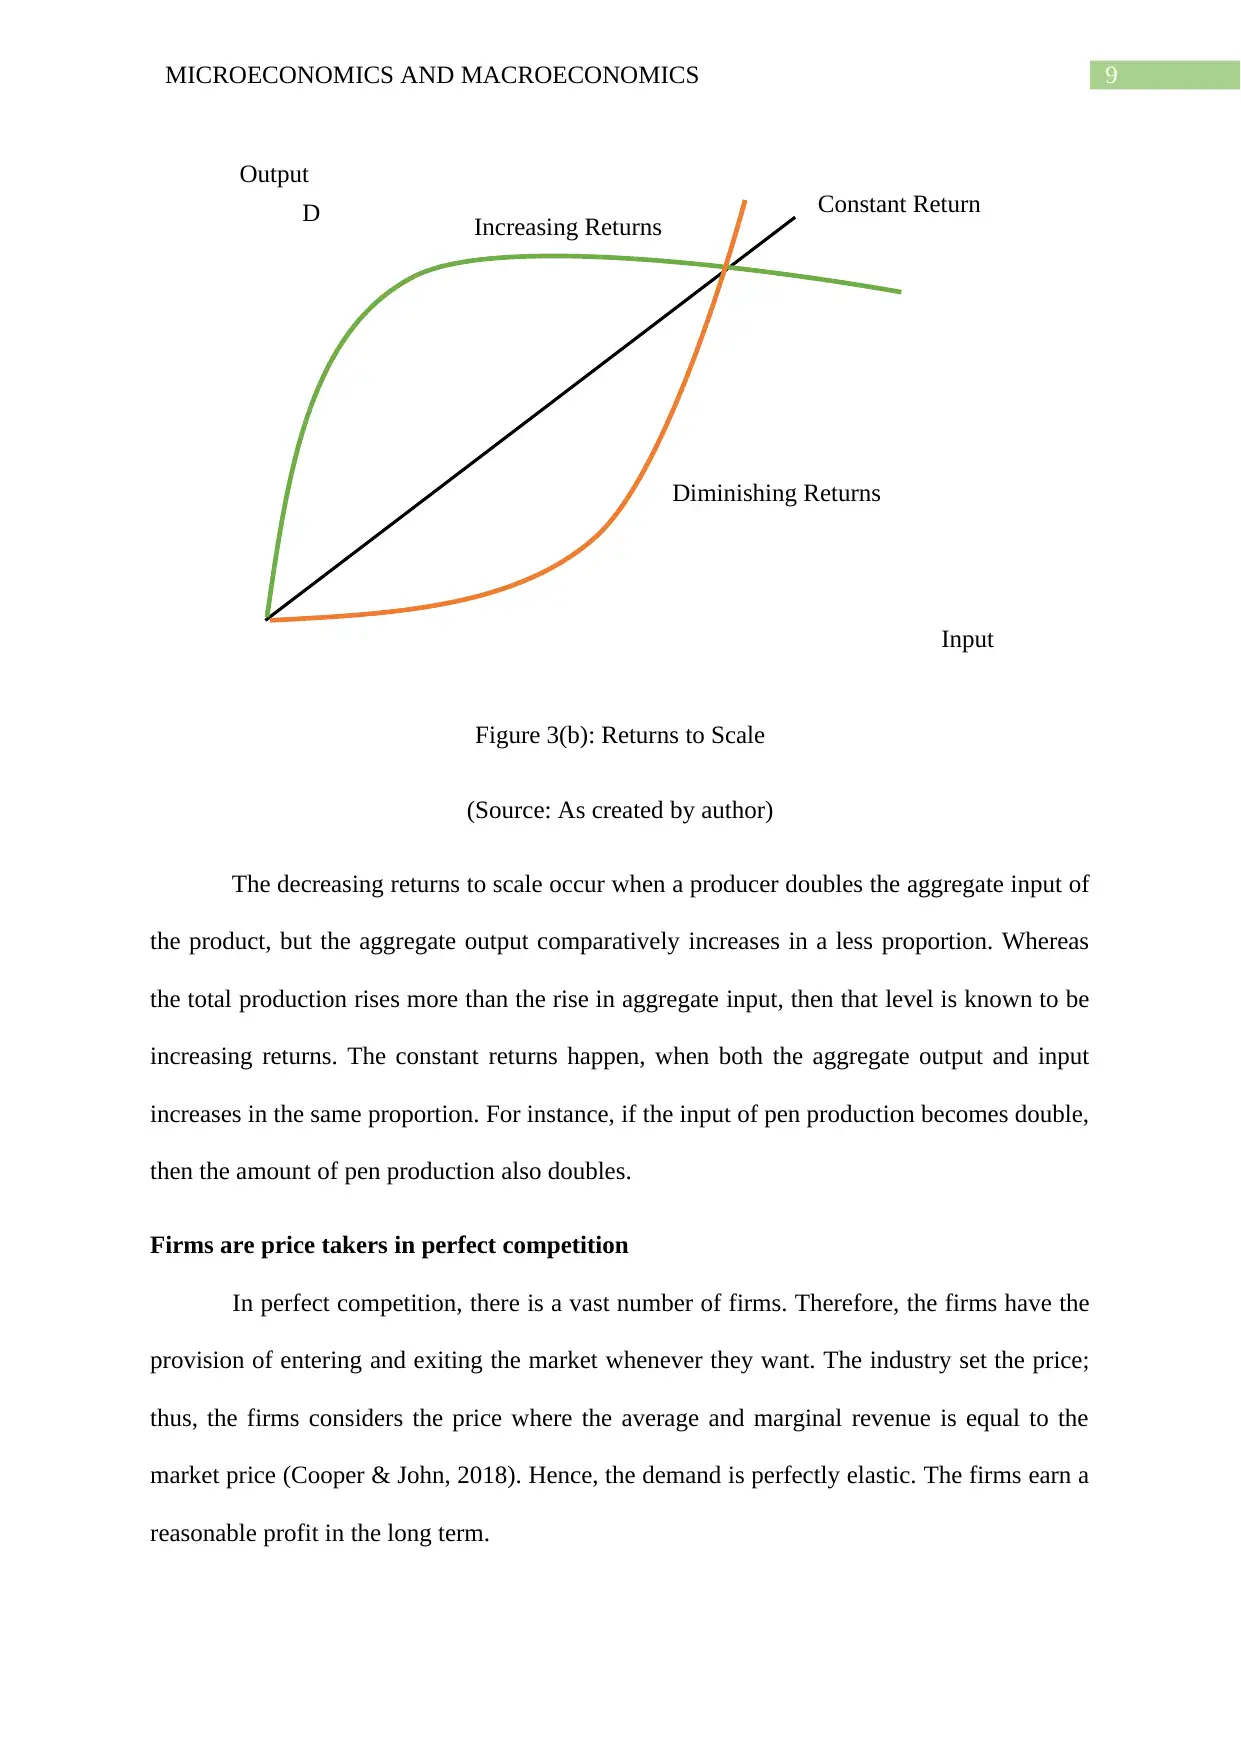
Figure 3(b): Returns to Scale
(Source: As created by author)
The decreasing returns to scale occur when a producer doubles the aggregate input of
the product, but the aggregate output comparatively increases in a less proportion. Whereas
the total production rises more than the rise in aggregate input, then that level is known to be
increasing returns. The constant returns happen, when both the aggregate output and input
increases in the same proportion. For instance, if the input of pen production becomes double,
then the amount of pen production also doubles.
Firms are price takers in perfect competition
In perfect competition, there is a vast number of firms. Therefore, the firms have the
provision of entering and exiting the market whenever they want. The industry set the price;
thus, the firms considers the price where the average and marginal revenue is equal to the
market price (Cooper & John, 2018). Hence, the demand is perfectly elastic. The firms earn a
reasonable profit in the long term.
Constant Return
Increasing Returns
Diminishing Returns
D
Output
Input
Figure 3(b): Returns to Scale
(Source: As created by author)
The decreasing returns to scale occur when a producer doubles the aggregate input of
the product, but the aggregate output comparatively increases in a less proportion. Whereas
the total production rises more than the rise in aggregate input, then that level is known to be
increasing returns. The constant returns happen, when both the aggregate output and input
increases in the same proportion. For instance, if the input of pen production becomes double,
then the amount of pen production also doubles.
Firms are price takers in perfect competition
In perfect competition, there is a vast number of firms. Therefore, the firms have the
provision of entering and exiting the market whenever they want. The industry set the price;
thus, the firms considers the price where the average and marginal revenue is equal to the
market price (Cooper & John, 2018). Hence, the demand is perfectly elastic. The firms earn a
reasonable profit in the long term.
Paraphrase This Document
Need a fresh take? Get an instant paraphrase of this document with our AI Paraphraser
10MICROECONOMICS AND MACROECONOMICS
S
S D
D
E
Price
Quantity
Q
P
Q1
P1
Price
Quantity
MC
AC
D=AR=MR
Firm Industry
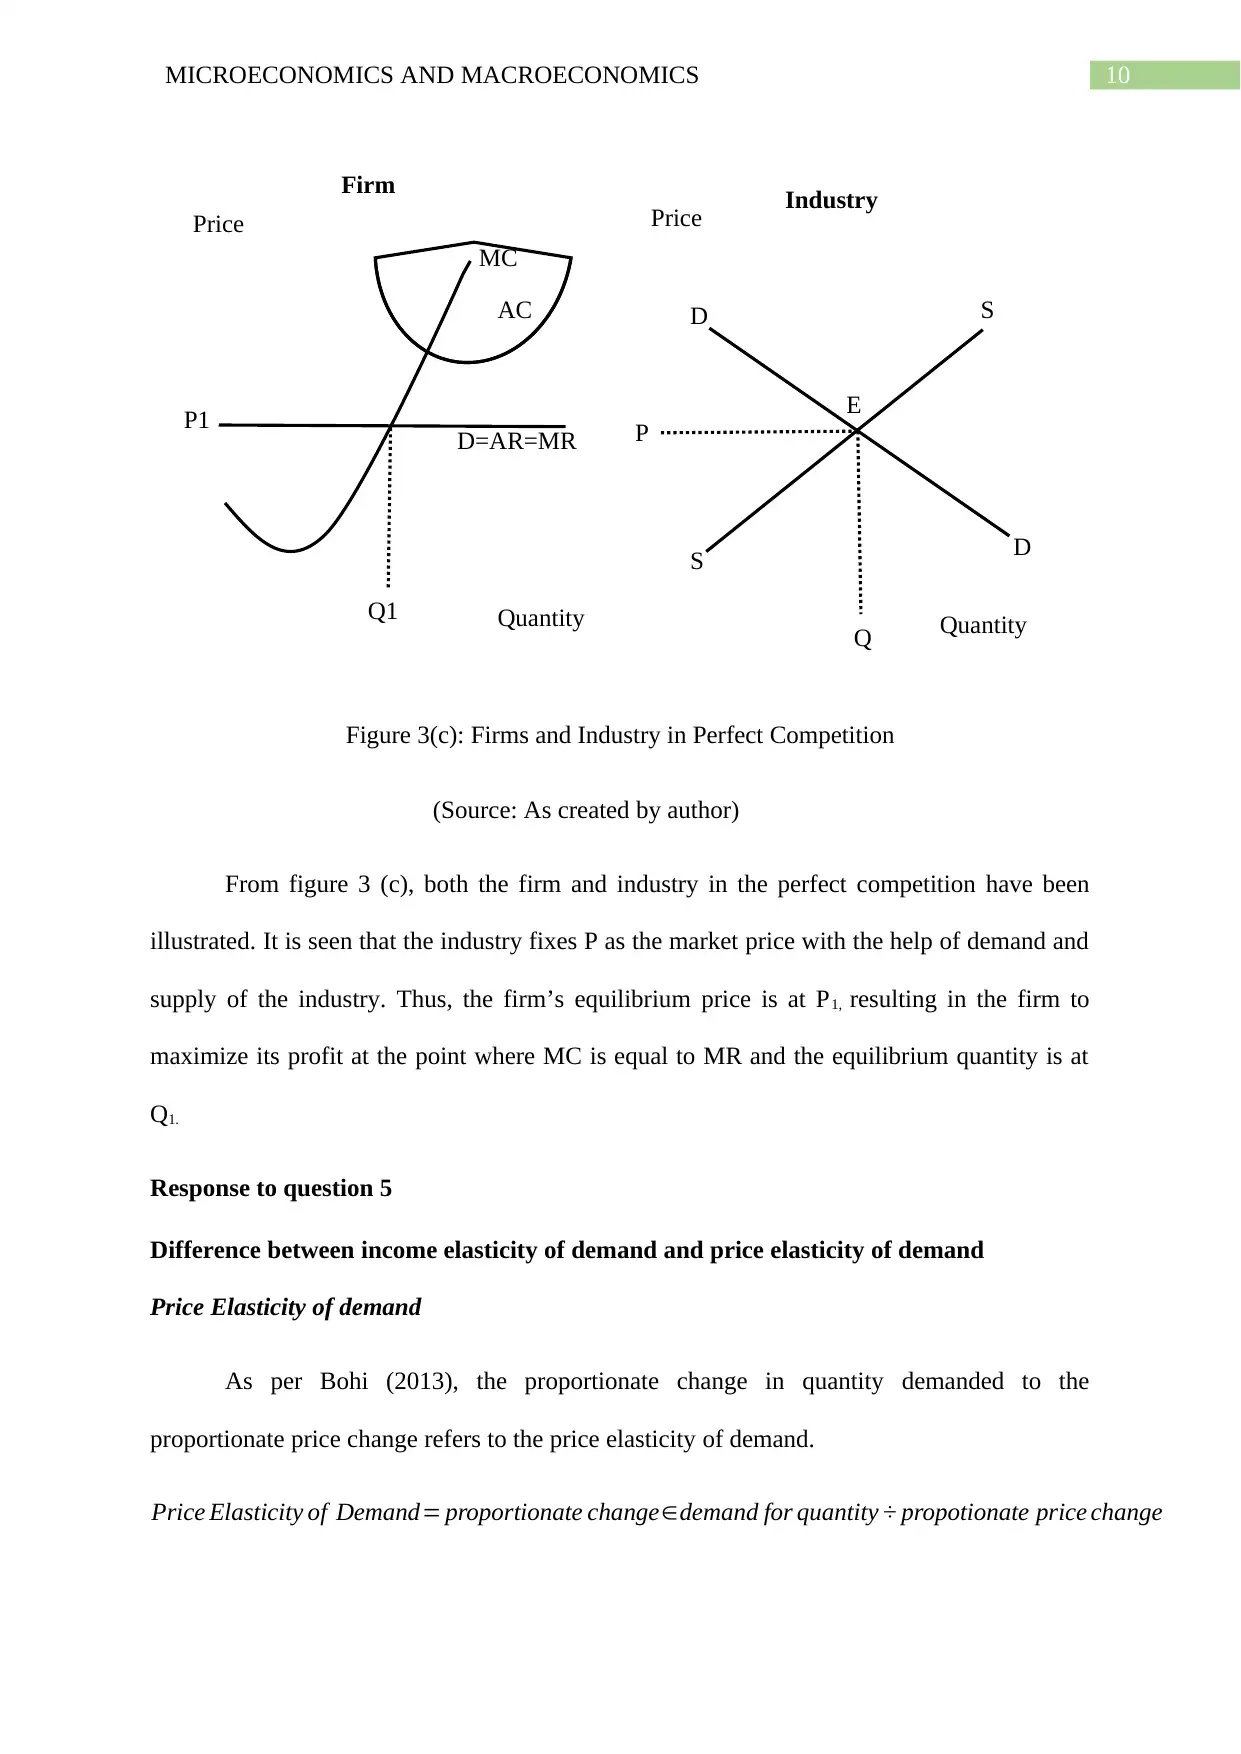
Figure 3(c): Firms and Industry in Perfect Competition
(Source: As created by author)
From figure 3 (c), both the firm and industry in the perfect competition have been
illustrated. It is seen that the industry fixes P as the market price with the help of demand and
supply of the industry. Thus, the firm’s equilibrium price is at P1, resulting in the firm to
maximize its profit at the point where MC is equal to MR and the equilibrium quantity is at
Q1.
Response to question 5
Difference between income elasticity of demand and price elasticity of demand
Price Elasticity of demand
As per Bohi (2013), the proportionate change in quantity demanded to the
proportionate price change refers to the price elasticity of demand.
Price Elasticity of Demand= proportionate change∈demand for quantity ÷ propotionate price change
S
S D
D
E
Price
Quantity
Q
P
Q1
P1
Price
Quantity
MC
AC
D=AR=MR
Firm Industry
Figure 3(c): Firms and Industry in Perfect Competition
(Source: As created by author)
From figure 3 (c), both the firm and industry in the perfect competition have been
illustrated. It is seen that the industry fixes P as the market price with the help of demand and
supply of the industry. Thus, the firm’s equilibrium price is at P1, resulting in the firm to
maximize its profit at the point where MC is equal to MR and the equilibrium quantity is at
Q1.
Response to question 5
Difference between income elasticity of demand and price elasticity of demand
Price Elasticity of demand
As per Bohi (2013), the proportionate change in quantity demanded to the
proportionate price change refers to the price elasticity of demand.
Price Elasticity of Demand= proportionate change∈demand for quantity ÷ propotionate price change
11MICROECONOMICS AND MACROECONOMICS
Example- Suppose pizza cost changed to 22 USD from 20 USD and the demand for the
quantity of pizza falls to 77 from 100.
Then the price elasticity of demand= ((-23/100)*100)/ ((2/20)*100)
=-(23/10)
=-1.3
Income Elasticity of demand
The income elasticity of demand determines the change in demand for the quantity to
the individuals’ income change.
Income Elasticity of Demand =ratio of change ∈quantity demanded ÷ratio of income change of individuals '
For Instance: Suppose the incomes of an individual falls to 4000 USD. His initial income was
6000 USD. Thus, the demand for the quantity decreases from 500 units to 400 units.
Therefore Income elasticity of demand= ((100/500)*100)/((2000/6000)*100)
= 0.6
Cross Price Elasticity of demand
When there is a demand change for the quantity of the first product due to the
proportionate change in the price of the other product, then that ratio is measured by cross
elasticity of demand.
Numerical Example- If the petrol price increases by 20 per cent for which the vehicle demand
falls to 30 per cent then income elasticity of demand= -30/20
=3/2
=1.5
⊘ This is a preview!⊘
Do you want full access?
Subscribe today to unlock all pages.
Trusted by 1+ million students worldwide
1 out of 22
Related Documents


Your All-in-One AI-Powered Toolkit for Academic Success.
+13062052269
info@desklib.com
Available 24*7 on WhatsApp / Email
![[object Object]](/_next/static/media/star-bottom.7253800d.svg)
Unlock your academic potential
Copyright © 2020–2026 A2Z Services. All Rights Reserved. Developed and managed by ZUCOL.