An Analysis of Demand and Supply for Polo Mints in the UK Market
VerifiedAdded on 2020/10/05
|13
|3022
|93
Report
AI Summary
This report provides a detailed analysis of the demand and supply dynamics of Polo Mints in the UK market, applying economic principles to understand pricing and market behavior. The report begins with an introduction to business economics, highlighting its application in analyzing factors affecting firms. It then explores the concept of static economics, comparative statics, and how they relate to the pricing of commodities. The main body of the report focuses on the demand and supply analysis of Polo Mints, examining factors that influence demand and supply curves, such as income, taste, and price. The report also discusses the Law of Demand and the Law of Supply, illustrating their impact on the market. Diagrams are used to represent the equilibrium point, shifts in demand and supply curves, and the relationship between price and quantity. The report also highlights the importance of understanding consumer behavior and how changes in market conditions can affect the demand for Polo Mints. The conclusion summarizes the key findings and implications of the analysis.
ECONOMICS
FOR
BUSINESS
FOR
BUSINESS
Paraphrase This Document
Need a fresh take? Get an instant paraphrase of this document with our AI Paraphraser
Table of Contents
INTRODUCTION...........................................................................................................................1
MAIN BODY...................................................................................................................................1
CONCLUSION..............................................................................................................................10
REFERENCES..............................................................................................................................11
INTRODUCTION
Business economics is a field which is applied economics to uses economic theory and
quantitative methods to determine business corporation and their factors (Bonilla, Merigó and
Torres-Abad, 2015) . These elements are contributing to the diversity of organizational structures
and the relationships of firms with labour, capital and product markets. It is also known as
managerial economics which can help to decision making process to selecting one out of two or
more optional plan of action. The report going to present demand and supply analysis of polo
mints. There are selected company Polo mint, which is a brand of breath mint whose describing
as a feature of hole in the middle. It is firstly manufactured by employee John Barge-well at the
Rowntree's factory in 1948, United kingdom. In the report focused on demand and supply
analysis to identify main factors which can determine the prices of polo mints in the UK.
MAIN BODY
In economics, the concept of static states to a situation where there is a movement. But
this movement is continuous, definite, day-to-day and constant and it can not deal with the
unexpected changes because of focus on expected economic studies. Comparative statics is
defines as the comparison of two different economic outcomes which shows change before and
after in some underlying exogenous parameters. These changes show by diagrams to provide
clear picture of Polo mint and it can also show demand and supply proper way with the help of
diagram. The static analysis will compare two different equilibrium states, after the process of
adjustments. For example – when the demand as well as supply of milk is 25 Ltr, price is two Ltr
after than assume that demand of milk increase by 5 Ltr while supply remains the same. So it
will affect to price of milk increase to 3 per Ltr.
According to Prof. Stigler, static economic analysis is an economy which can not change
according to resources, taste and technology. The pricing of commodities is an important
example of static economy. There are supposing that the price is determined by the forces of
demand and supply which belong to equal time period, price, demand and supply refer to the
same time period. There are determining of demand and supply which can suppose to be constant
in static economics. Under perfect competition, price is analogising by to factors of demand and
supply (Benavides-Velasco, Quintana-García. and Guzmán-Parra, 2013). This analysis of pricing
is related to economic statics. It can explain through static economic analysis -
1
⊘ This is a preview!⊘
Do you want full access?
Subscribe today to unlock all pages.
Trusted by 1+ million students worldwide
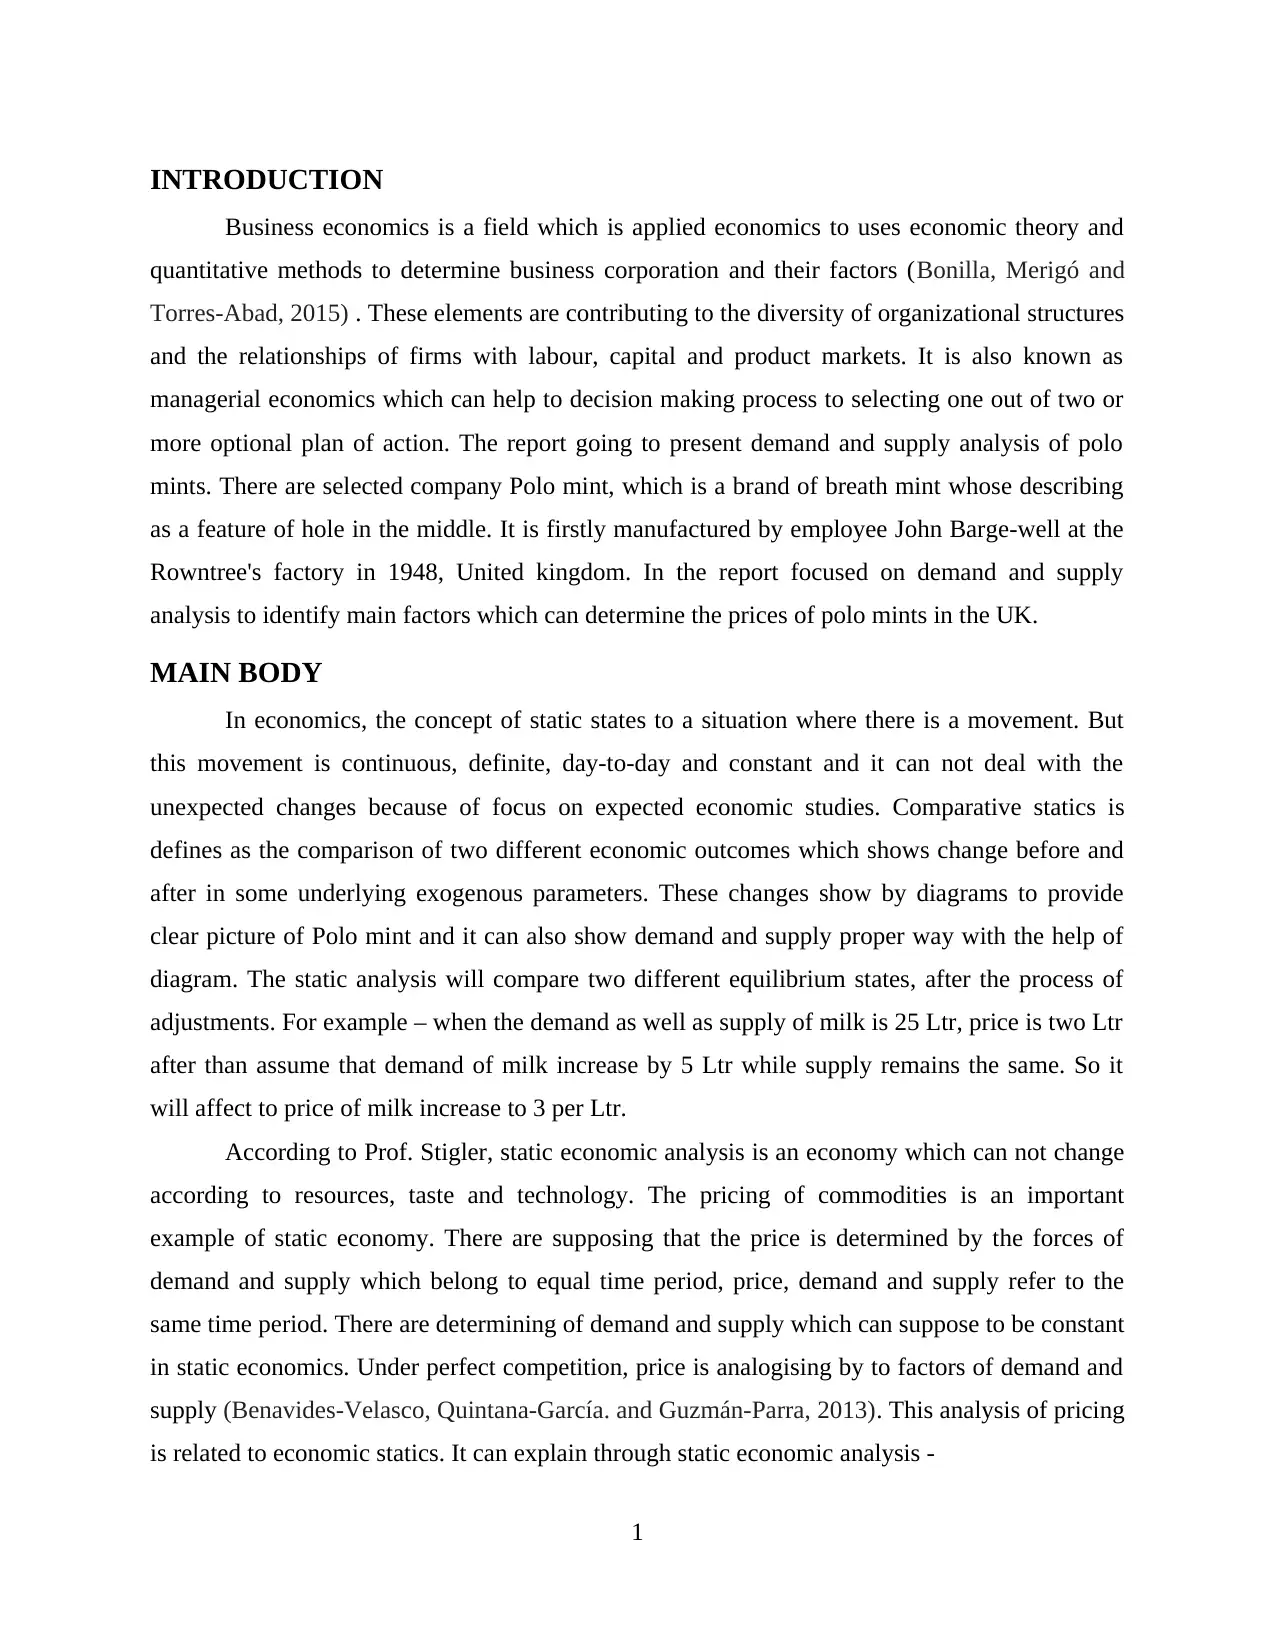
In the presented diagram DD shows as the market demand curve ans SS can shows the
market supply curve. The point of E shows that the quantity demanded and supplied is equal to
OM. The price OP is analysed by the interaction of the forces of demand and supply. According
to diagram present demand, supply and piece states to the same time period and static economic
analysis which is also known as timeless economic analysis. There are prof. Clark has pointed
out the features of a static economy. These are – (1) There are no change in the population and
their composition. (2) No changes coming in the quantity of capital. (3) Production techniques
can not change.
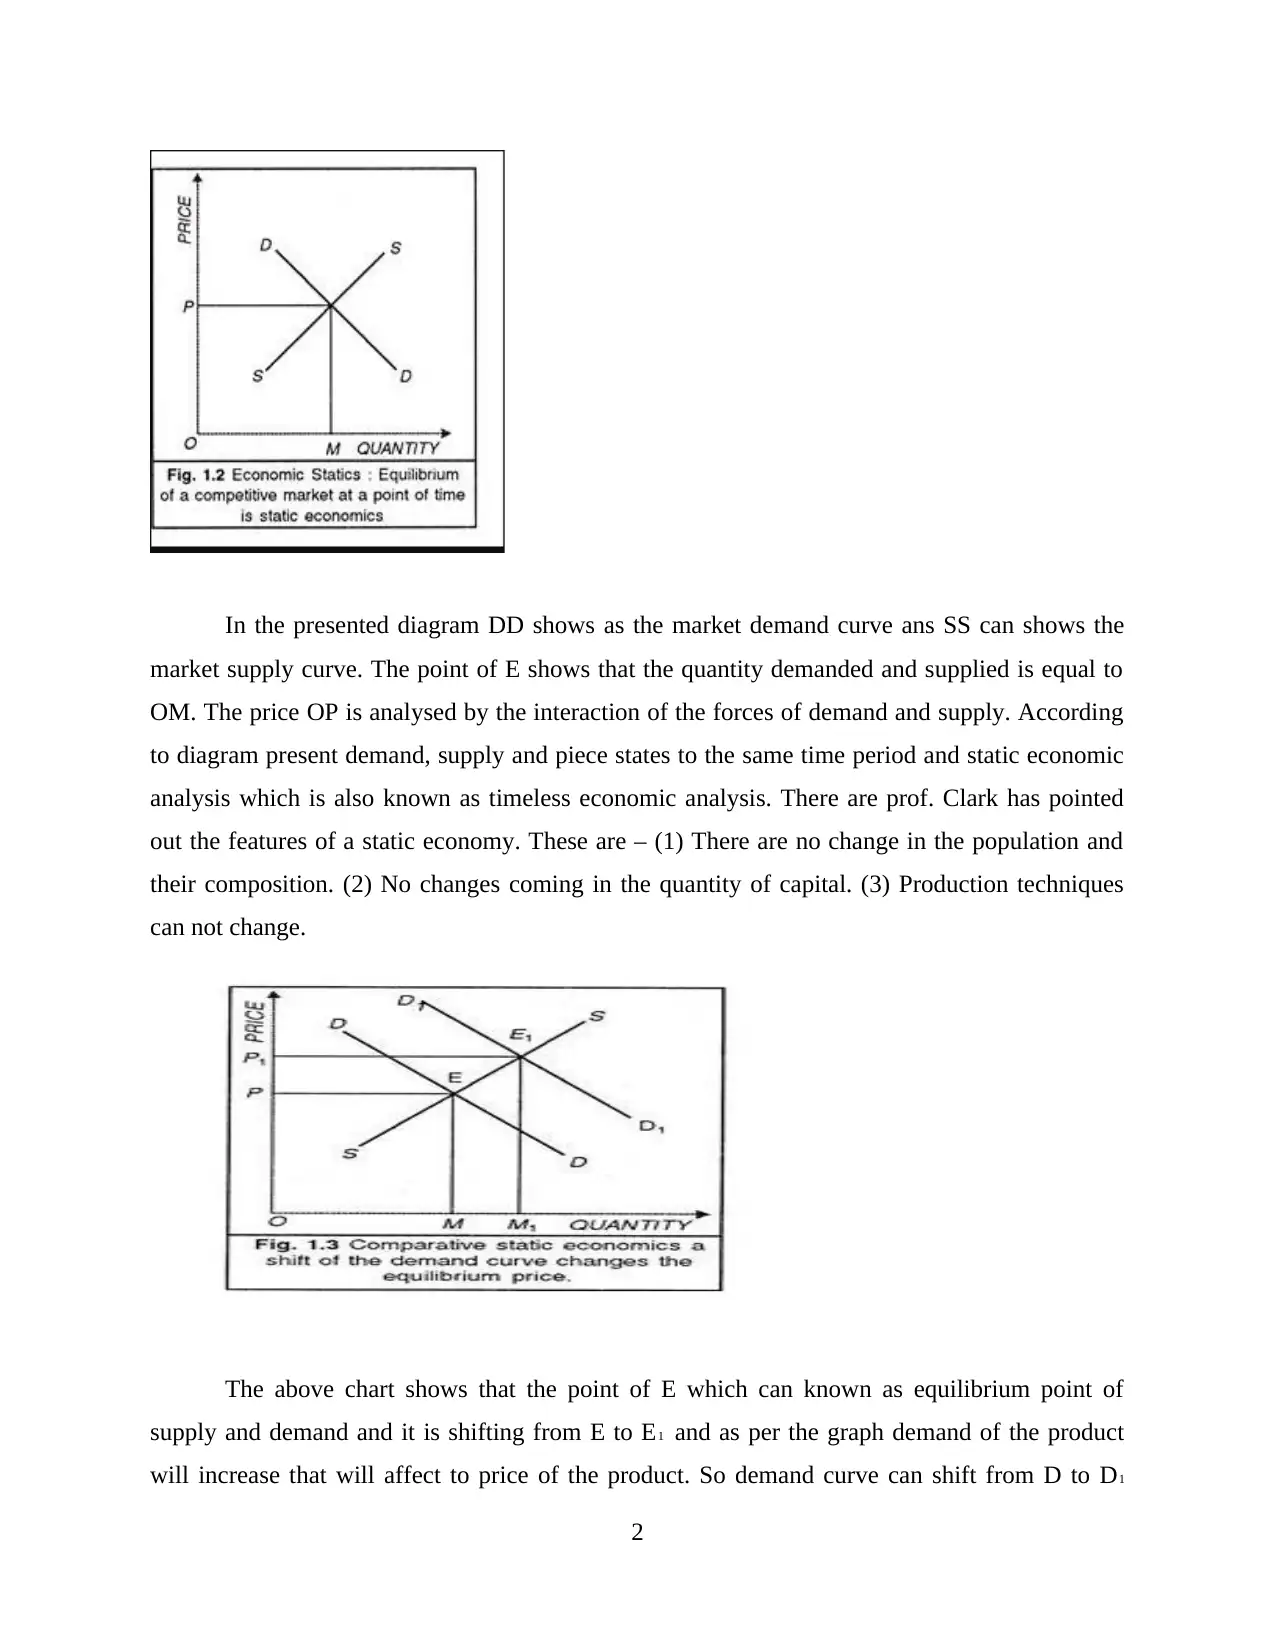
The above chart shows that the point of E which can known as equilibrium point of
supply and demand and it is shifting from E to E1 and as per the graph demand of the product
will increase that will affect to price of the product. So demand curve can shift from D to D1
2
market supply curve. The point of E shows that the quantity demanded and supplied is equal to
OM. The price OP is analysed by the interaction of the forces of demand and supply. According
to diagram present demand, supply and piece states to the same time period and static economic
analysis which is also known as timeless economic analysis. There are prof. Clark has pointed
out the features of a static economy. These are – (1) There are no change in the population and
their composition. (2) No changes coming in the quantity of capital. (3) Production techniques
can not change.
The above chart shows that the point of E which can known as equilibrium point of
supply and demand and it is shifting from E to E1 and as per the graph demand of the product
will increase that will affect to price of the product. So demand curve can shift from D to D1
2
Paraphrase This Document
Need a fresh take? Get an instant paraphrase of this document with our AI Paraphraser
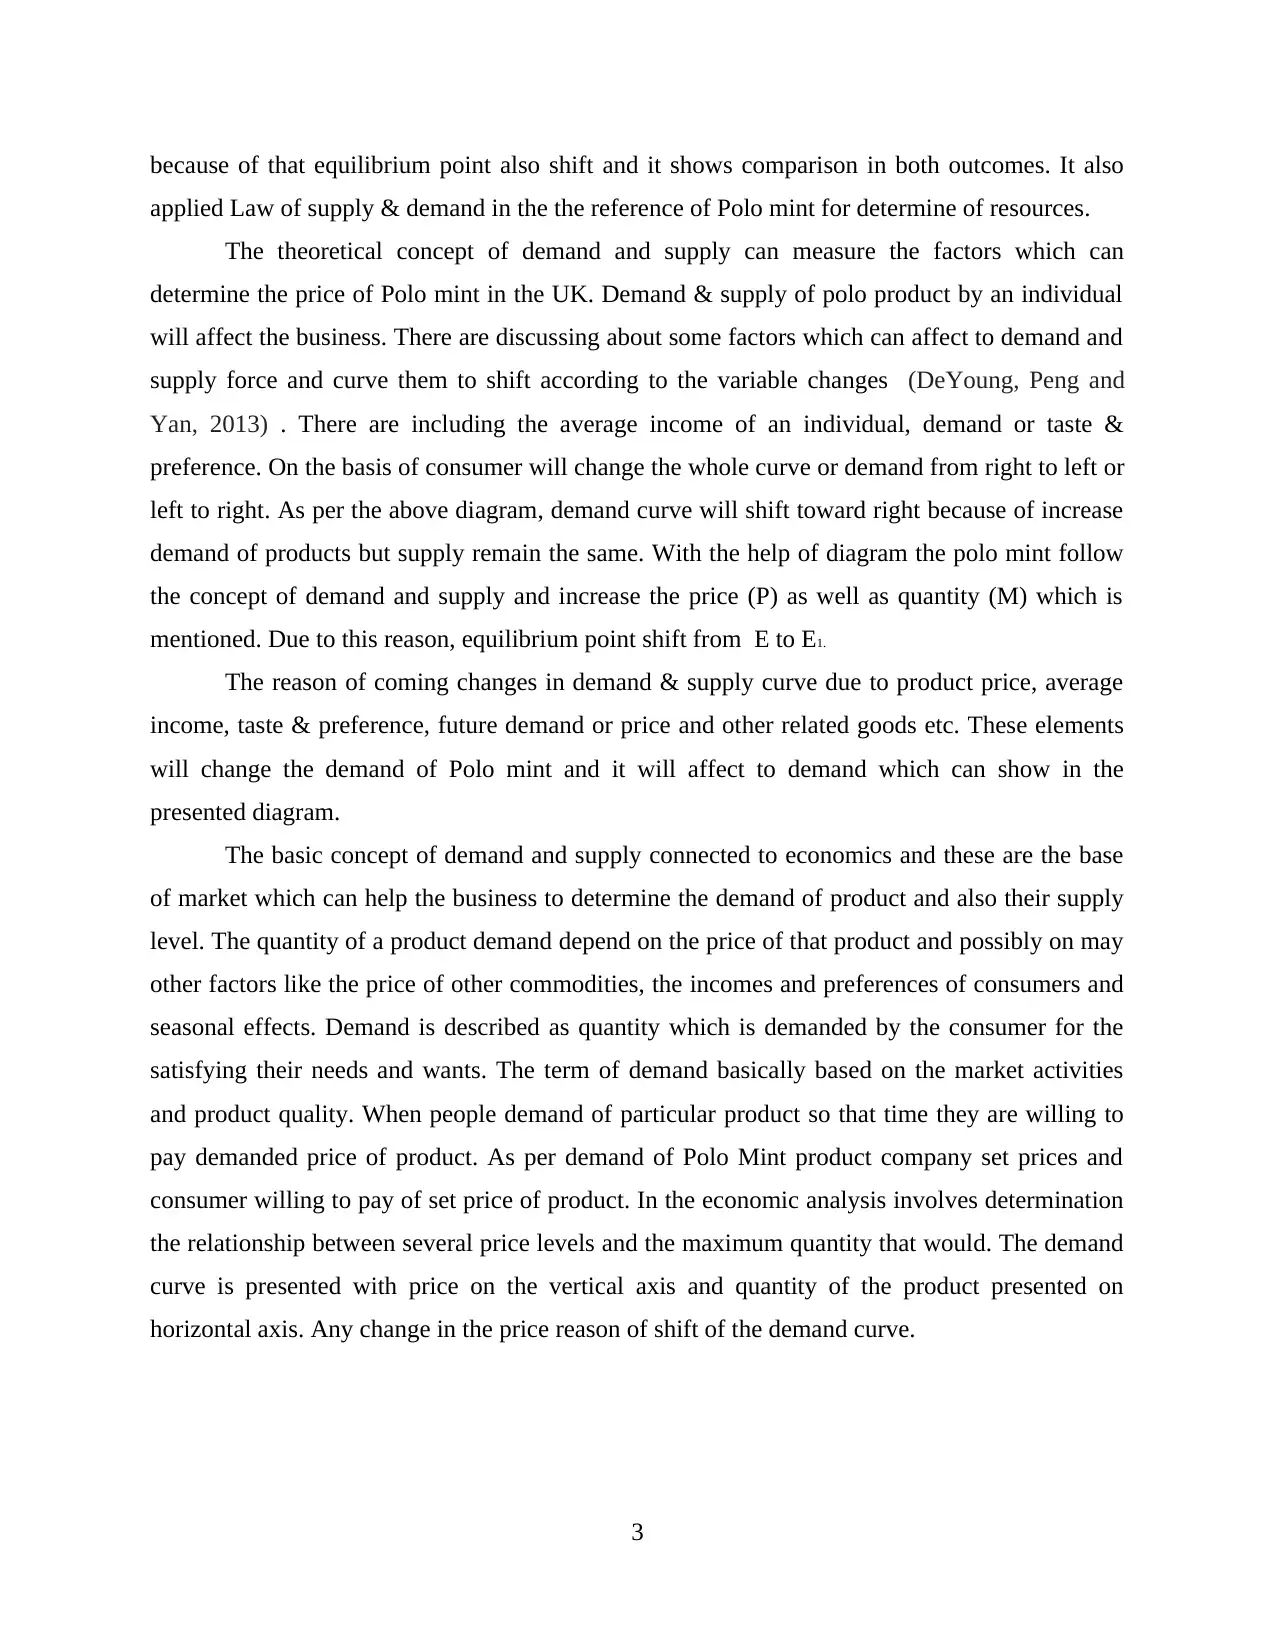
because of that equilibrium point also shift and it shows comparison in both outcomes. It also
applied Law of supply & demand in the the reference of Polo mint for determine of resources.
The theoretical concept of demand and supply can measure the factors which can
determine the price of Polo mint in the UK. Demand & supply of polo product by an individual
will affect the business. There are discussing about some factors which can affect to demand and
supply force and curve them to shift according to the variable changes (DeYoung, Peng and
Yan, 2013) . There are including the average income of an individual, demand or taste &
preference. On the basis of consumer will change the whole curve or demand from right to left or
left to right. As per the above diagram, demand curve will shift toward right because of increase
demand of products but supply remain the same. With the help of diagram the polo mint follow
the concept of demand and supply and increase the price (P) as well as quantity (M) which is
mentioned. Due to this reason, equilibrium point shift from E to E1.
The reason of coming changes in demand & supply curve due to product price, average
income, taste & preference, future demand or price and other related goods etc. These elements
will change the demand of Polo mint and it will affect to demand which can show in the
presented diagram.
The basic concept of demand and supply connected to economics and these are the base
of market which can help the business to determine the demand of product and also their supply
level. The quantity of a product demand depend on the price of that product and possibly on may
other factors like the price of other commodities, the incomes and preferences of consumers and
seasonal effects. Demand is described as quantity which is demanded by the consumer for the
satisfying their needs and wants. The term of demand basically based on the market activities
and product quality. When people demand of particular product so that time they are willing to
pay demanded price of product. As per demand of Polo Mint product company set prices and
consumer willing to pay of set price of product. In the economic analysis involves determination
the relationship between several price levels and the maximum quantity that would. The demand
curve is presented with price on the vertical axis and quantity of the product presented on
horizontal axis. Any change in the price reason of shift of the demand curve.
3
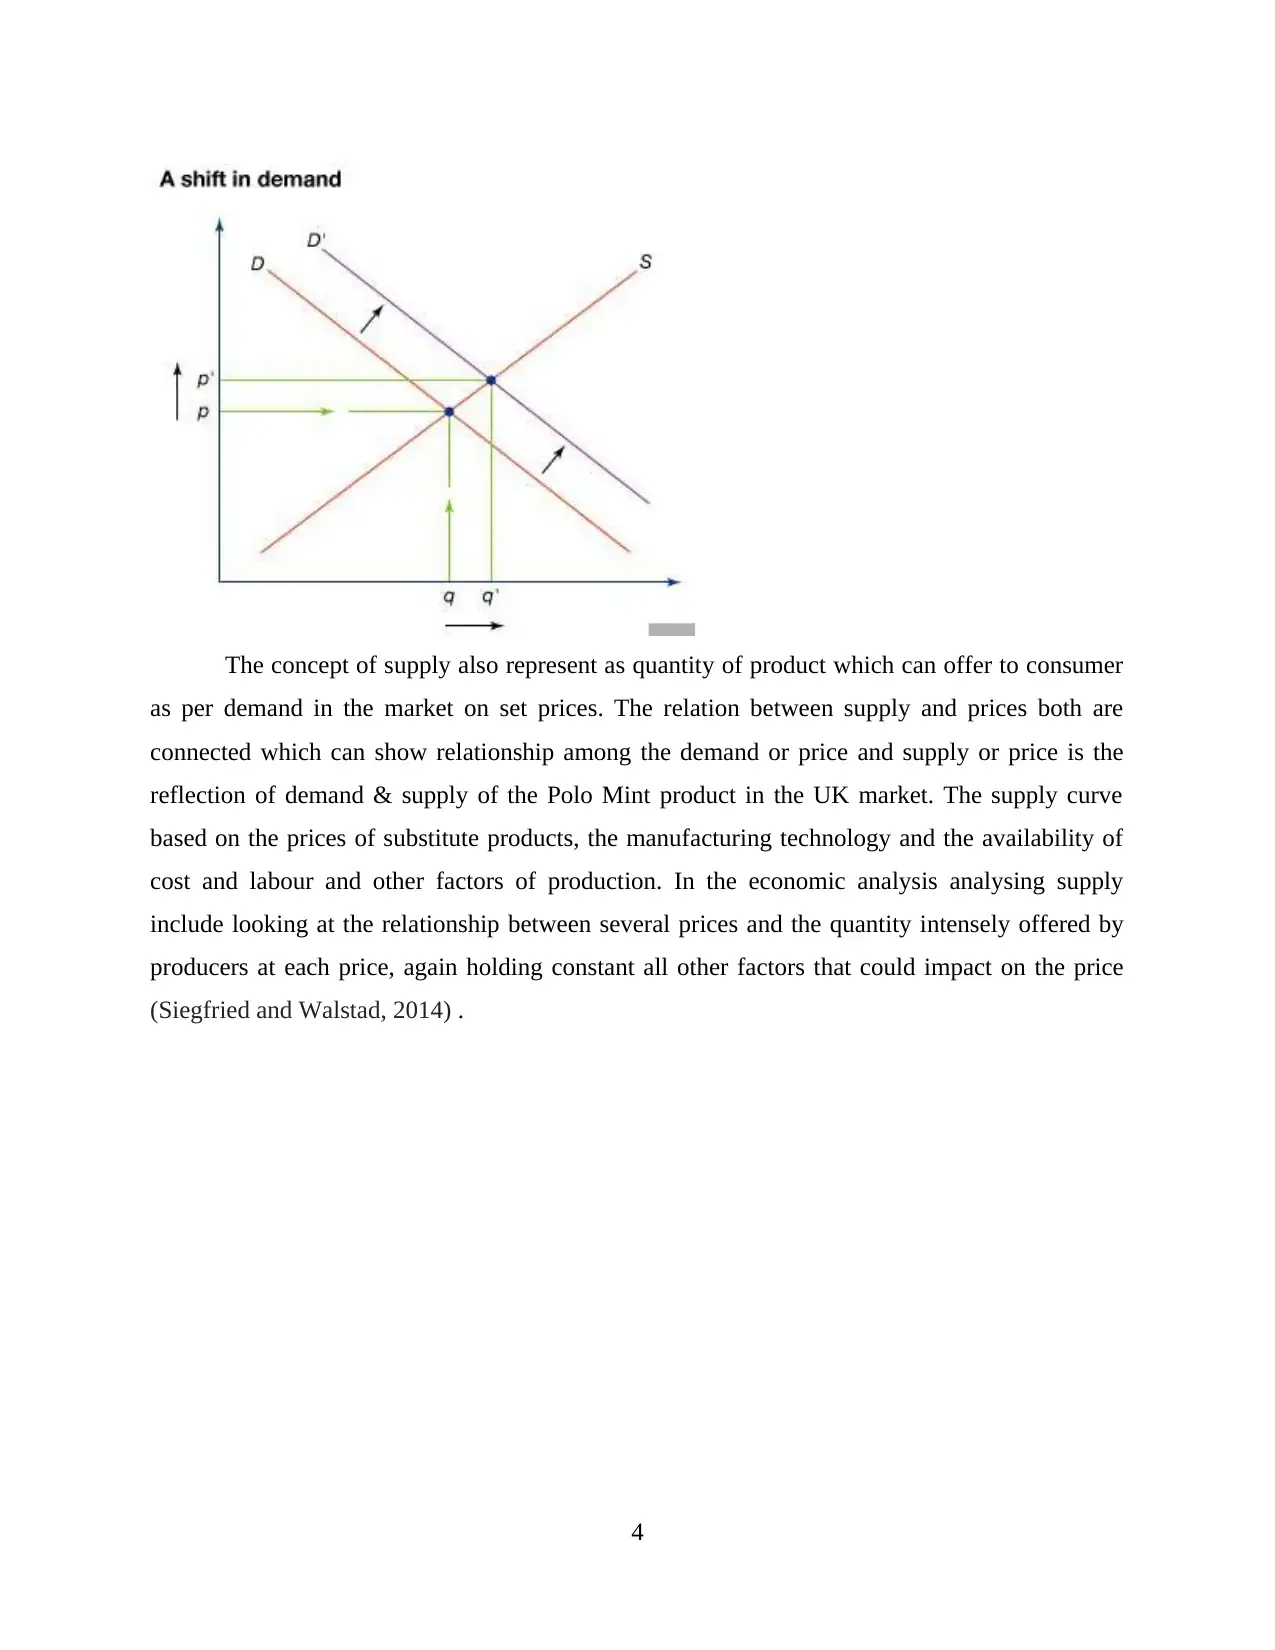
The concept of supply also represent as quantity of product which can offer to consumer
as per demand in the market on set prices. The relation between supply and prices both are
connected which can show relationship among the demand or price and supply or price is the
reflection of demand & supply of the Polo Mint product in the UK market. The supply curve
based on the prices of substitute products, the manufacturing technology and the availability of
cost and labour and other factors of production. In the economic analysis analysing supply
include looking at the relationship between several prices and the quantity intensely offered by
producers at each price, again holding constant all other factors that could impact on the price
(Siegfried and Walstad, 2014) .
4
⊘ This is a preview!⊘
Do you want full access?
Subscribe today to unlock all pages.
Trusted by 1+ million students worldwide
Demand & supply theories will help in allocating resources and use them in the most
suitable way. For this it required to discuss the Law of Demand & Law of Supply and it will be
discuss below:
Law of demand stated that, when all factors still equal than higher price of product will
reason and the less demand among the consumers. In addition, price of the high product will
decrease the demand of product while low price of product increase the demand of product. So I
will represents negative relationship between the price and demand. For example – when the
price of polo mint has been increased so it will affect the demand of polo mint as decrease the
demand of product. The price and demand between have negative relation one factor is
increasing so another factor decrease. If decrease the price of Polo mint so automatically increase
demand of Polo mint in among the children. When people can not afford any product so they are
switching on other product which is as usual to last product (Small, 2013) .
5
Paraphrase This Document
Need a fresh take? Get an instant paraphrase of this document with our AI Paraphraser
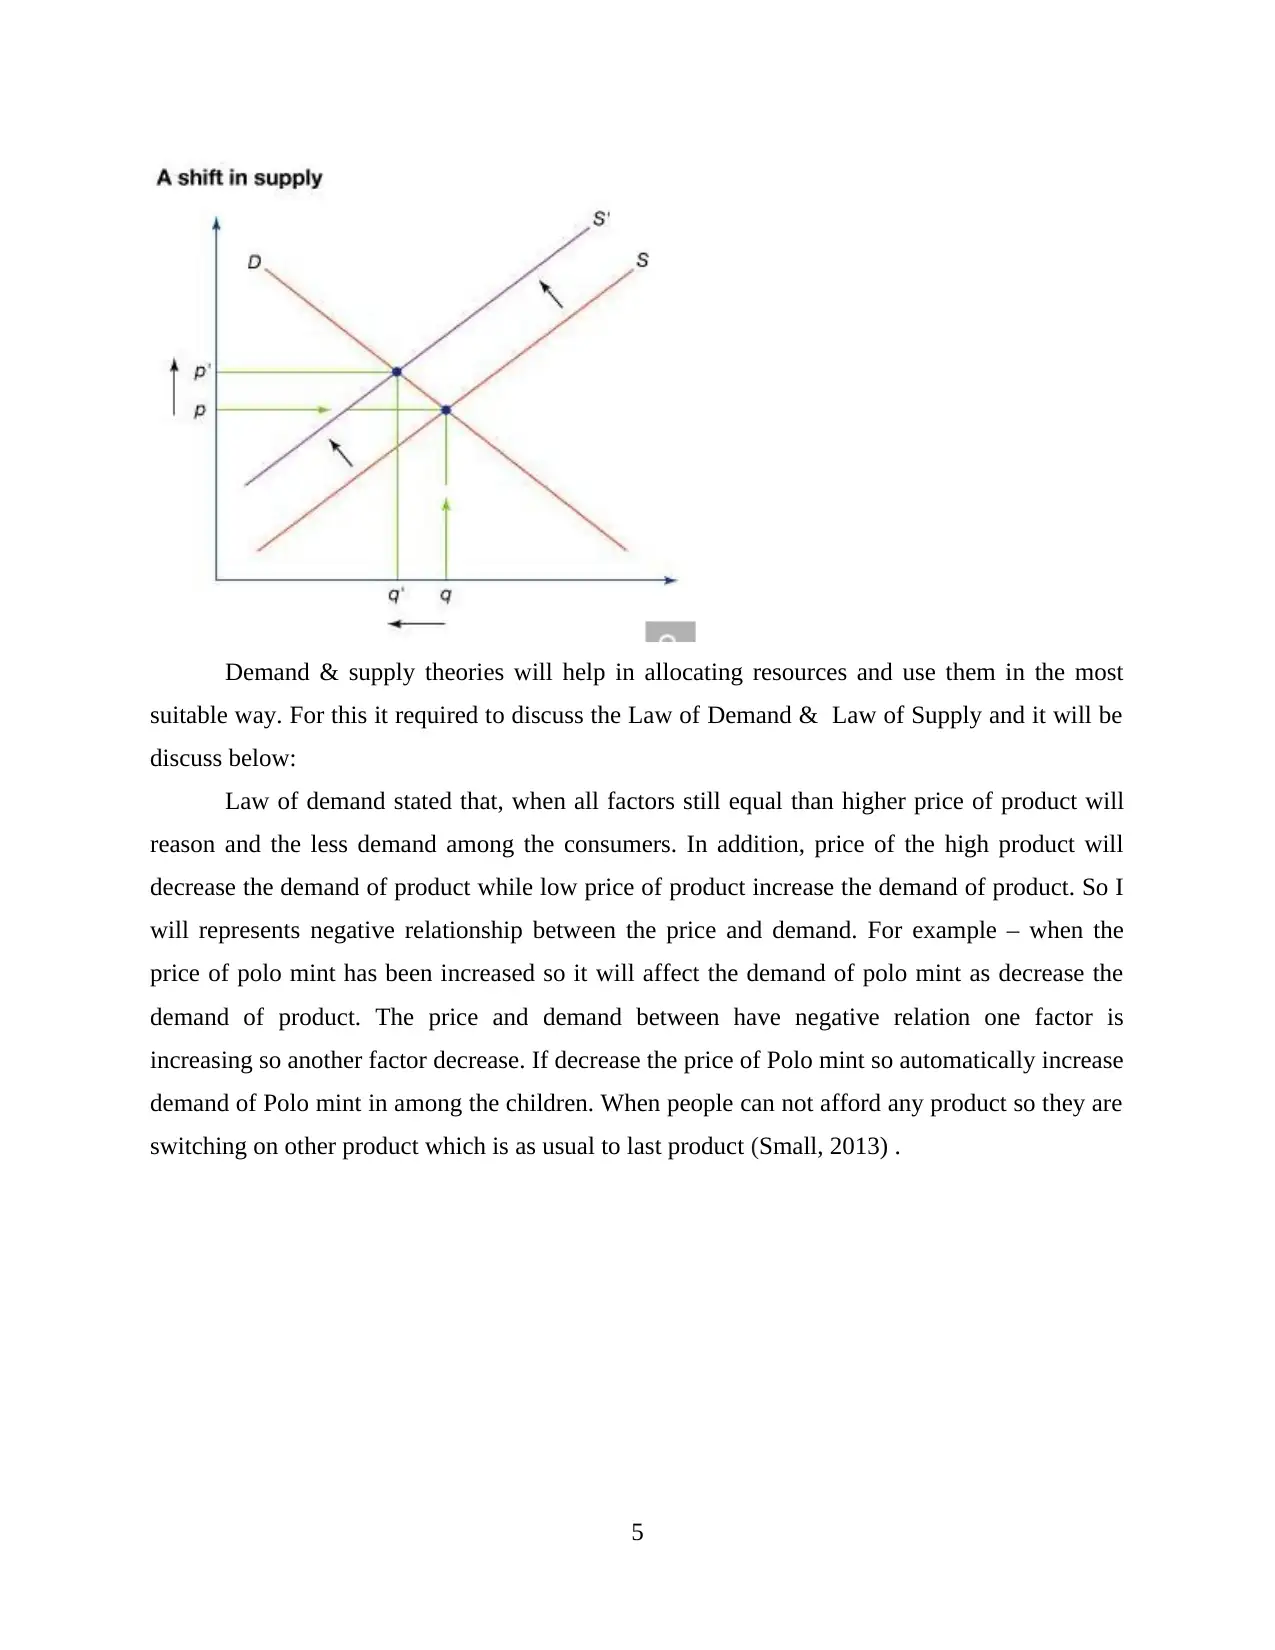
As per the above diagram resent relationship between price and demand but is based on
negative way it means when the price increase that time demand decrease. According to diagram
higher price of product will represent lower demand as well as low price will generate more
demand in the market. There is price of the product denotes as P and Quantity of the products
which is demanded by customer denotes as Q and there are Demand curve denotes as D.
Demand curve represents the relationship between price and quantity through the points as A, B,
C. These particular points shows combinations in between price of the product and demand of
the product. Demand curve show the opposite or negative interaction of price and quantity for
the each other. The point A indicates the high price and low quantity which is demanded by the
consumers and in point C indicates the low product price & high demand in term of quantity.
The relationship of piece and quantity will be shown in the downward directions same as
represent in above diagram (Stevenson and et.al, 2012).
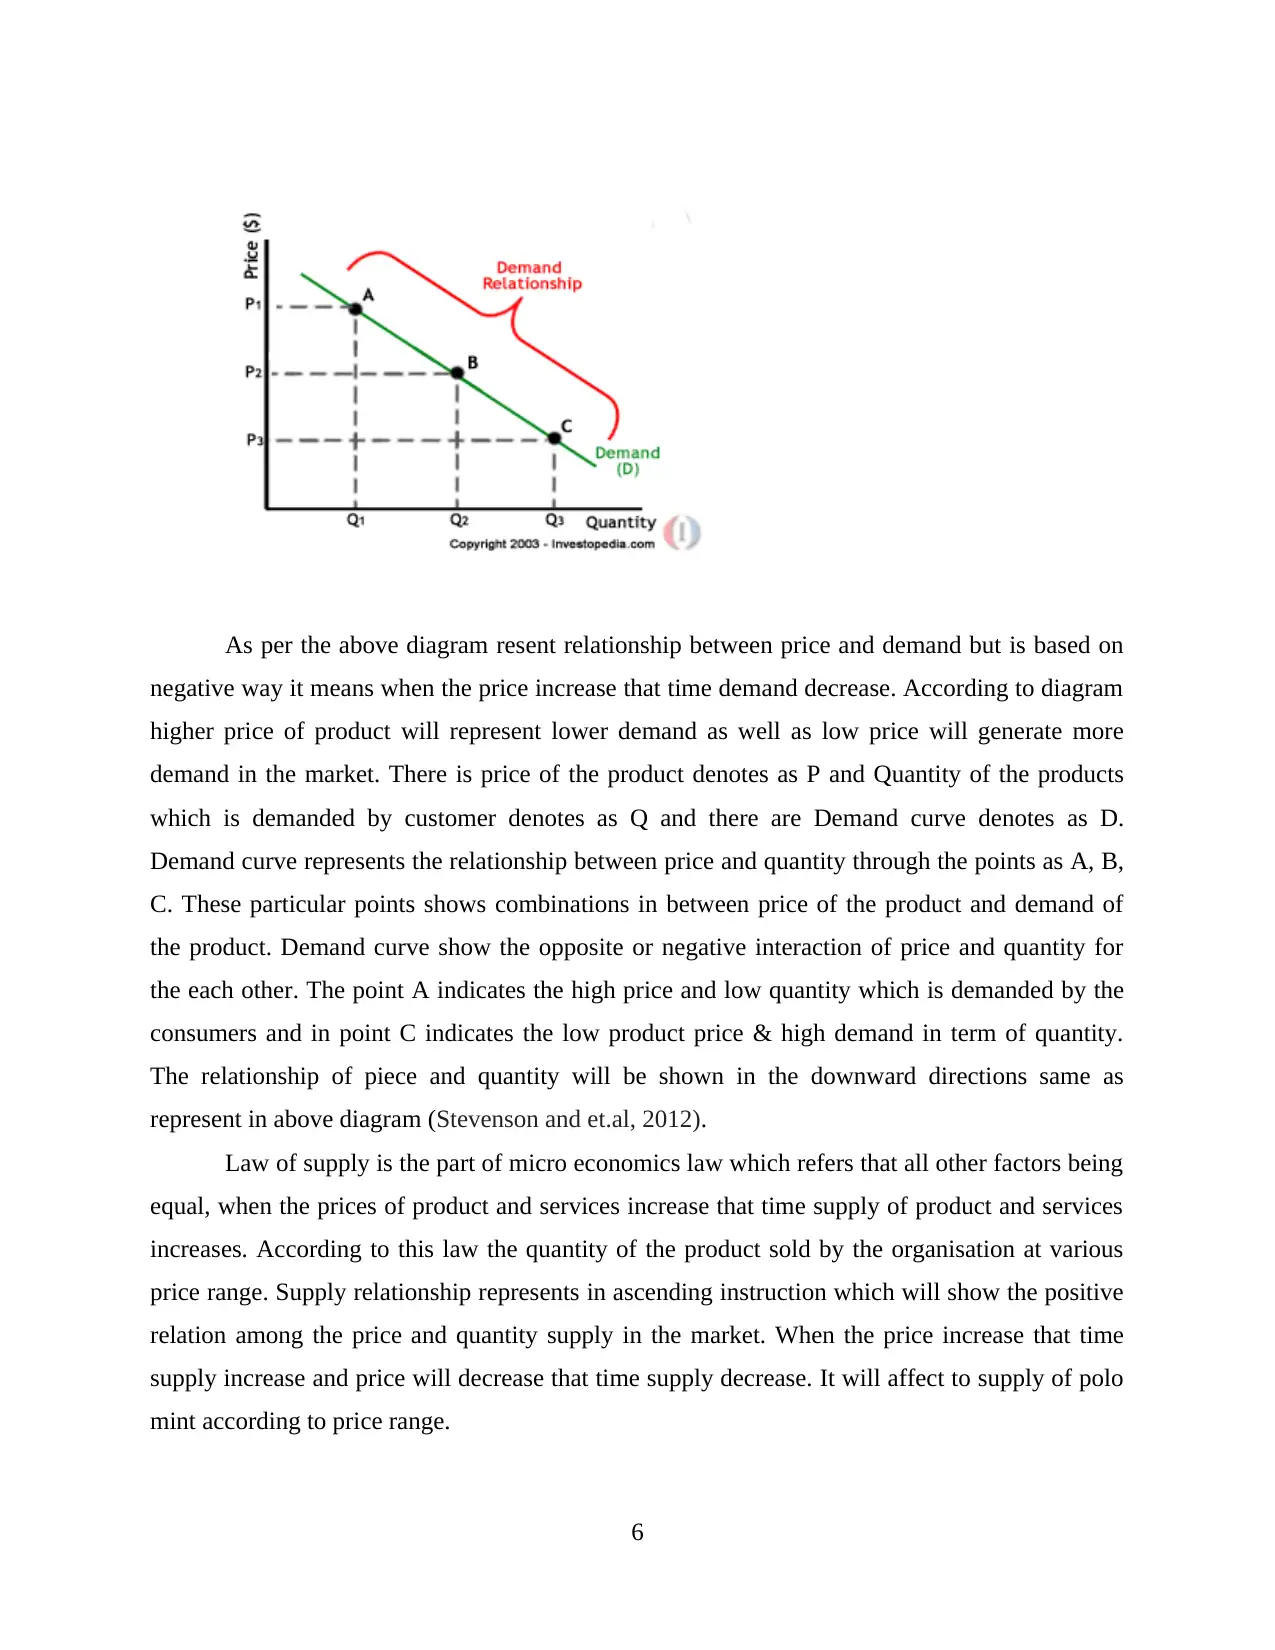
Law of supply is the part of micro economics law which refers that all other factors being
equal, when the prices of product and services increase that time supply of product and services
increases. According to this law the quantity of the product sold by the organisation at various
price range. Supply relationship represents in ascending instruction which will show the positive
relation among the price and quantity supply in the market. When the price increase that time
supply increase and price will decrease that time supply decrease. It will affect to supply of polo
mint according to price range.
6
negative way it means when the price increase that time demand decrease. According to diagram
higher price of product will represent lower demand as well as low price will generate more
demand in the market. There is price of the product denotes as P and Quantity of the products
which is demanded by customer denotes as Q and there are Demand curve denotes as D.
Demand curve represents the relationship between price and quantity through the points as A, B,
C. These particular points shows combinations in between price of the product and demand of
the product. Demand curve show the opposite or negative interaction of price and quantity for
the each other. The point A indicates the high price and low quantity which is demanded by the
consumers and in point C indicates the low product price & high demand in term of quantity.
The relationship of piece and quantity will be shown in the downward directions same as
represent in above diagram (Stevenson and et.al, 2012).
Law of supply is the part of micro economics law which refers that all other factors being
equal, when the prices of product and services increase that time supply of product and services
increases. According to this law the quantity of the product sold by the organisation at various
price range. Supply relationship represents in ascending instruction which will show the positive
relation among the price and quantity supply in the market. When the price increase that time
supply increase and price will decrease that time supply decrease. It will affect to supply of polo
mint according to price range.
6
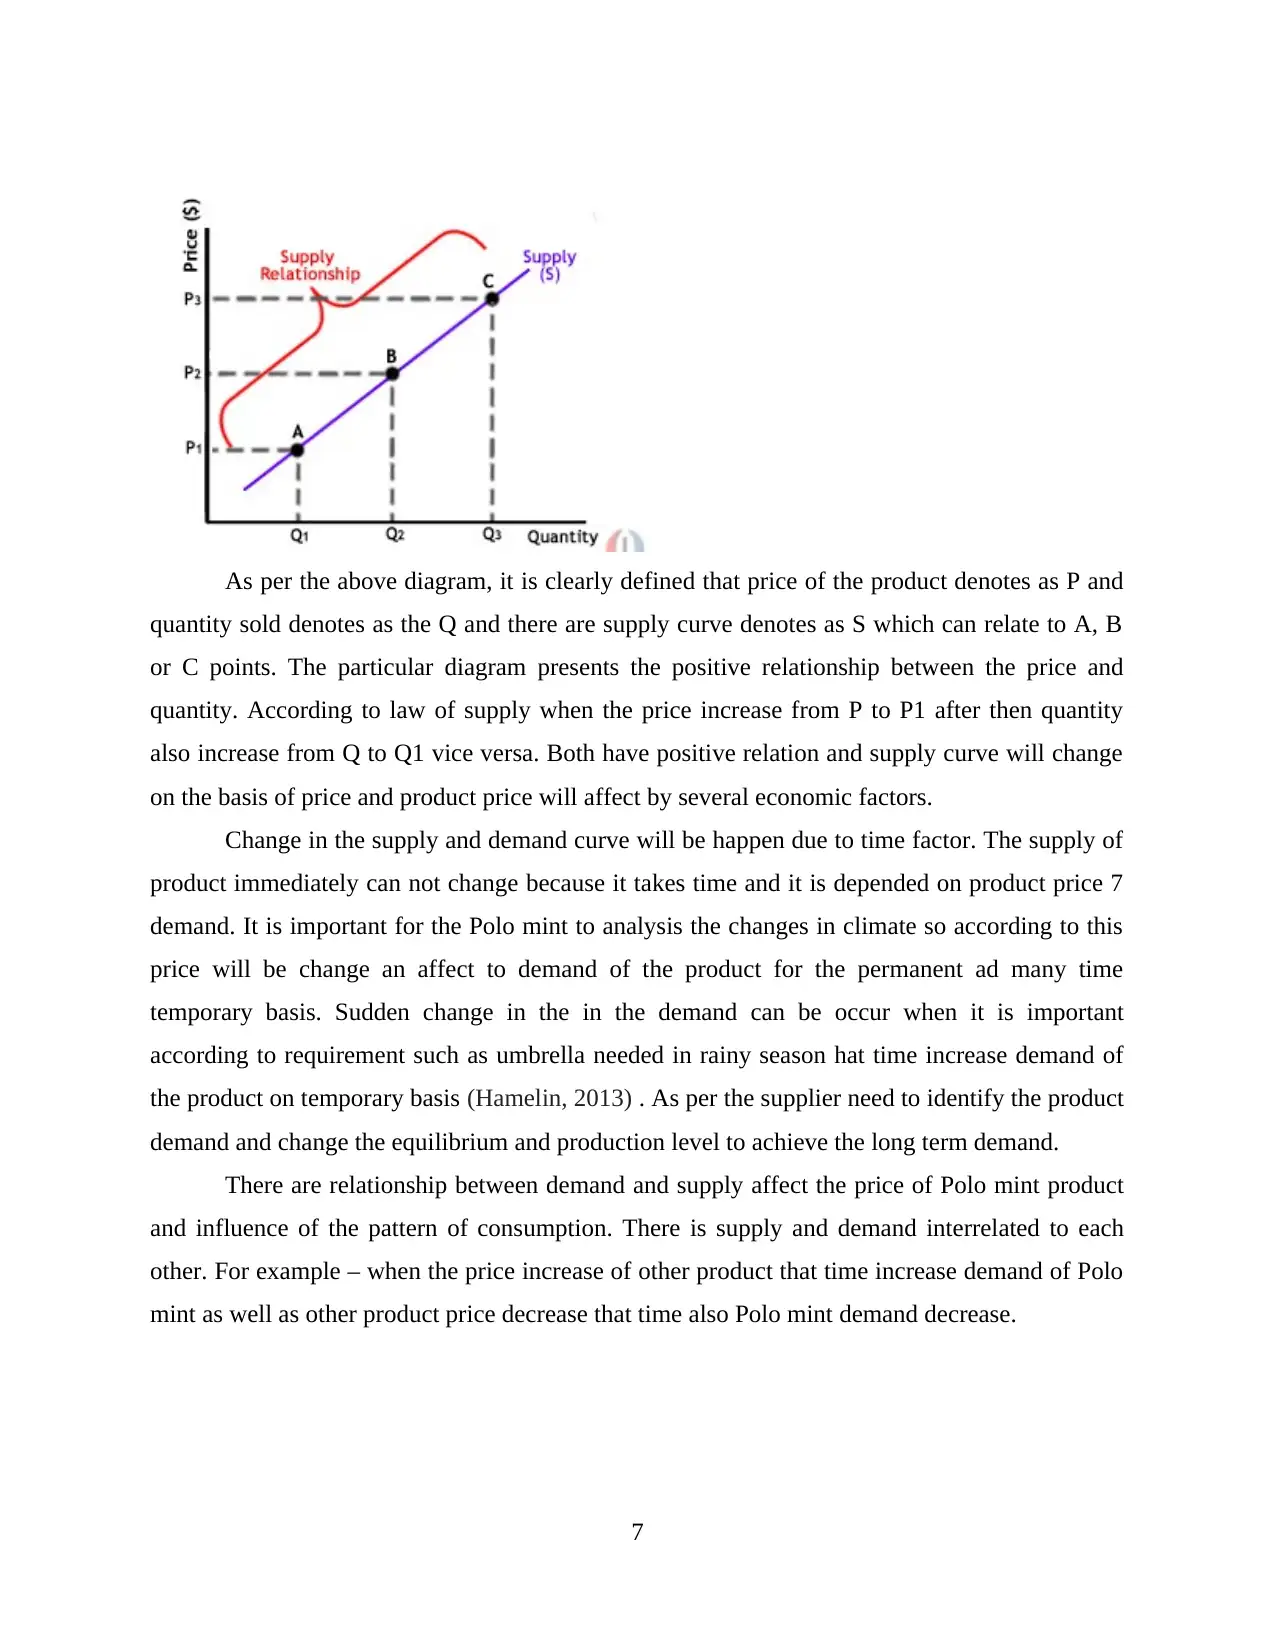
As per the above diagram, it is clearly defined that price of the product denotes as P and
quantity sold denotes as the Q and there are supply curve denotes as S which can relate to A, B
or C points. The particular diagram presents the positive relationship between the price and
quantity. According to law of supply when the price increase from P to P1 after then quantity
also increase from Q to Q1 vice versa. Both have positive relation and supply curve will change
on the basis of price and product price will affect by several economic factors.
Change in the supply and demand curve will be happen due to time factor. The supply of
product immediately can not change because it takes time and it is depended on product price 7
demand. It is important for the Polo mint to analysis the changes in climate so according to this
price will be change an affect to demand of the product for the permanent ad many time
temporary basis. Sudden change in the in the demand can be occur when it is important
according to requirement such as umbrella needed in rainy season hat time increase demand of
the product on temporary basis (Hamelin, 2013) . As per the supplier need to identify the product
demand and change the equilibrium and production level to achieve the long term demand.
There are relationship between demand and supply affect the price of Polo mint product
and influence of the pattern of consumption. There is supply and demand interrelated to each
other. For example – when the price increase of other product that time increase demand of Polo
mint as well as other product price decrease that time also Polo mint demand decrease.
7
⊘ This is a preview!⊘
Do you want full access?
Subscribe today to unlock all pages.
Trusted by 1+ million students worldwide
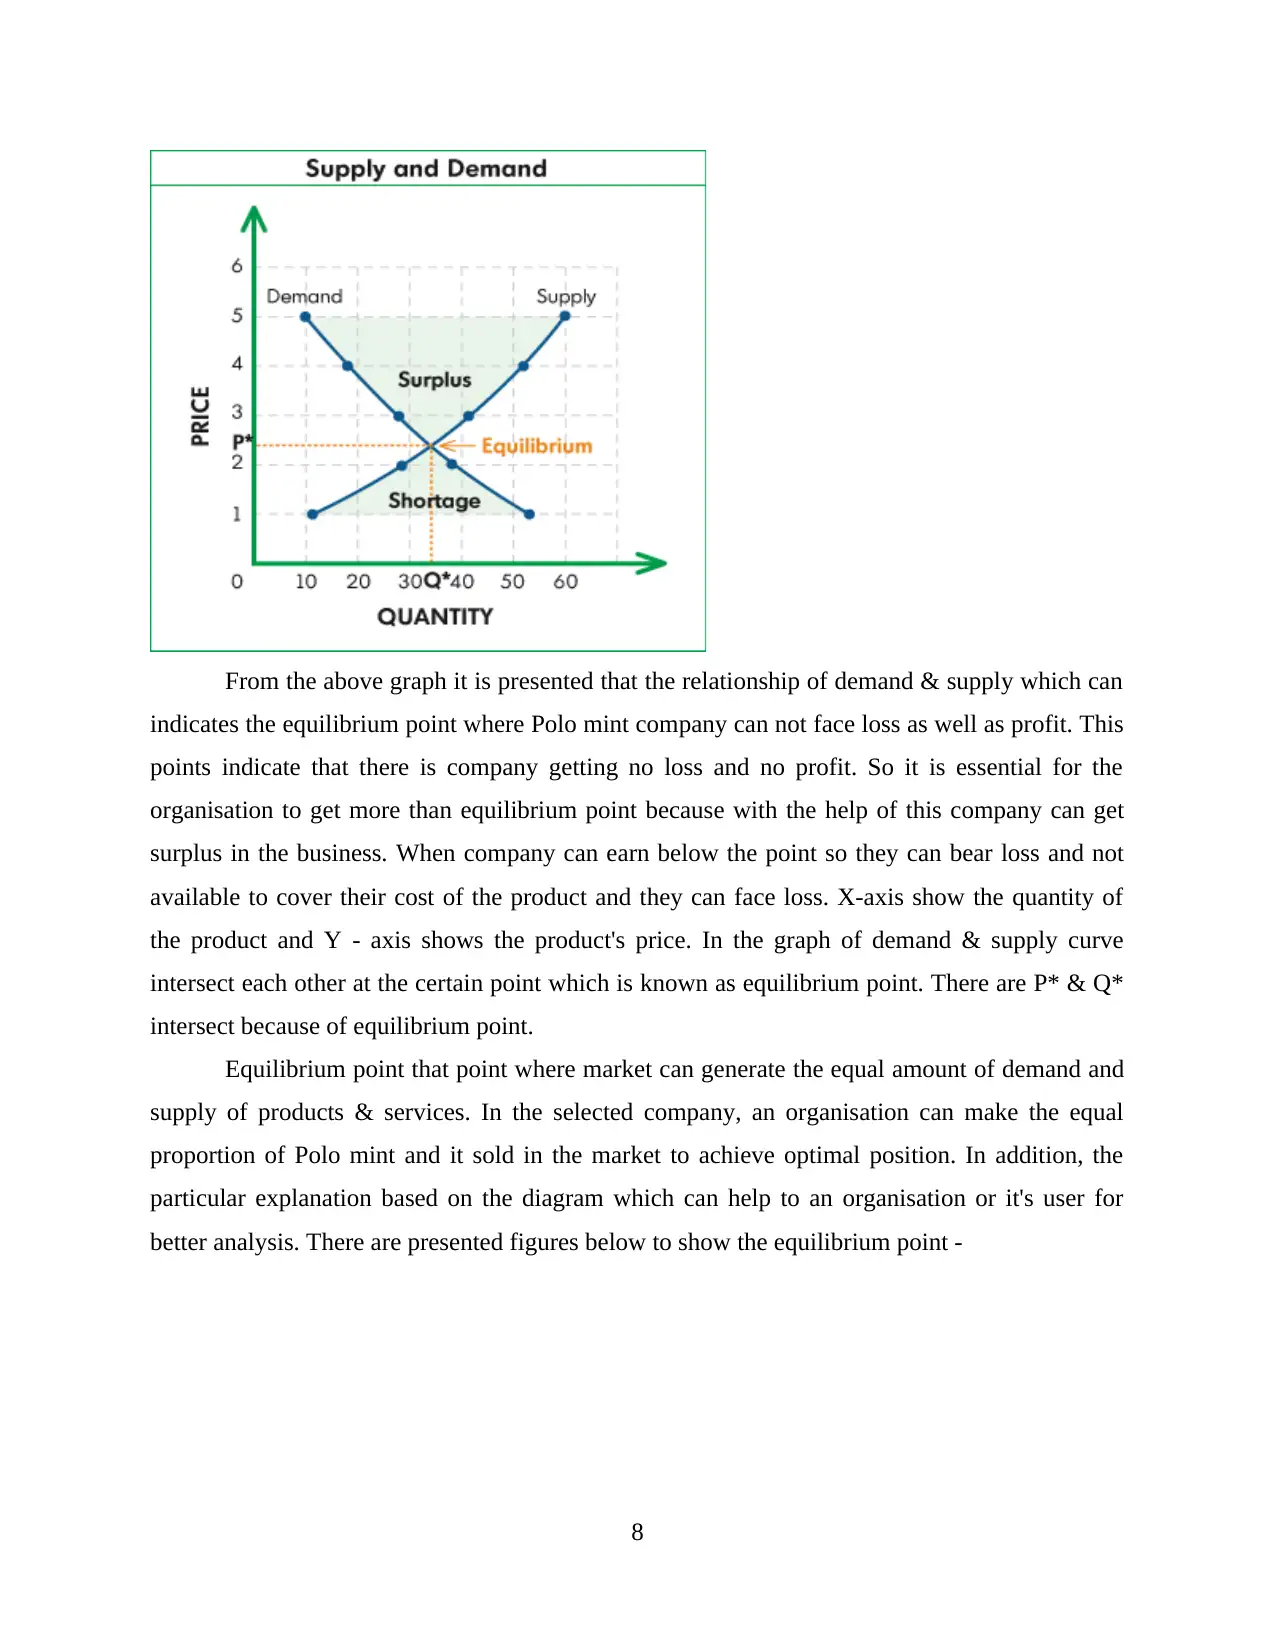
From the above graph it is presented that the relationship of demand & supply which can
indicates the equilibrium point where Polo mint company can not face loss as well as profit. This
points indicate that there is company getting no loss and no profit. So it is essential for the
organisation to get more than equilibrium point because with the help of this company can get
surplus in the business. When company can earn below the point so they can bear loss and not
available to cover their cost of the product and they can face loss. X-axis show the quantity of
the product and Y - axis shows the product's price. In the graph of demand & supply curve
intersect each other at the certain point which is known as equilibrium point. There are P* & Q*
intersect because of equilibrium point.
Equilibrium point that point where market can generate the equal amount of demand and
supply of products & services. In the selected company, an organisation can make the equal
proportion of Polo mint and it sold in the market to achieve optimal position. In addition, the
particular explanation based on the diagram which can help to an organisation or it's user for
better analysis. There are presented figures below to show the equilibrium point -
8
Paraphrase This Document
Need a fresh take? Get an instant paraphrase of this document with our AI Paraphraser
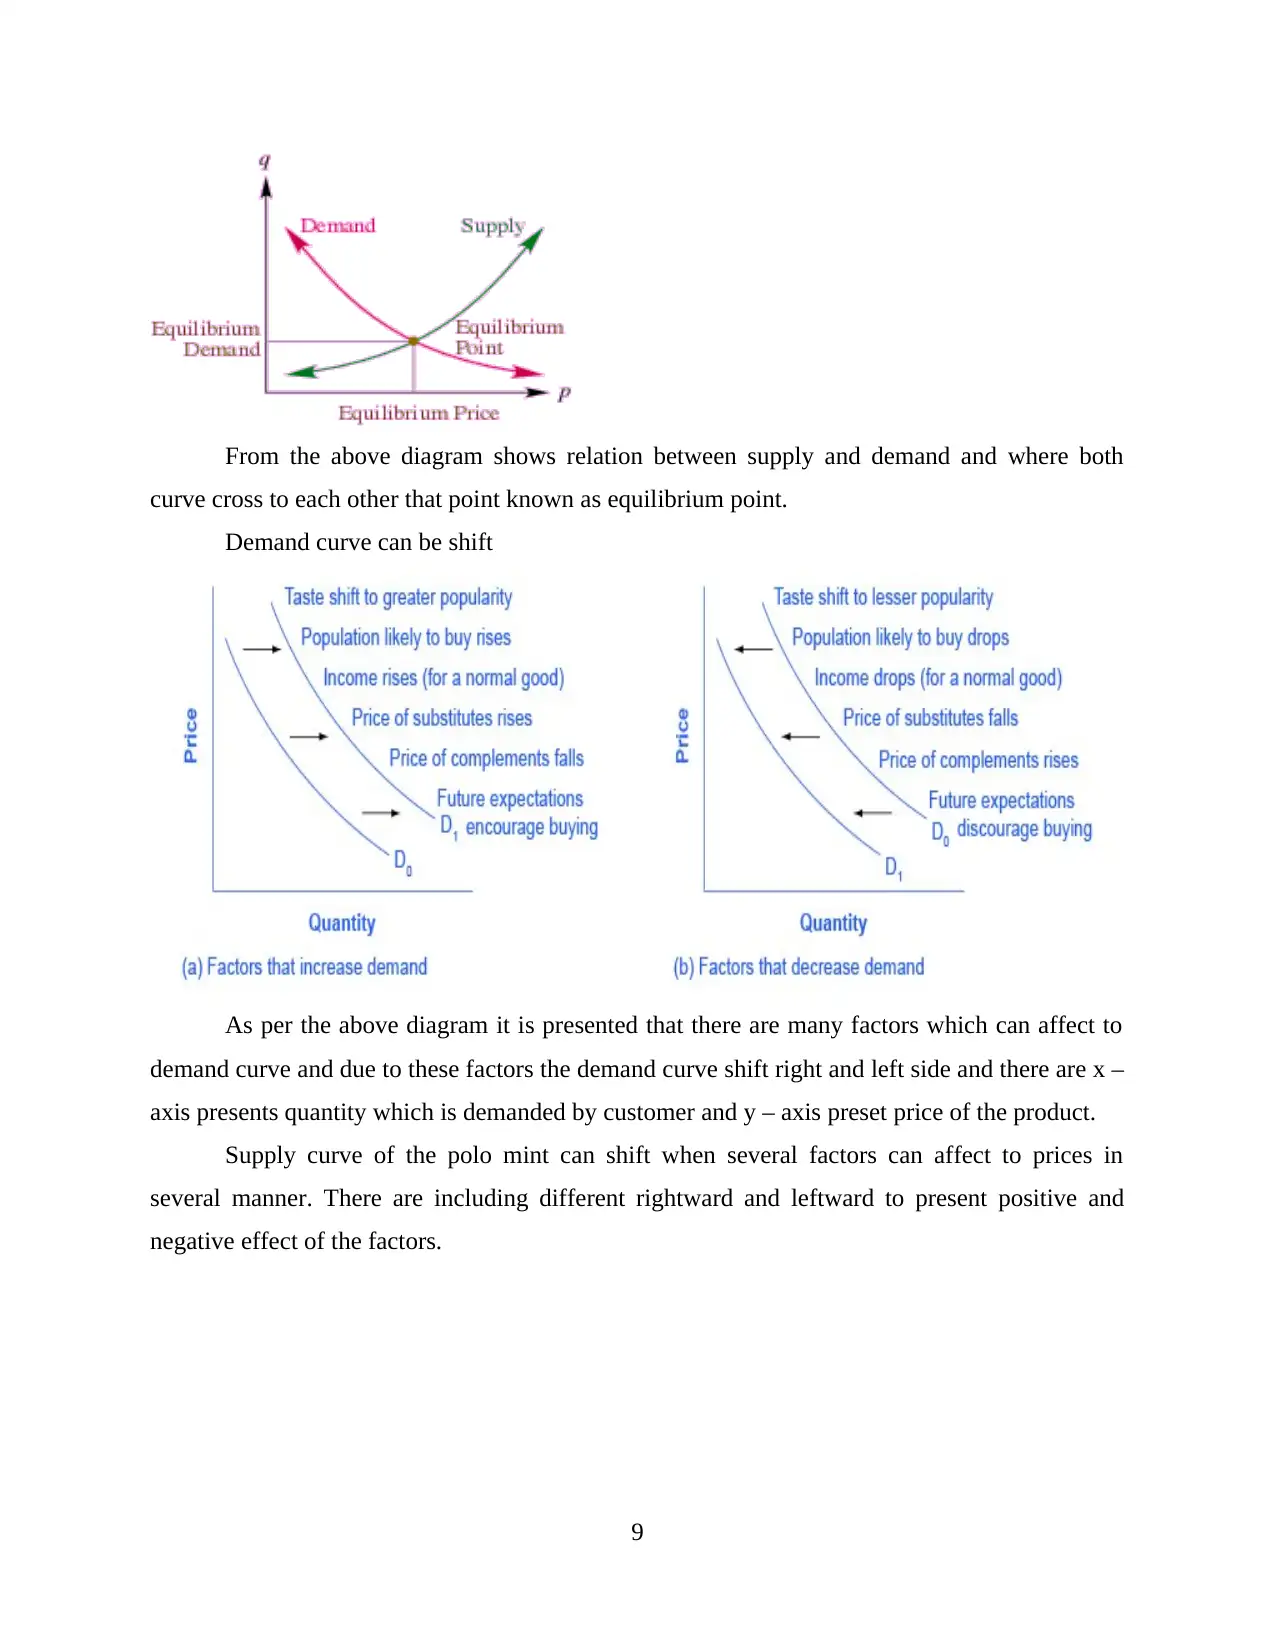
From the above diagram shows relation between supply and demand and where both
curve cross to each other that point known as equilibrium point.
Demand curve can be shift
As per the above diagram it is presented that there are many factors which can affect to
demand curve and due to these factors the demand curve shift right and left side and there are x –
axis presents quantity which is demanded by customer and y – axis preset price of the product.
Supply curve of the polo mint can shift when several factors can affect to prices in
several manner. There are including different rightward and leftward to present positive and
negative effect of the factors.
9
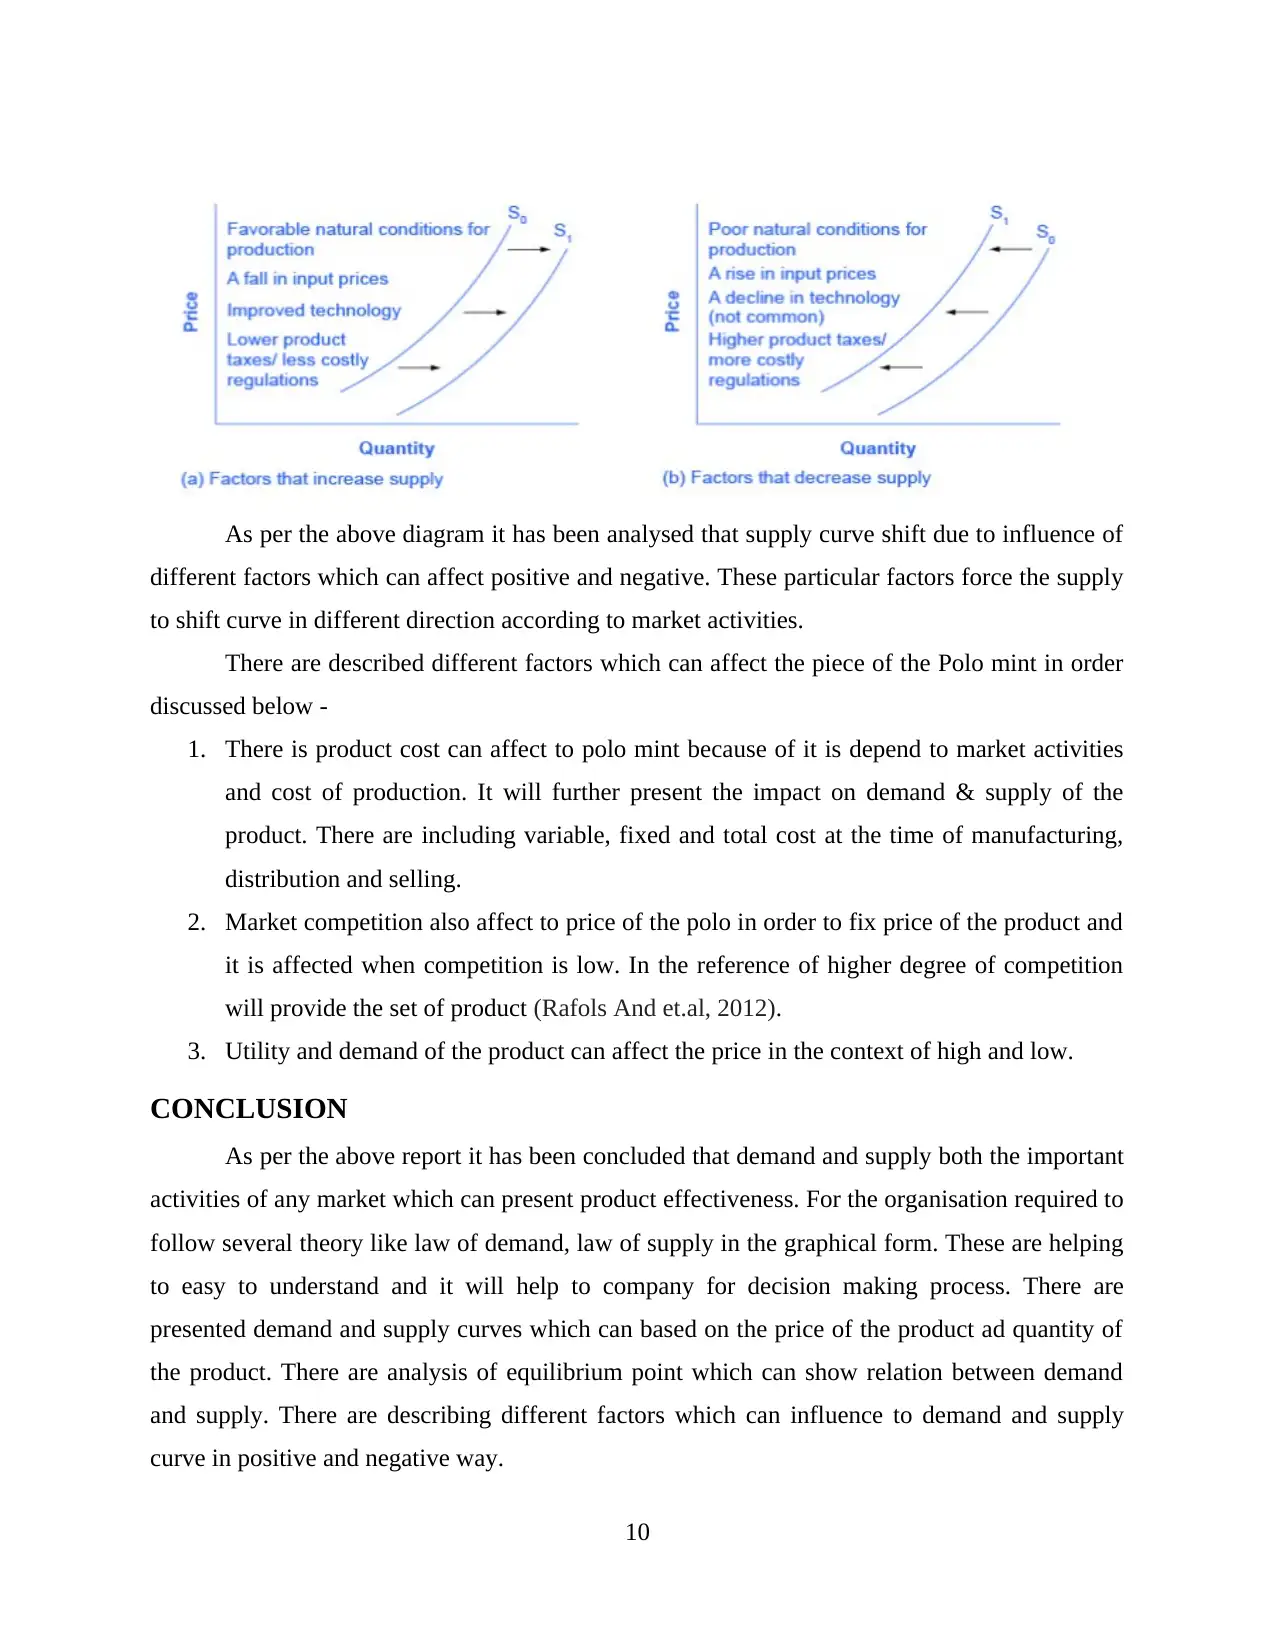
As per the above diagram it has been analysed that supply curve shift due to influence of
different factors which can affect positive and negative. These particular factors force the supply
to shift curve in different direction according to market activities.
There are described different factors which can affect the piece of the Polo mint in order
discussed below -
1. There is product cost can affect to polo mint because of it is depend to market activities
and cost of production. It will further present the impact on demand & supply of the
product. There are including variable, fixed and total cost at the time of manufacturing,
distribution and selling.
2. Market competition also affect to price of the polo in order to fix price of the product and
it is affected when competition is low. In the reference of higher degree of competition
will provide the set of product (Rafols And et.al, 2012).
3. Utility and demand of the product can affect the price in the context of high and low.
CONCLUSION
As per the above report it has been concluded that demand and supply both the important
activities of any market which can present product effectiveness. For the organisation required to
follow several theory like law of demand, law of supply in the graphical form. These are helping
to easy to understand and it will help to company for decision making process. There are
presented demand and supply curves which can based on the price of the product ad quantity of
the product. There are analysis of equilibrium point which can show relation between demand
and supply. There are describing different factors which can influence to demand and supply
curve in positive and negative way.
10
⊘ This is a preview!⊘
Do you want full access?
Subscribe today to unlock all pages.
Trusted by 1+ million students worldwide
1 out of 13
Related Documents


Your All-in-One AI-Powered Toolkit for Academic Success.
+13062052269
info@desklib.com
Available 24*7 on WhatsApp / Email
![[object Object]](/_next/static/media/star-bottom.7253800d.svg)
Unlock your academic potential
Copyright © 2020–2026 A2Z Services. All Rights Reserved. Developed and managed by ZUCOL.