Microeconomics Assignment: Production, Elasticity, and Market Dynamics

Verified

Added on  2023/04/22

|13
|1421
|438
Homework Assignment
AI Summary
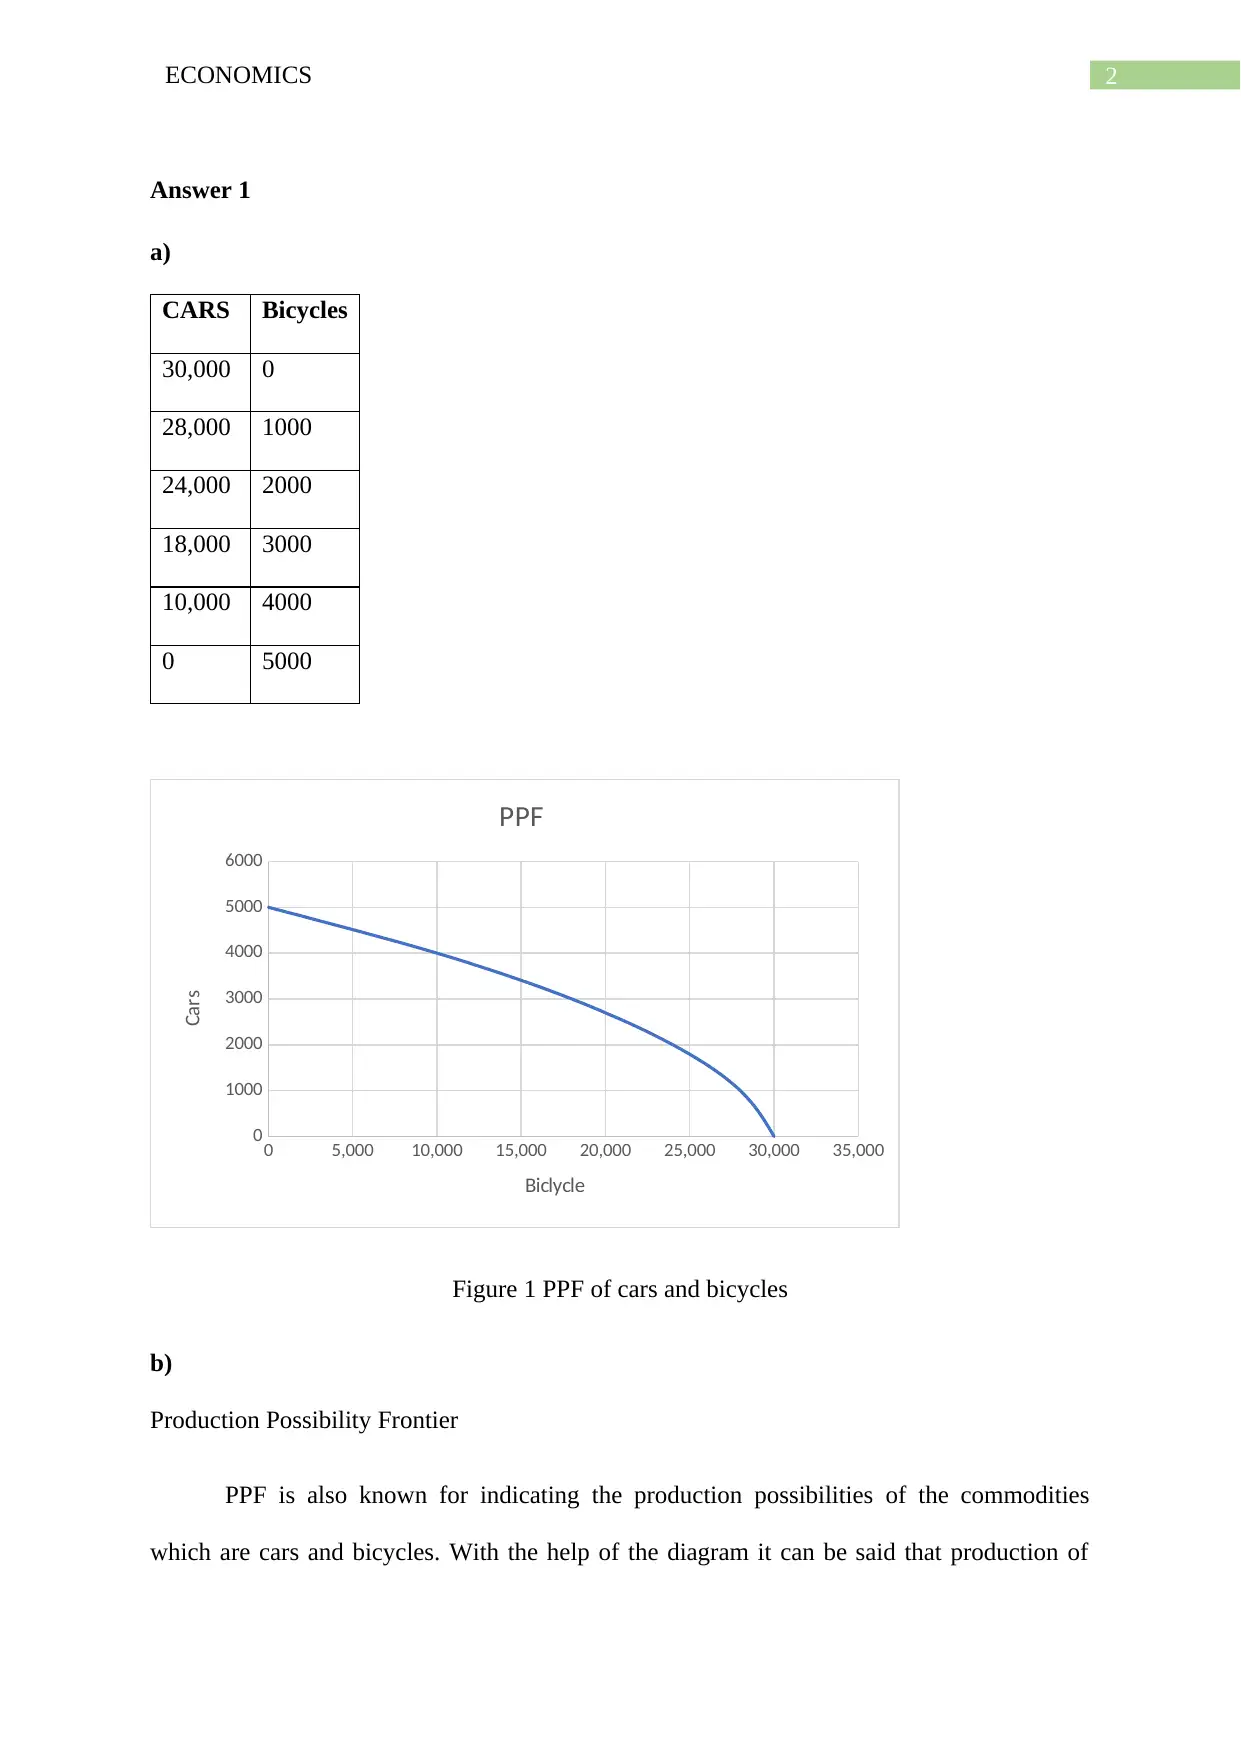
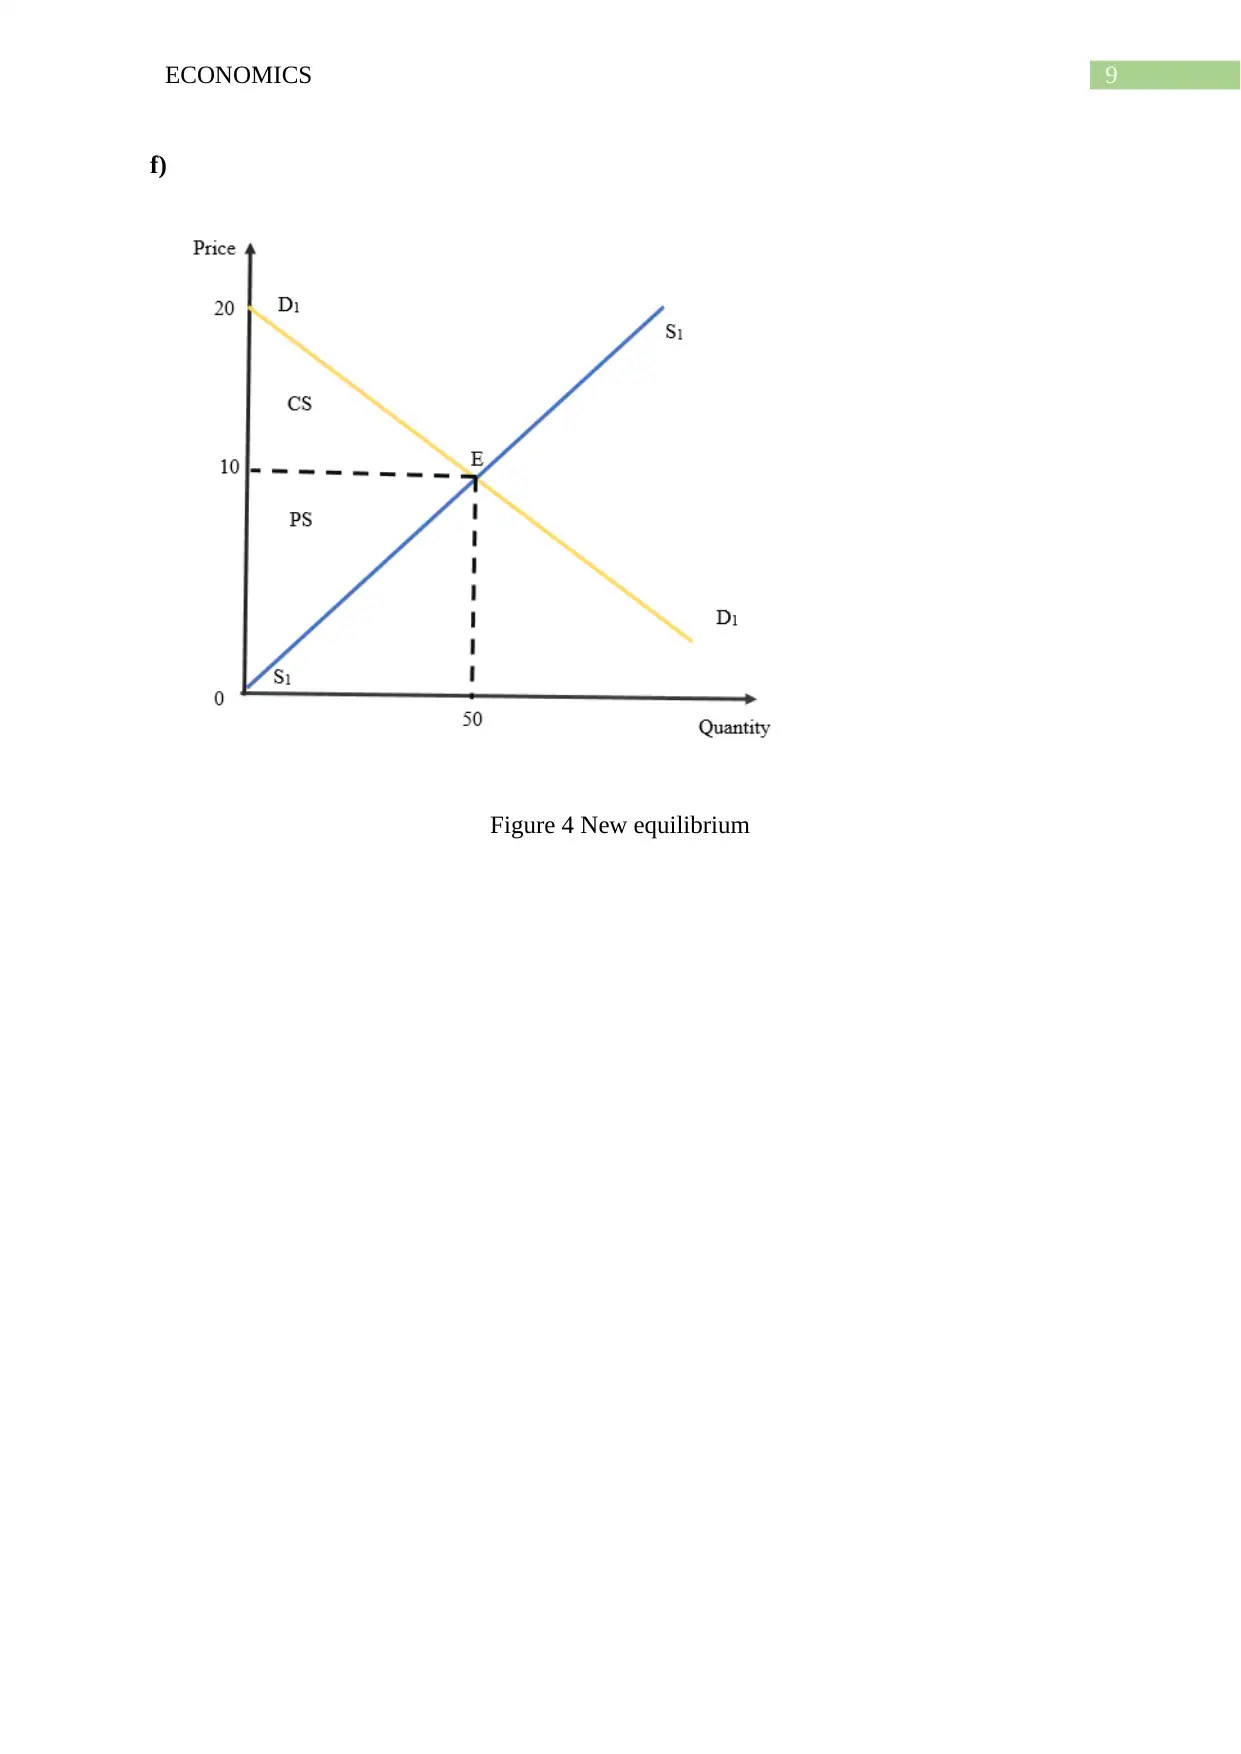
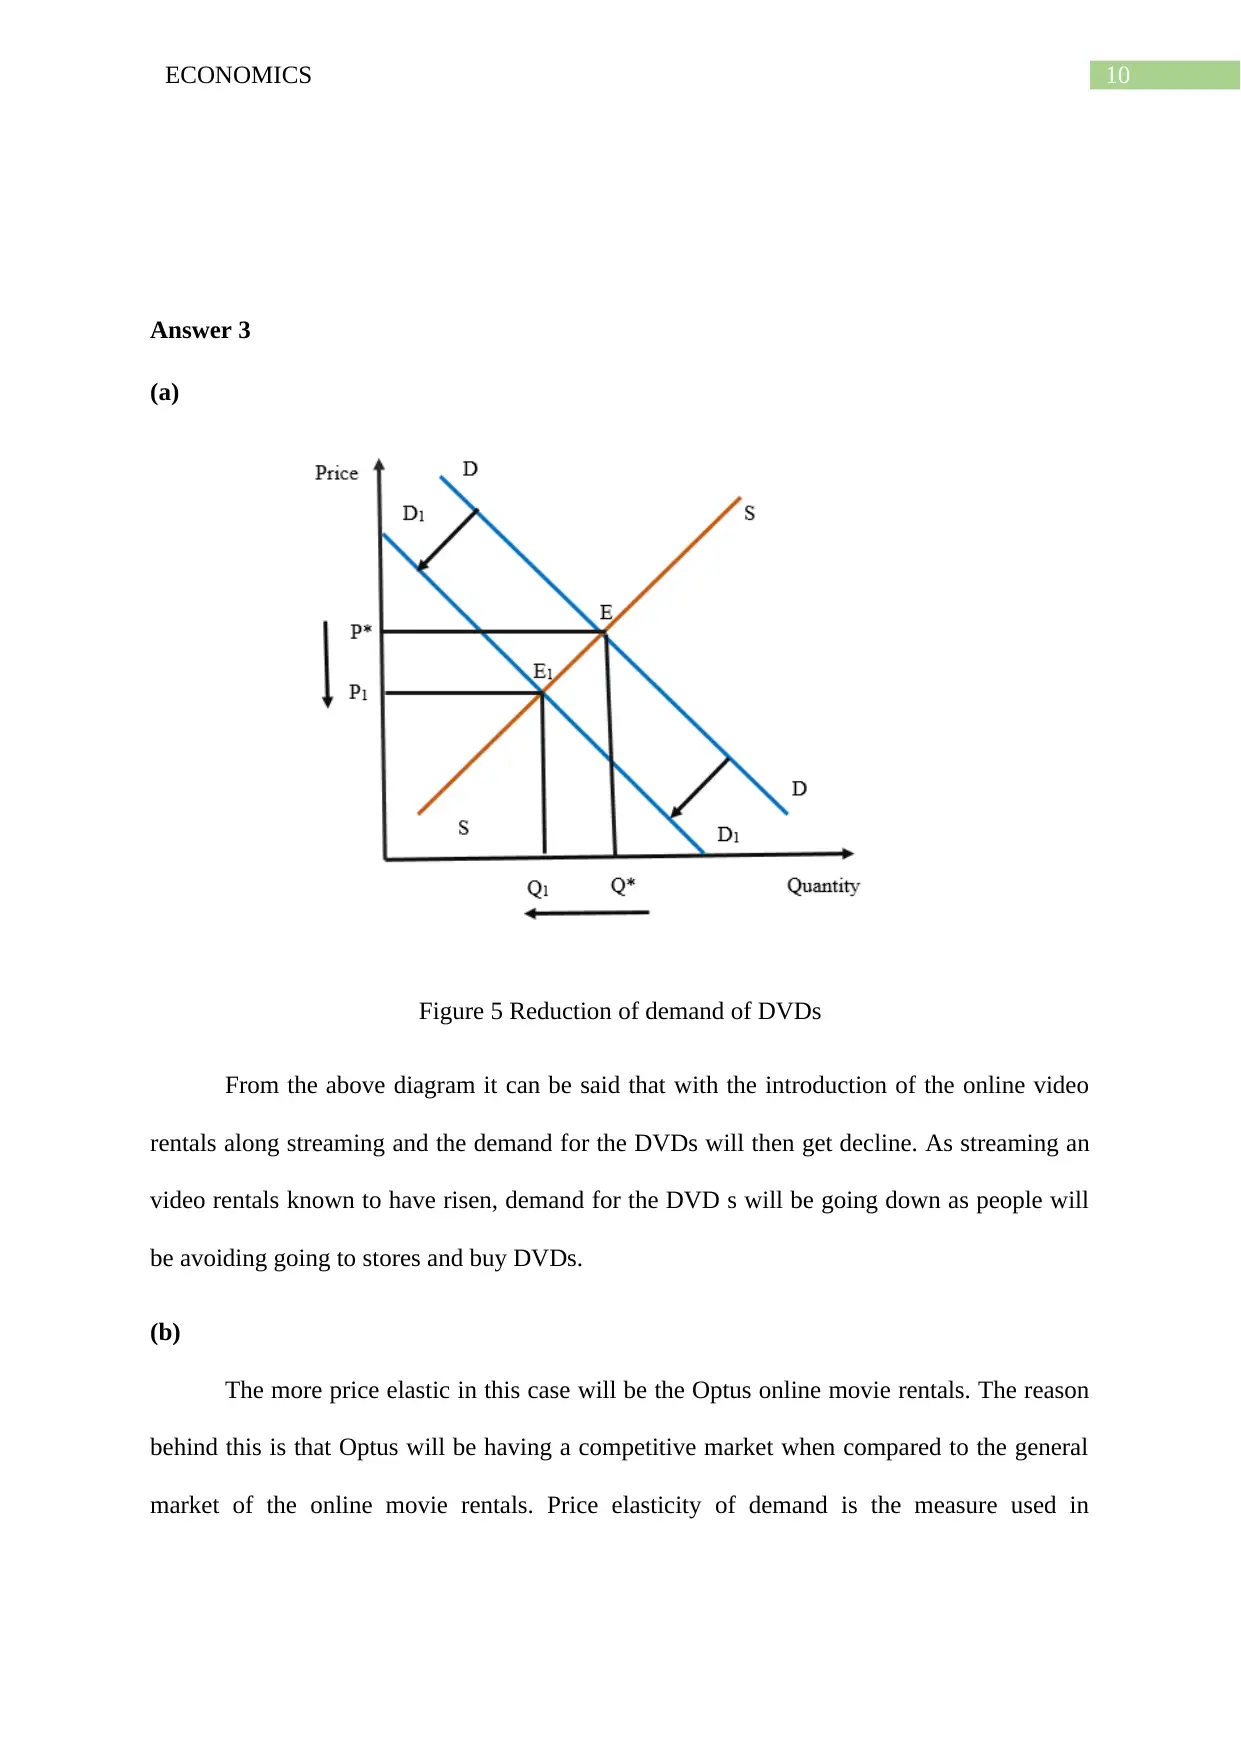
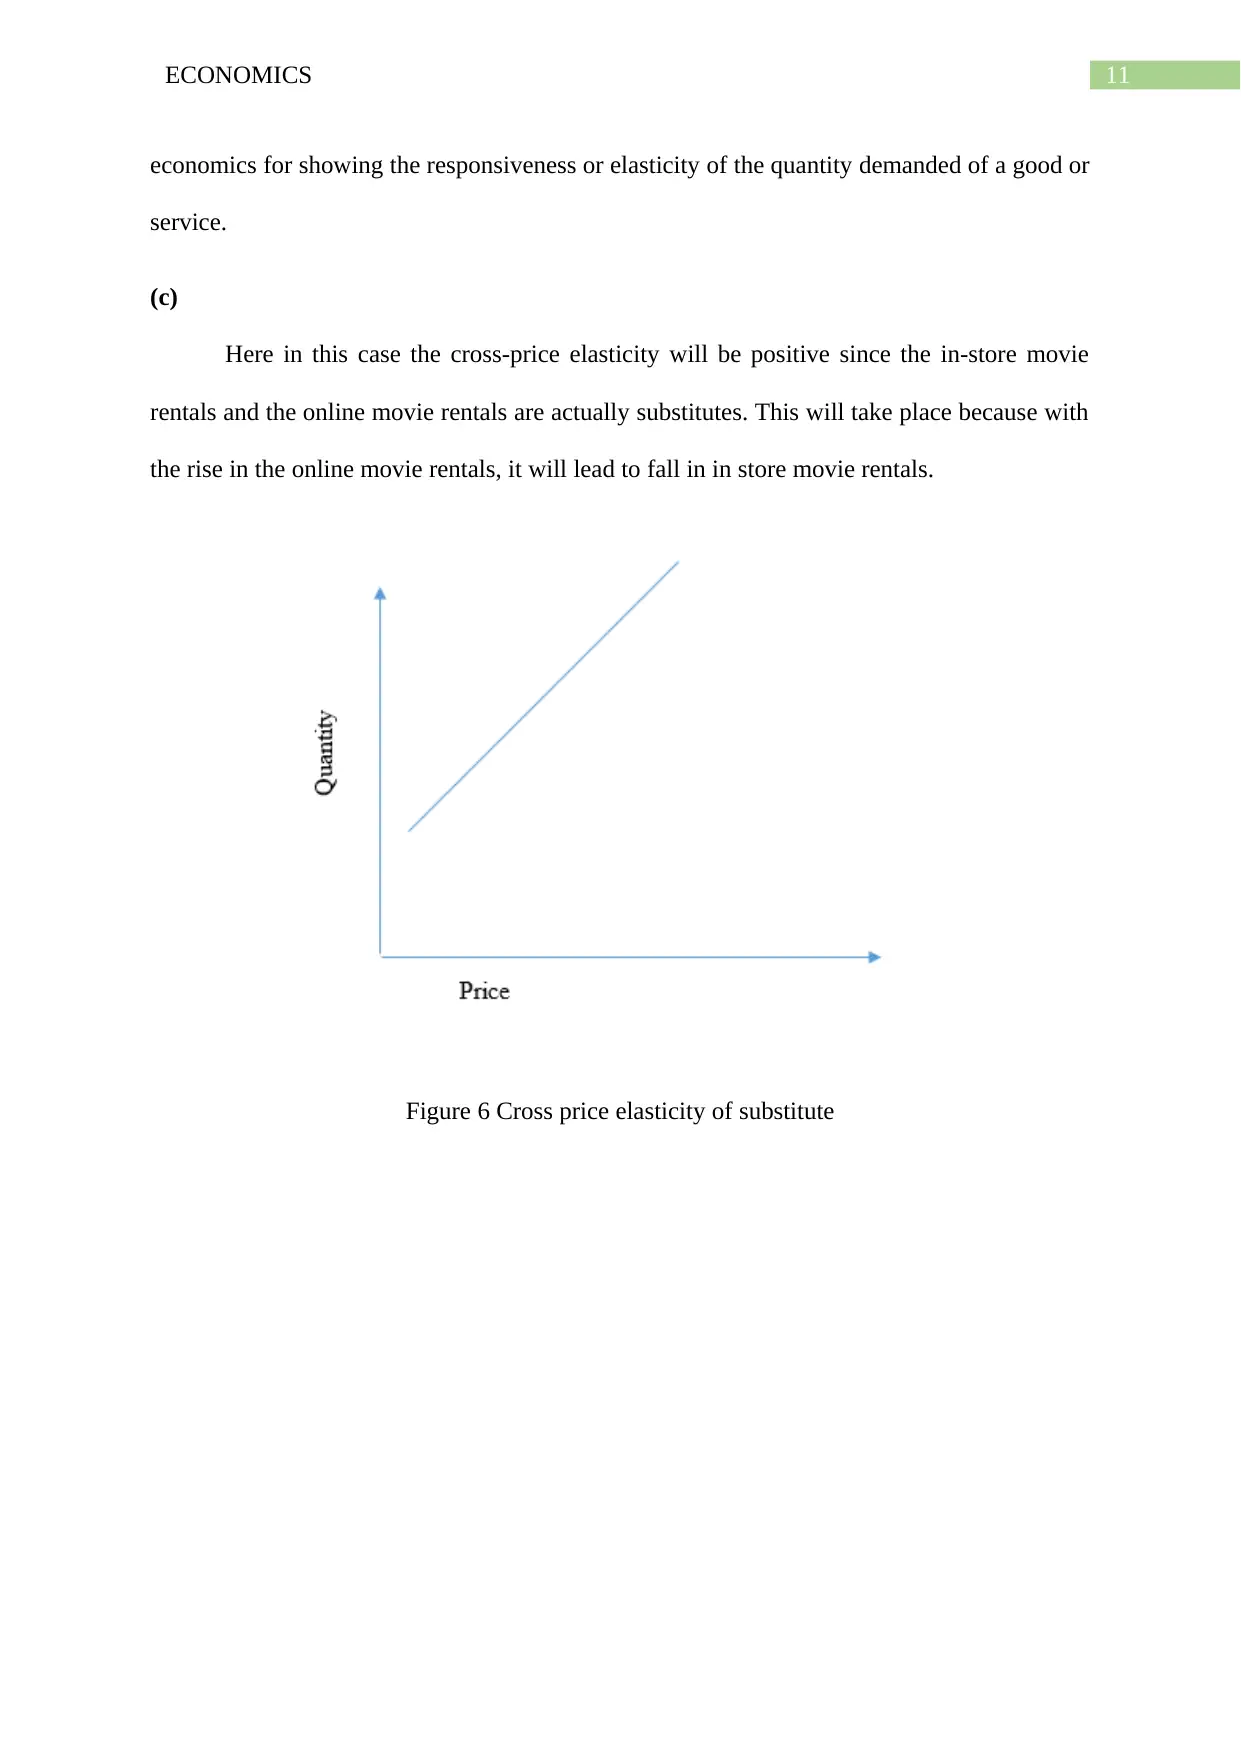
This economics assignment solution covers fundamental concepts including the Production Possibility Frontier (PPF), price elasticity of demand, and market equilibrium. The assignment begins by analyzing the PPF for cars and bicycles, explaining how it illustrates production possibilities and the impact of resource allocation. It then delves into price elasticity, calculating and interpreting its value based on changes in price and quantity demanded. Furthermore, the assignment determines market equilibrium by equating demand and supply functions, followed by calculating consumer and producer surplus. The impact of government restrictions on quantity is also assessed, demonstrating the resulting deadweight loss. Finally, the assignment explores the effects of online video rentals on the demand for DVDs, discussing cross-price elasticity and its implications. Desklib offers a wide range of solved assignments and study resources for students.
tabler-icon-diamond-filled.svg

Contribute Materials

Your contribution can guide someone’s learning journey. Share your documents today.
Document Page
Running head: ECONOMICS
Economics
Name of the assignment
Name of the university
Author note
tabler-icon-diamond-filled.svg

Secure Best Marks with AI Grader

Need help grading? Try our AI Grader for instant feedback on your assignments.
Document Page
1ECONOMICS
Table of Contents
Answer 1....................................................................................................................................2
a).............................................................................................................................................2
b)............................................................................................................................................2
c).............................................................................................................................................4
Answer 2....................................................................................................................................4
a).............................................................................................................................................4
b)............................................................................................................................................5
(c)...........................................................................................................................................5
(d)...........................................................................................................................................6
(e)...........................................................................................................................................7
f).............................................................................................................................................9
Answer 3..................................................................................................................................10
(a).........................................................................................................................................10
(b).........................................................................................................................................10
(c).........................................................................................................................................11
Reference list............................................................................................................................12
Document Page
2ECONOMICS
Answer 1
a)
CARS Bicycles
30,000 0
28,000 1000
24,000 2000
18,000 3000
10,000 4000
0 5000
0 5,000 10,000 15,000 20,000 25,000 30,000 35,000
0
1000
2000
3000
4000
5000
6000
PPF
Biclycle
Cars
Figure 1 PPF of cars and bicycles
b)
Production Possibility Frontier
PPF is also known for indicating the production possibilities of the commodities
which are cars and bicycles. With the help of the diagram it can be said that production of
Document Page
3ECONOMICS
cars can be increased when the bicycles production will get reduced. Therefore, it can be said
that the production possibility curve can be graphed when resources are used efficiently with
the absence of a choice between the two commodities.
The production possibility frontier can be stated as a kind of curve which is used for
depicting the maximum possible outcomes of any two commodities. It is known to assume
that all the inputs are used efficiently. The factors that affects PPF are capital, technology
and labor. PPF is also known for indicating the production possibilities of the commodities
which are cars and bicycles. With the help of the diagram it can be said that production of
cars can be increased when the bicycles production will get reduced. Therefore, it can be said
that the production possibility curve can be graphed when resources are used efficiently with
the absence of a choice between the two commodities.
Assumptions are:
Two goods: the assumptions are that economy can produce only two goods.
Fixed resources: here resources are fixed and are available in limited quantities.
Fixed technology: it is also assumed that the technology is fixed in this case.
Properties of production possibility frontier includes
Concave to the origin because of the rise in the opportunity.
Resource utilization will in optimum nature.
Increase in the marginal rate of transformation.
Downward sloping in nature since a lot of production of any one good means decline
in the production of any one kind of good.
tabler-icon-diamond-filled.svg

Secure Best Marks with AI Grader

Need help grading? Try our AI Grader for instant feedback on your assignments.
Document Page
4ECONOMICS
c)
As the demand both cars and bicycles have increased from 3000 to 4000 and 18000 to
2000. For meeting the demand of huge number of cars, Newland should be more
technologically advanced in order to produce more cars. The demand for both the goods can
be met when the country will be having enough efficient technology. Newland can also meet
the demand with the increasing trade and exchange and huge supply of the relevant factors of
production.
Answer 2
Price Quantity Revenue
200 50 10000
250 45 11250
300 40 12000
350 35 12250
400 30 12000
a)
When the price of the chip will be falling, the total revenue will be known to rise or
decline according to the quantities sold in the market. when the price of chip decreased from
400 to 350 with the quantity of chips sold increasing the total revenue will also be increasing
from 12000 to 12250 . As from the above table it can be seen that when the price of the chip
is $400, the quantity sold in 40 unlike of $350 where the quantity sold in 35. when the price
will be decreasing from $350 TO $300. The total revenue will be decreasing from $12250 to
Document Page
5ECONOMICS
$12000. So when the price of the chip decreases from $400 to $350 with the quantity of chips
sold increasing the total revenue will also increase from $12000 to $12250
b)
Price1 = $300 Price 2= $250
Quantity1 = 40 Quantity 2= 45
Price Elasticity of Demand: -0.6471
Type of Elasticity: Inelastic Demand
With the total revenue test it can be also said that demand in inelastic in nature
because with the increase in price, there is an increase in the total revenue and with the
decrease in price, decrease in total revenue.
QD = 100-5P
QS = 5P
For equilibrium in the market the demand should be equal to the supply of the product.
QD =QS
100-5P =5P
100=10P
P=10
(c)
Therefore putting the value of P in QD and QS, the equilibrium quantity will be 50
and the price will be 10.
Document Page
6ECONOMICS
(d)
,
The consumer surplus
Consumer Surplus ( CS )= 1
2 × ( 2010 ) × 50
¿ 1
2 ×10 ×50
50
10
QD = 100-5P
P
Q
QS =
5P
Figure 2 Consumer and producer surplus
20
0
CS
PS
tabler-icon-diamond-filled.svg

Paraphrase This Document

Need a fresh take? Get an instant paraphrase of this document with our AI Paraphraser
Document Page
7ECONOMICS
¿ 250
Therefore, it can be said that the value of the consumer surplus will be 250.
Producer surplus
Producer Surplus ( PS ) =1
2 ×10 ×50
¿ 250
The producer surplus will be 250
Therefore the total surplus will be = CS+PS
250+ 250 =500
(e)
Figure 3 Equilibrium after government restriction
When government sells restricts the quantity of goods then,
Document Page
8ECONOMICS
Cosumer surplus= 1
2 × ( 2015 ) ×25
¿ 1
2 ×5 ×25
¿ 62.5
The producer surplus will be
B+C+ D
Which will be (15-5)*25= 250 =B+C
D =1/2*5*25
=62.5
Total PS
250+62.5
¿ 312.5
Deadweight loss
2 × ( 1
2 × 5 ×25 ) = 125
Document Page
9ECONOMICS
f)
Figure 4 New equilibrium
tabler-icon-diamond-filled.svg

Secure Best Marks with AI Grader

Need help grading? Try our AI Grader for instant feedback on your assignments.
Document Page
10ECONOMICS
Answer 3
(a)
Figure 5 Reduction of demand of DVDs
From the above diagram it can be said that with the introduction of the online video
rentals along streaming and the demand for the DVDs will then get decline. As streaming an
video rentals known to have risen, demand for the DVD s will be going down as people will
be avoiding going to stores and buy DVDs.
(b)
The more price elastic in this case will be the Optus online movie rentals. The reason
behind this is that Optus will be having a competitive market when compared to the general
market of the online movie rentals. Price elasticity of demand is the measure used in
Document Page
11ECONOMICS
economics for showing the responsiveness or elasticity of the quantity demanded of a good or
service.
(c)
Here in this case the cross-price elasticity will be positive since the in-store movie
rentals and the online movie rentals are actually substitutes. This will take place because with
the rise in the online movie rentals, it will lead to fall in in store movie rentals.
Figure 6 Cross price elasticity of substitute
Document Page
12ECONOMICS
Reference list
Bauer, M.J.R., 2018. Principles of microeconomics.
Cowell, F., 2018. Microeconomics: principles and analysis. Oxford University Press.
Cowen, T. and Tabarrok, A., 2015. Modern principles of microeconomics. Macmillan
International Higher Education.
Fine, B., 2016. Microeconomics. University of Chicago Press Economics Books.
Friedman, L.S., 2017. The microeconomics of public policy analysis. Princeton University
Press.
Iossa, E. and Martimort, D., 2015. The simple microeconomics of publicprivate partnerships.
Journal of Public Economic Theory, 17(1), pp.4-48.
McKenzie, R.B. and Lee, D.R., 2016. Microeconomics for MBAs: The economic way of
thinking for managers. Cambridge University Press.
Microeconomics, E.E., 2015. KELVIN WONG. Cell, 808, pp.386-8406.
Tahir, S., Ghazali, A. and Agil, S.O.S. eds., 2017. Readings in Microeconomics: An Islamic
Perspective. In The Name of Allah, The most Beneficent, The most Merciful, p.104.
chevron_up_icon
1 out of 13
circle_padding
hide_on_mobile
zoom_out_icon
logo.png

Your All-in-One AI-Powered Toolkit for Academic Success.

Available 24*7 on WhatsApp / Email

[object Object]