Comprehensive Economics Report: Market and Pricing Strategies
VerifiedAdded on 2020/03/16
|14
|2894
|87
Report
AI Summary
This comprehensive economics report delves into various key concepts, beginning with an analysis of price discrimination strategies employed by a movie theatre, exploring how different prices are set for adults and students to maximize revenue. The report then examines the price elasticity of demand, using cigarettes, alcohol and soft drinks as examples and how it impacts government taxation policies. It further explores marginal and average costs in a business context, emphasizing the importance of considering both variable and fixed costs. The report then investigates the cross elasticity of demand between natural gas and coal, illustrating the relationship between these substitute goods. Game theory is applied to an advertising scenario, analyzing strategic decisions made by competing firms. The report also covers project costs and benefits, focusing on investment decisions and cost-benefit analysis. Finally, it briefly touches on vehicular insurance and the role of monitoring devices in assessing risk. The report incorporates tables and graphs to support its analysis.
Contents
Q1) Price Discrimination.............................................................................................................................1
Q2) Price Elasticity of Demand...................................................................................................................6
Q3) Marginal and Average Costs................................................................................................................8
Q4) Cross Elasticity between Coal and Natural Gas....................................................................................9
Q5) Game Theory.....................................................................................................................................10
Q6) Project Costs and Benefits.................................................................................................................11
Q7) Vehicular Insurance............................................................................................................................12
References.................................................................................................................................................13
Table 1 Total Revenues at Various Price Points from Adults......................................................................2
Table 2Total Revenues from Students at Various Price Points....................................................................2
Table 3 Aggregate Quantity Demanded and Total Revenues (without price discrimination)......................3
Table 4 The Impact of Elasticity on demand................................................................................................7
Table 5 Advertising Game table for Fumed Lungs Ltd. and Chokee Ltd..................................................10
Graph 1 Quantity of Tickets Demanded by Adults.......................................................................................4
Graph 2 Quantity of Tickets Demanded by Students...................................................................................5
Graph 3 Aggregate Demand Curve without price discrimination................................................................6
Graph 4 Aggregate Demand Curve (Demand Curve Without Price Discrimination)....................................7
Graph 5 Cross Elasticity of Natural Gas and Coal.......................................................................................10
Q1) Price Discrimination
a) ‘Price discrimination’ is a pricing strategy wherein produces charge different prices per
products classes of producers . In the given example, first degree price discrimination is
used. Profit is maximised when every class of consumer is charged the maximum price
that they are willing to pay. (Barrows and Smithin 2009)In the given example, a movie
theatre charges different prices to adults and students. The producer knows that adults
have a greater willingness to pay. Hence, charging them higher prices would help
Paraphrase This Document
Need a fresh take? Get an instant paraphrase of this document with our AI Paraphraser
increase revenues. (Barrows and Smithin 2009)On the other hand, the capacity of movie
theatres is fixed and adults may not fill all the seats. The student group is one of the
groups that may have a higher number of movie enthusiasts. However, their willingness
to pay would be lower. Hence, the movie theatre charges them a lower price.
b) Producer surplus is maximized when consumers every class of consumer is charged a
price that would be their maximum ‘willingess to pay’. In the above example, the
number of tickets sold, represents the number of people who are willing to pay the price
of the ticket i.e the effective of demand. The producer must choose that combination
where the total revenue fro students and consumers is highest. (Barrows and Smithin
2009)
I. Adults may or may not earn a surplus. If the willingness to pay of an adult was
greater than $12, then adults will earn consumer surplus.
II. Similarly, students will earn a consumer surplus, if the willingness to pay was higher
than $8. (Courty and Pagliero 2009)
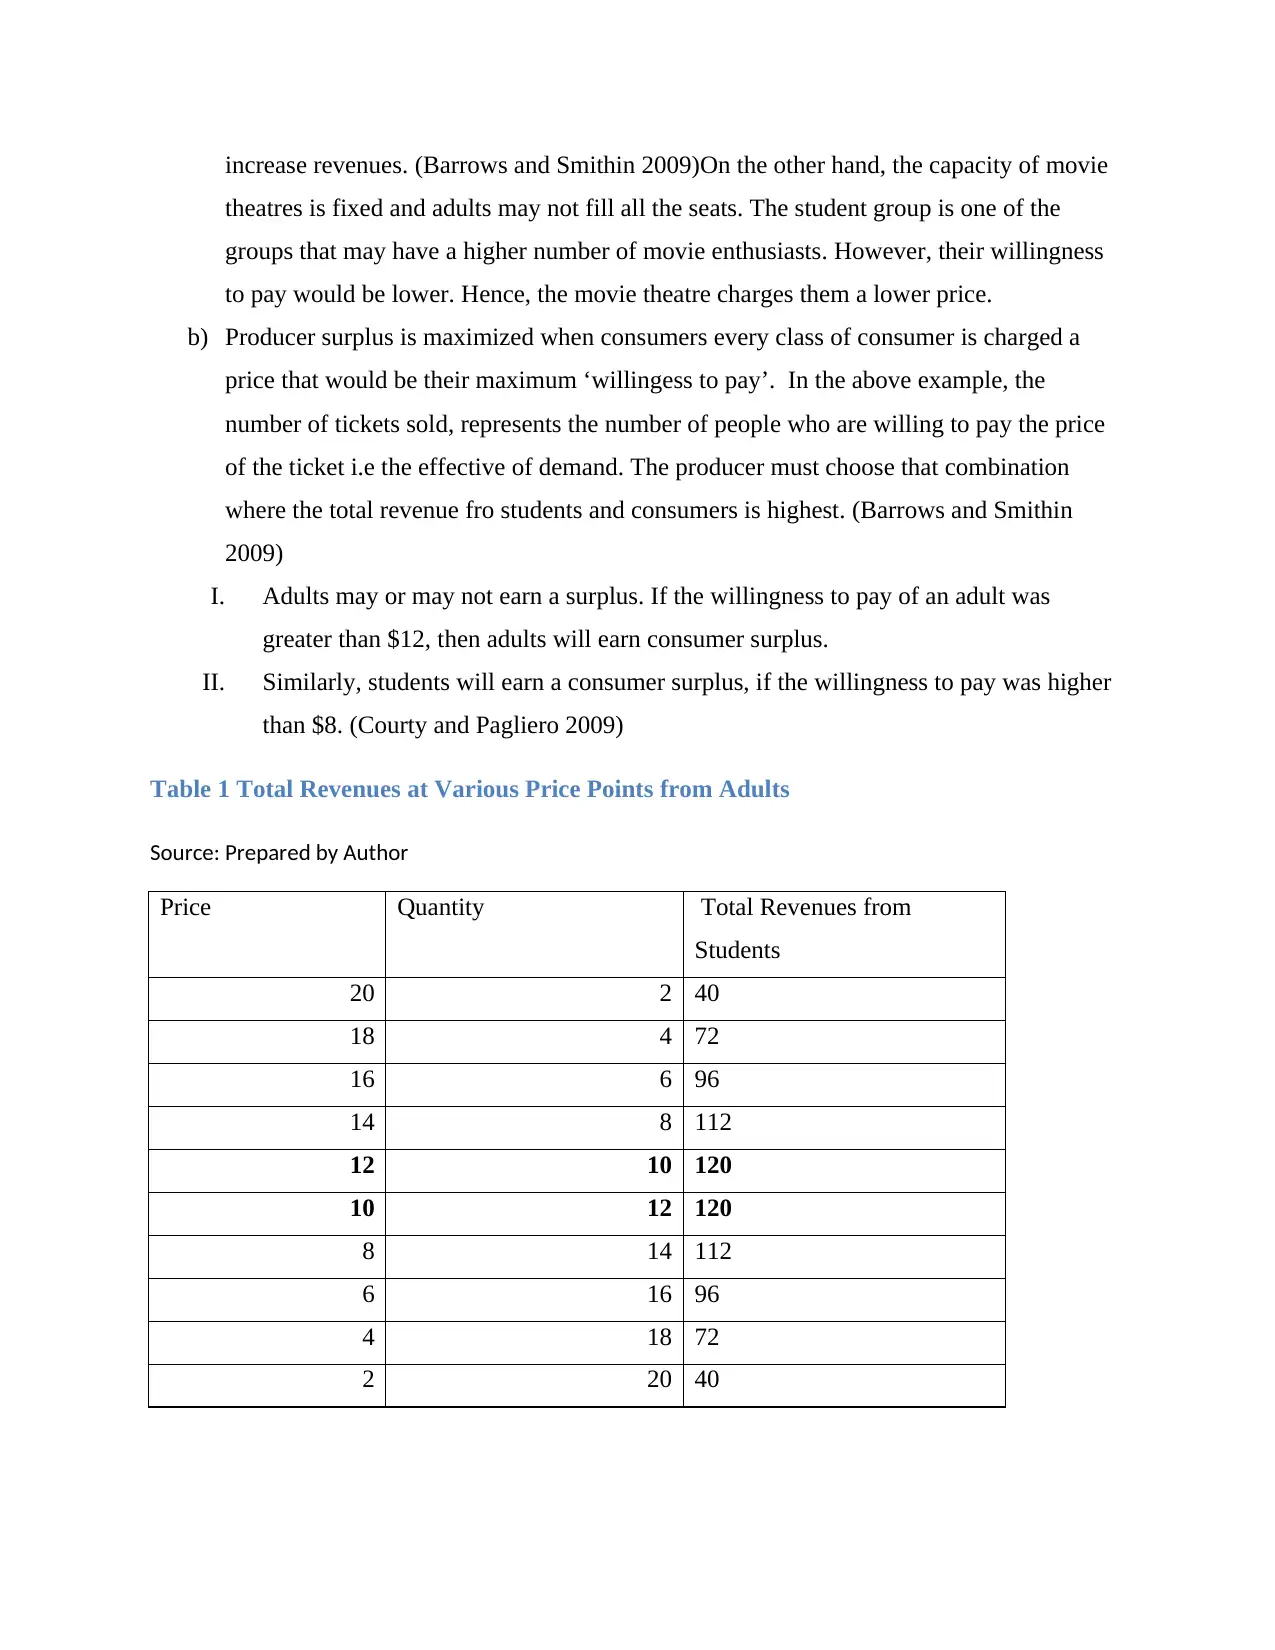
Table 1 Total Revenues at Various Price Points from Adults
Source: Prepared by Author
Price Quantity Total Revenues from
Students
20 2 40
18 4 72
16 6 96
14 8 112
12 10 120
10 12 120
8 14 112
6 16 96
4 18 72
2 20 40
theatres is fixed and adults may not fill all the seats. The student group is one of the
groups that may have a higher number of movie enthusiasts. However, their willingness
to pay would be lower. Hence, the movie theatre charges them a lower price.
b) Producer surplus is maximized when consumers every class of consumer is charged a
price that would be their maximum ‘willingess to pay’. In the above example, the
number of tickets sold, represents the number of people who are willing to pay the price
of the ticket i.e the effective of demand. The producer must choose that combination
where the total revenue fro students and consumers is highest. (Barrows and Smithin
2009)
I. Adults may or may not earn a surplus. If the willingness to pay of an adult was
greater than $12, then adults will earn consumer surplus.
II. Similarly, students will earn a consumer surplus, if the willingness to pay was higher
than $8. (Courty and Pagliero 2009)
Table 1 Total Revenues at Various Price Points from Adults
Source: Prepared by Author
Price Quantity Total Revenues from
Students
20 2 40
18 4 72
16 6 96
14 8 112
12 10 120
10 12 120
8 14 112
6 16 96
4 18 72
2 20 40
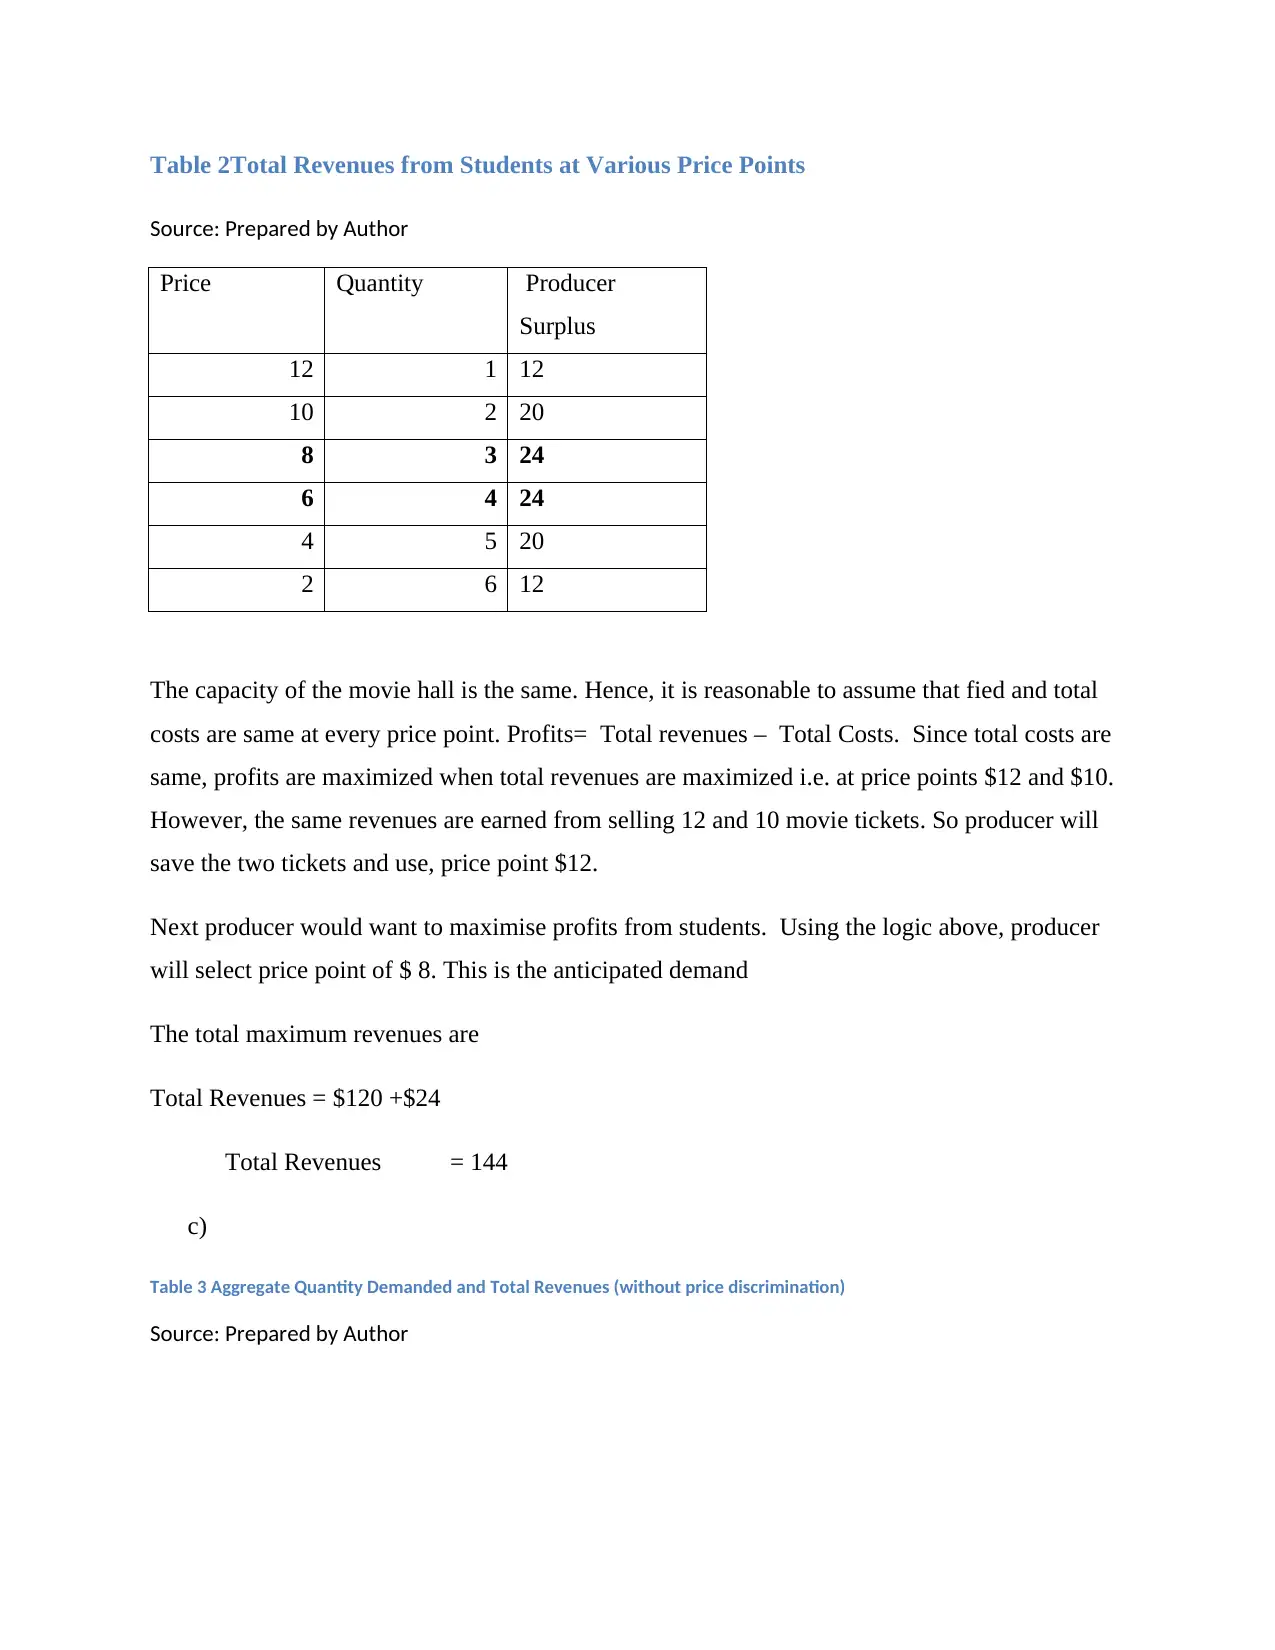
Table 2Total Revenues from Students at Various Price Points
Source: Prepared by Author
Price Quantity Producer
Surplus
12 1 12
10 2 20
8 3 24
6 4 24
4 5 20
2 6 12
The capacity of the movie hall is the same. Hence, it is reasonable to assume that fied and total
costs are same at every price point. Profits= Total revenues – Total Costs. Since total costs are
same, profits are maximized when total revenues are maximized i.e. at price points $12 and $10.
However, the same revenues are earned from selling 12 and 10 movie tickets. So producer will
save the two tickets and use, price point $12.
Next producer would want to maximise profits from students. Using the logic above, producer
will select price point of $ 8. This is the anticipated demand
The total maximum revenues are
Total Revenues = $120 +$24
Total Revenues = 144
c)
Table 3 Aggregate Quantity Demanded and Total Revenues (without price discrimination)
Source: Prepared by Author
Source: Prepared by Author
Price Quantity Producer
Surplus
12 1 12
10 2 20
8 3 24
6 4 24
4 5 20
2 6 12
The capacity of the movie hall is the same. Hence, it is reasonable to assume that fied and total
costs are same at every price point. Profits= Total revenues – Total Costs. Since total costs are
same, profits are maximized when total revenues are maximized i.e. at price points $12 and $10.
However, the same revenues are earned from selling 12 and 10 movie tickets. So producer will
save the two tickets and use, price point $12.
Next producer would want to maximise profits from students. Using the logic above, producer
will select price point of $ 8. This is the anticipated demand
The total maximum revenues are
Total Revenues = $120 +$24
Total Revenues = 144
c)
Table 3 Aggregate Quantity Demanded and Total Revenues (without price discrimination)
Source: Prepared by Author
⊘ This is a preview!⊘
Do you want full access?
Subscribe today to unlock all pages.
Trusted by 1+ million students worldwide
Price Quantity
Total
revenues
From Adults
Quantity Total
Quantity
Total Revenues
from Students Total Revenues
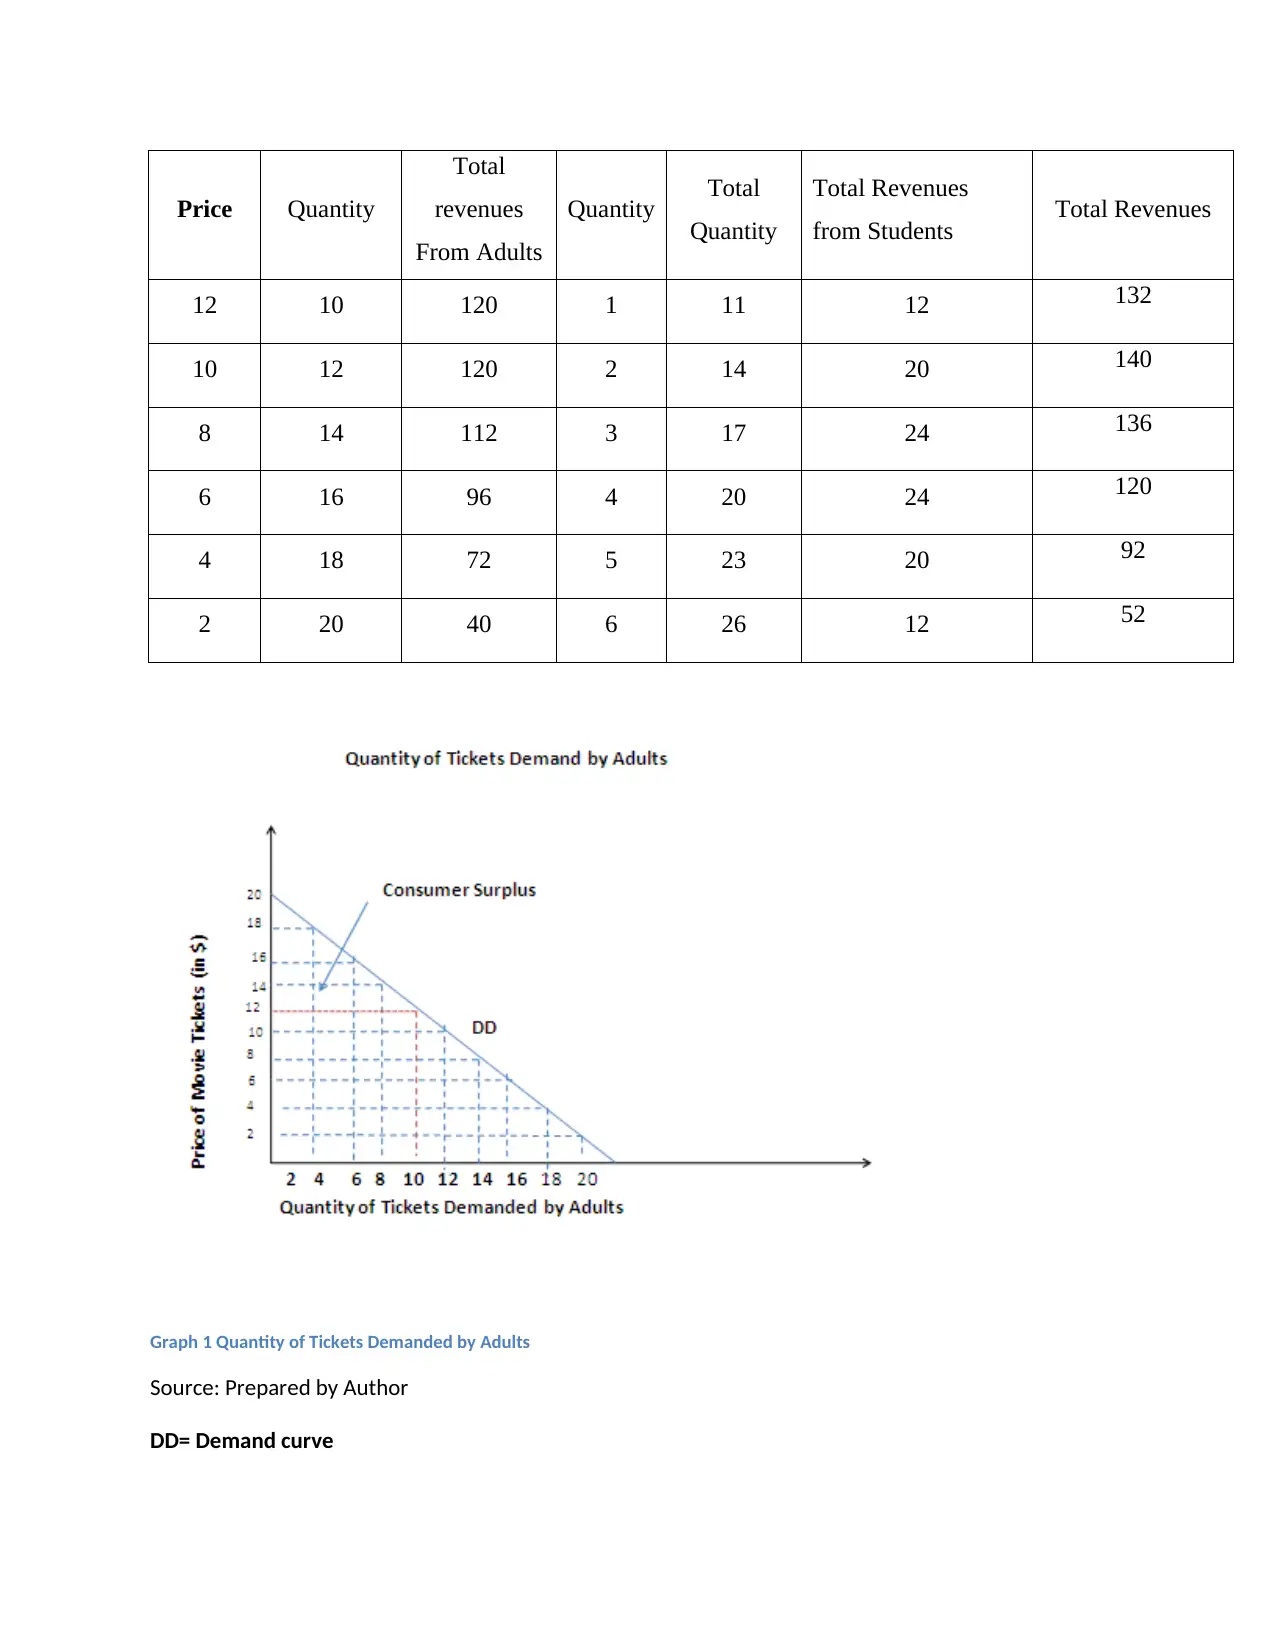
12 10 120 1 11 12 132
10 12 120 2 14 20 140
8 14 112 3 17 24 136
6 16 96 4 20 24 120
4 18 72 5 23 20 92
2 20 40 6 26 12 52
Graph 1 Quantity of Tickets Demanded by Adults
Source: Prepared by Author
DD= Demand curve
Total
revenues
From Adults
Quantity Total
Quantity
Total Revenues
from Students Total Revenues
12 10 120 1 11 12 132
10 12 120 2 14 20 140
8 14 112 3 17 24 136
6 16 96 4 20 24 120
4 18 72 5 23 20 92
2 20 40 6 26 12 52
Graph 1 Quantity of Tickets Demanded by Adults
Source: Prepared by Author
DD= Demand curve
Paraphrase This Document
Need a fresh take? Get an instant paraphrase of this document with our AI Paraphraser
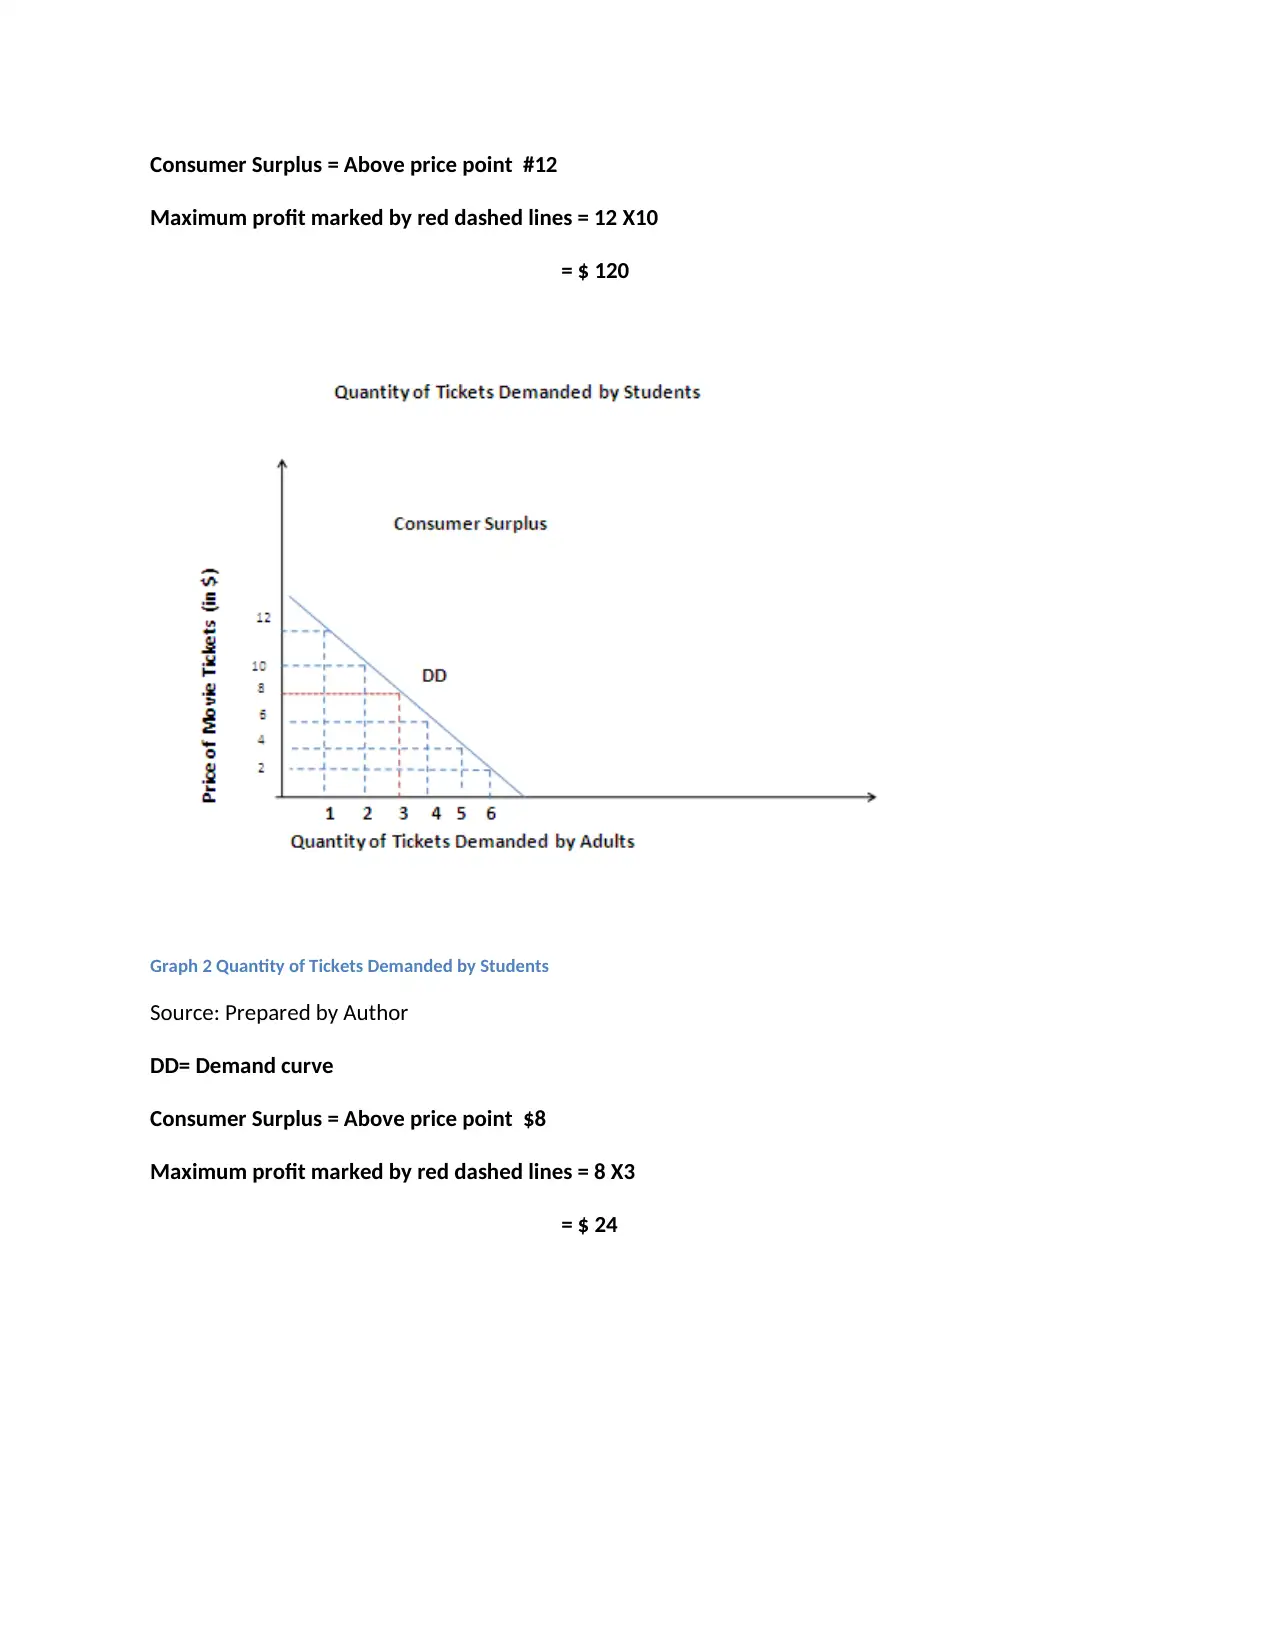
Consumer Surplus = Above price point #12
Maximum profit marked by red dashed lines = 12 X10
= $ 120
Graph 2 Quantity of Tickets Demanded by Students
Source: Prepared by Author
DD= Demand curve
Consumer Surplus = Above price point $8
Maximum profit marked by red dashed lines = 8 X3
= $ 24
Maximum profit marked by red dashed lines = 12 X10
= $ 120
Graph 2 Quantity of Tickets Demanded by Students
Source: Prepared by Author
DD= Demand curve
Consumer Surplus = Above price point $8
Maximum profit marked by red dashed lines = 8 X3
= $ 24
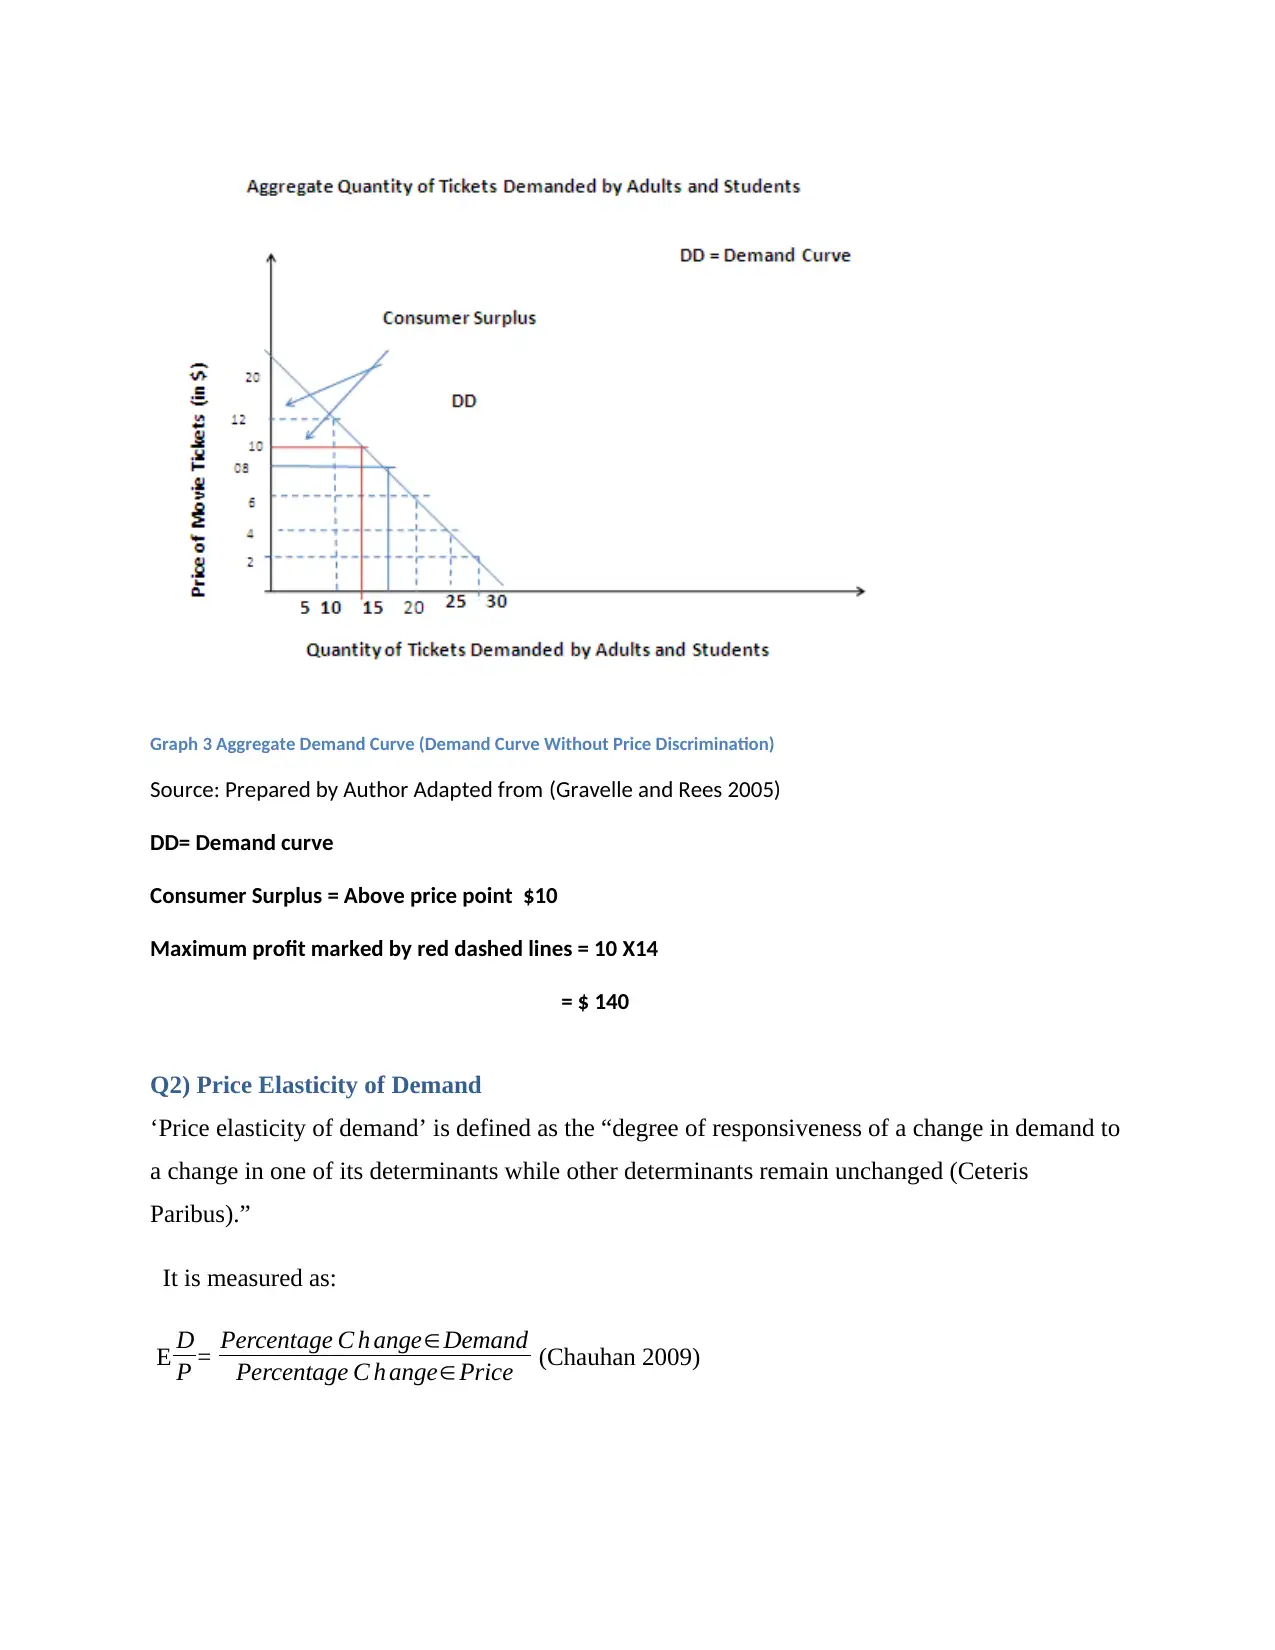
Graph 3 Aggregate Demand Curve (Demand Curve Without Price Discrimination)
Source: Prepared by Author Adapted from (Gravelle and Rees 2005)
DD= Demand curve
Consumer Surplus = Above price point $10
Maximum profit marked by red dashed lines = 10 X14
= $ 140
Q2) Price Elasticity of Demand
‘Price elasticity of demand’ is defined as the “degree of responsiveness of a change in demand to
a change in one of its determinants while other determinants remain unchanged (Ceteris
Paribus).”
It is measured as:
E D
P = Percentage C h ange∈Demand
Percentage C h ange∈Price (Chauhan 2009)
⊘ This is a preview!⊘
Do you want full access?
Subscribe today to unlock all pages.
Trusted by 1+ million students worldwide
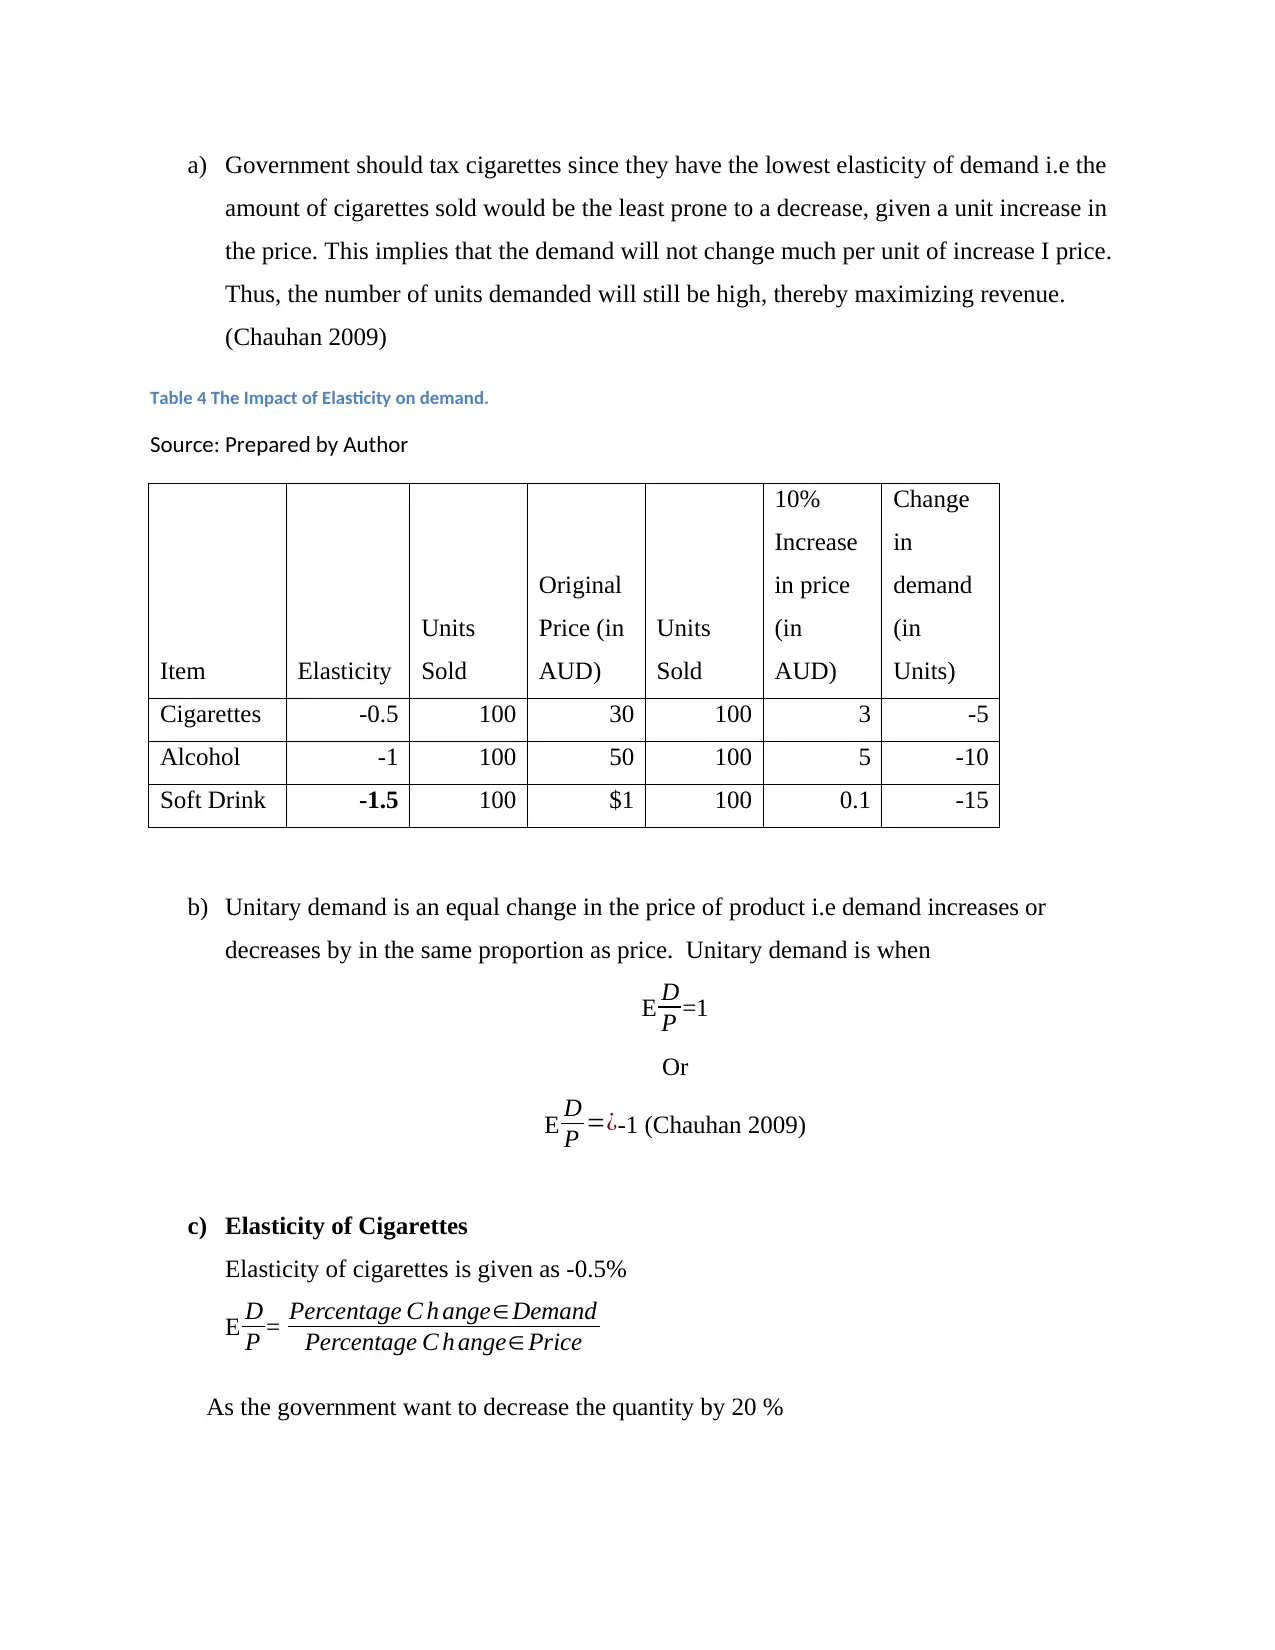
a) Government should tax cigarettes since they have the lowest elasticity of demand i.e the
amount of cigarettes sold would be the least prone to a decrease, given a unit increase in
the price. This implies that the demand will not change much per unit of increase I price.
Thus, the number of units demanded will still be high, thereby maximizing revenue.
(Chauhan 2009)
Table 4 The Impact of Elasticity on demand.
Source: Prepared by Author
Item Elasticity
Units
Sold
Original
Price (in
AUD)
Units
Sold
10%
Increase
in price
(in
AUD)
Change
in
demand
(in
Units)
Cigarettes -0.5 100 30 100 3 -5
Alcohol -1 100 50 100 5 -10
Soft Drink -1.5 100 $1 100 0.1 -15
b) Unitary demand is an equal change in the price of product i.e demand increases or
decreases by in the same proportion as price. Unitary demand is when
E D
P =1
Or
E D
P =¿-1 (Chauhan 2009)
c) Elasticity of Cigarettes
Elasticity of cigarettes is given as -0.5%
E D
P = Percentage C h ange∈Demand
Percentage C h ange∈ Price
As the government want to decrease the quantity by 20 %
Paraphrase This Document
Need a fresh take? Get an instant paraphrase of this document with our AI Paraphraser
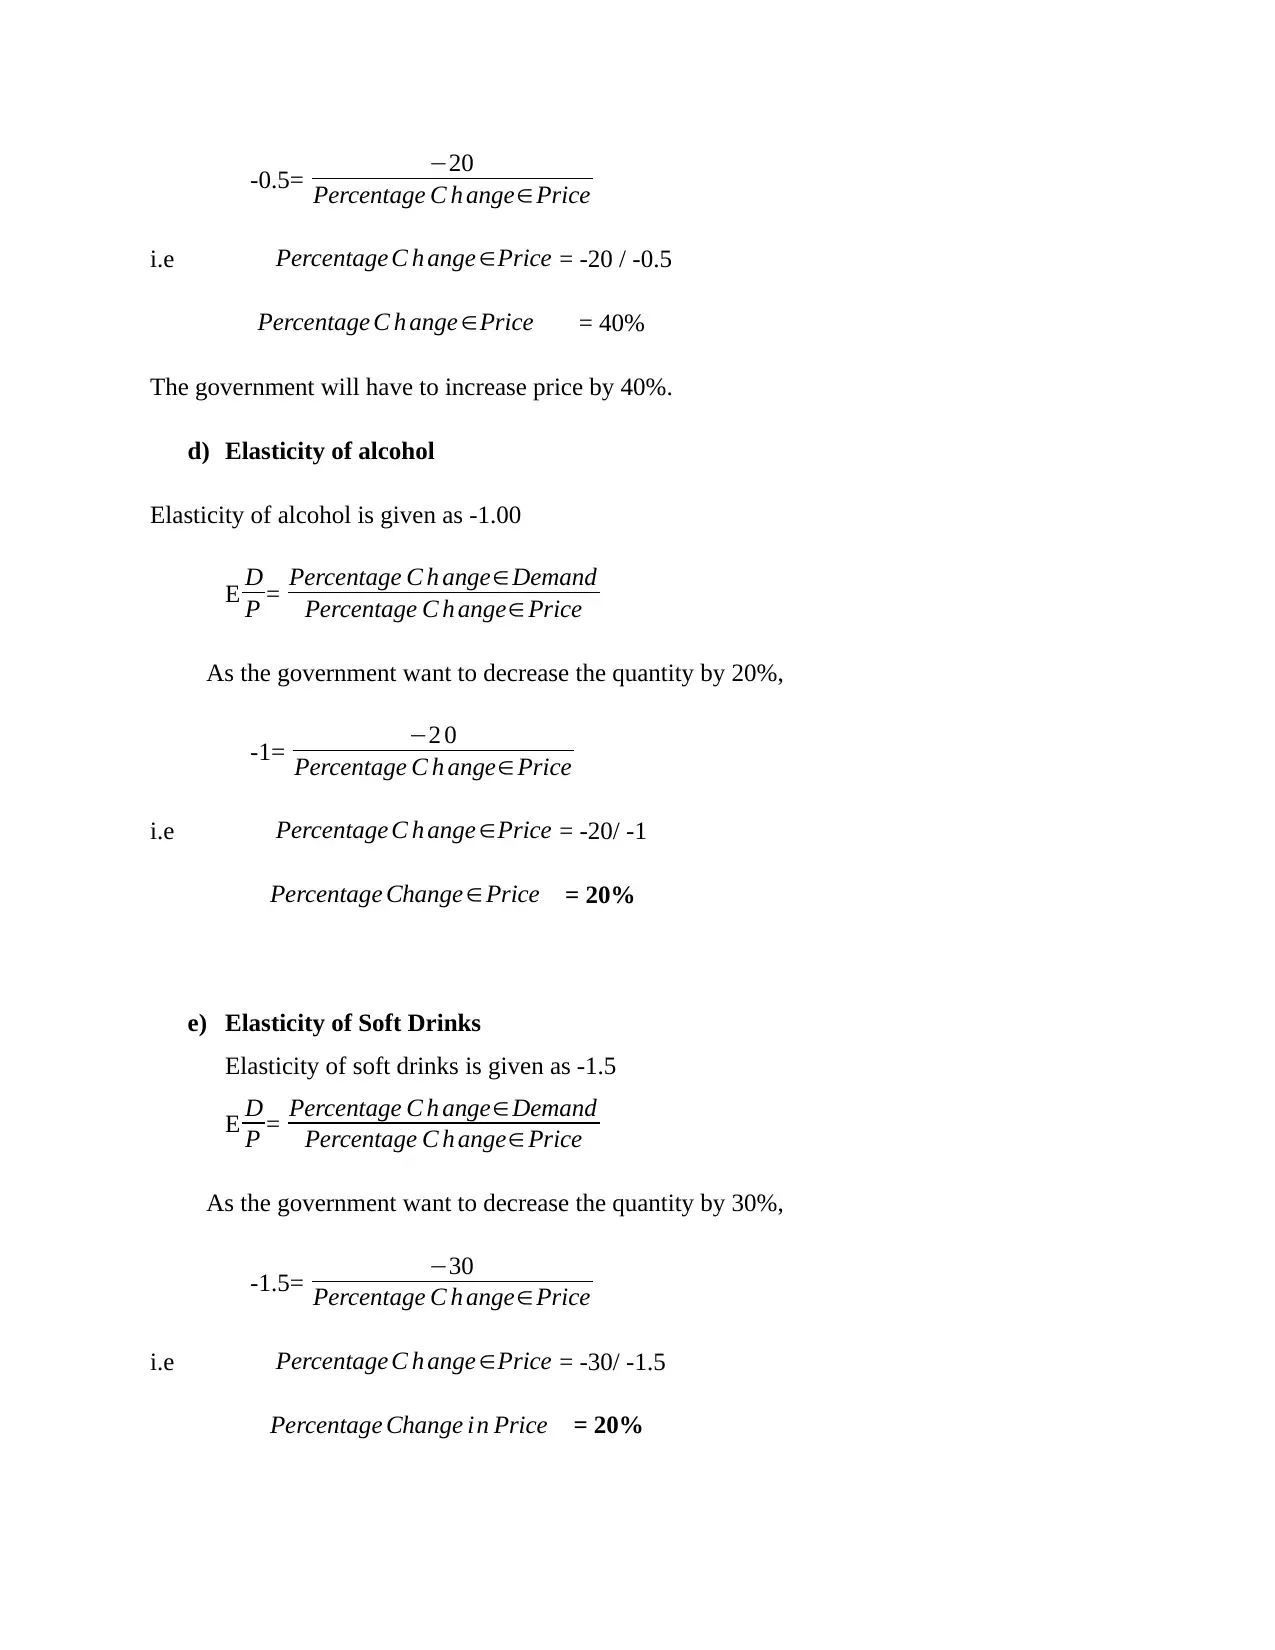
-0.5= −20
Percentage C h ange∈Price
i.e Percentage C h ange ∈Price = -20 / -0.5
Percentage C h ange ∈Price = 40%
The government will have to increase price by 40%.
d) Elasticity of alcohol
Elasticity of alcohol is given as -1.00
E D
P = Percentage C h ange∈Demand
Percentage C h ange∈ Price
As the government want to decrease the quantity by 20%,
-1= −2 0
Percentage C h ange∈Price
i.e Percentage C h ange ∈Price = -20/ -1
Percentage Change ∈Price = 20%
e) Elasticity of Soft Drinks
Elasticity of soft drinks is given as -1.5
E D
P = Percentage C h ange∈Demand
Percentage C h ange∈ Price
As the government want to decrease the quantity by 30%,
-1.5= −30
Percentage C h ange∈Price
i.e Percentage C h ange ∈Price = -30/ -1.5
Percentage Change in Price = 20%
Percentage C h ange∈Price
i.e Percentage C h ange ∈Price = -20 / -0.5
Percentage C h ange ∈Price = 40%
The government will have to increase price by 40%.
d) Elasticity of alcohol
Elasticity of alcohol is given as -1.00
E D
P = Percentage C h ange∈Demand
Percentage C h ange∈ Price
As the government want to decrease the quantity by 20%,
-1= −2 0
Percentage C h ange∈Price
i.e Percentage C h ange ∈Price = -20/ -1
Percentage Change ∈Price = 20%
e) Elasticity of Soft Drinks
Elasticity of soft drinks is given as -1.5
E D
P = Percentage C h ange∈Demand
Percentage C h ange∈ Price
As the government want to decrease the quantity by 30%,
-1.5= −30
Percentage C h ange∈Price
i.e Percentage C h ange ∈Price = -30/ -1.5
Percentage Change in Price = 20%
The government will have to impose an additional tax of 20%
Q3) Marginal and Average Costs
a) To decide the marginal costs, Carl should take into consideration the cost of last unit
produced. Profit is maximized when the marginal revenue (revenue earned from
additional unit sold) is greater than or at least equal to the Marginal costs (cost of
producing last unit).
b) Carl took the variables costs into consideration i.e the cost of labour and the cost of raw
materials. However, the Average Total Cost should include Fixed Costs. Fixed costs
include overhead and the initial investment i.e. the investment spent of $30,000. It is
possible that the manager looked at the average total costs which were greater than $6500
per unit at the given stage of production.
Average Total Costs = Variable Costs + Fixed Costs (Gravelle and Rees 2005)
Q4) Cross Elasticity between Coal and Natural Gas
Demand for natural gas follows a downward sloping curve i.e as price of natural gas decreases,
demand for natural gas increases Natural Gas can be described as a substitute and a
complementary good for coal in this case. If the price of natural gas due to fracking, then
electricity producers would prefer to divert finances towards natural gas. Thus, the demand for
coal will lower. The extent to which the demand for coal will change is calculated as below in
the calculation for cross elasticity of demand.
Exy = percentage c h ange ∈t h e Quantity Demanded of Coal
Percentage c h ange ∈t h e Quanity demanded of Natural Gas (Eastin and Arbogast 2011)
Graph 4 Cross Elasticity of Natural Gas and Coal
Source: Prepared by Author. Adapted from (Chauhan 2009)
⊘ This is a preview!⊘
Do you want full access?
Subscribe today to unlock all pages.
Trusted by 1+ million students worldwide
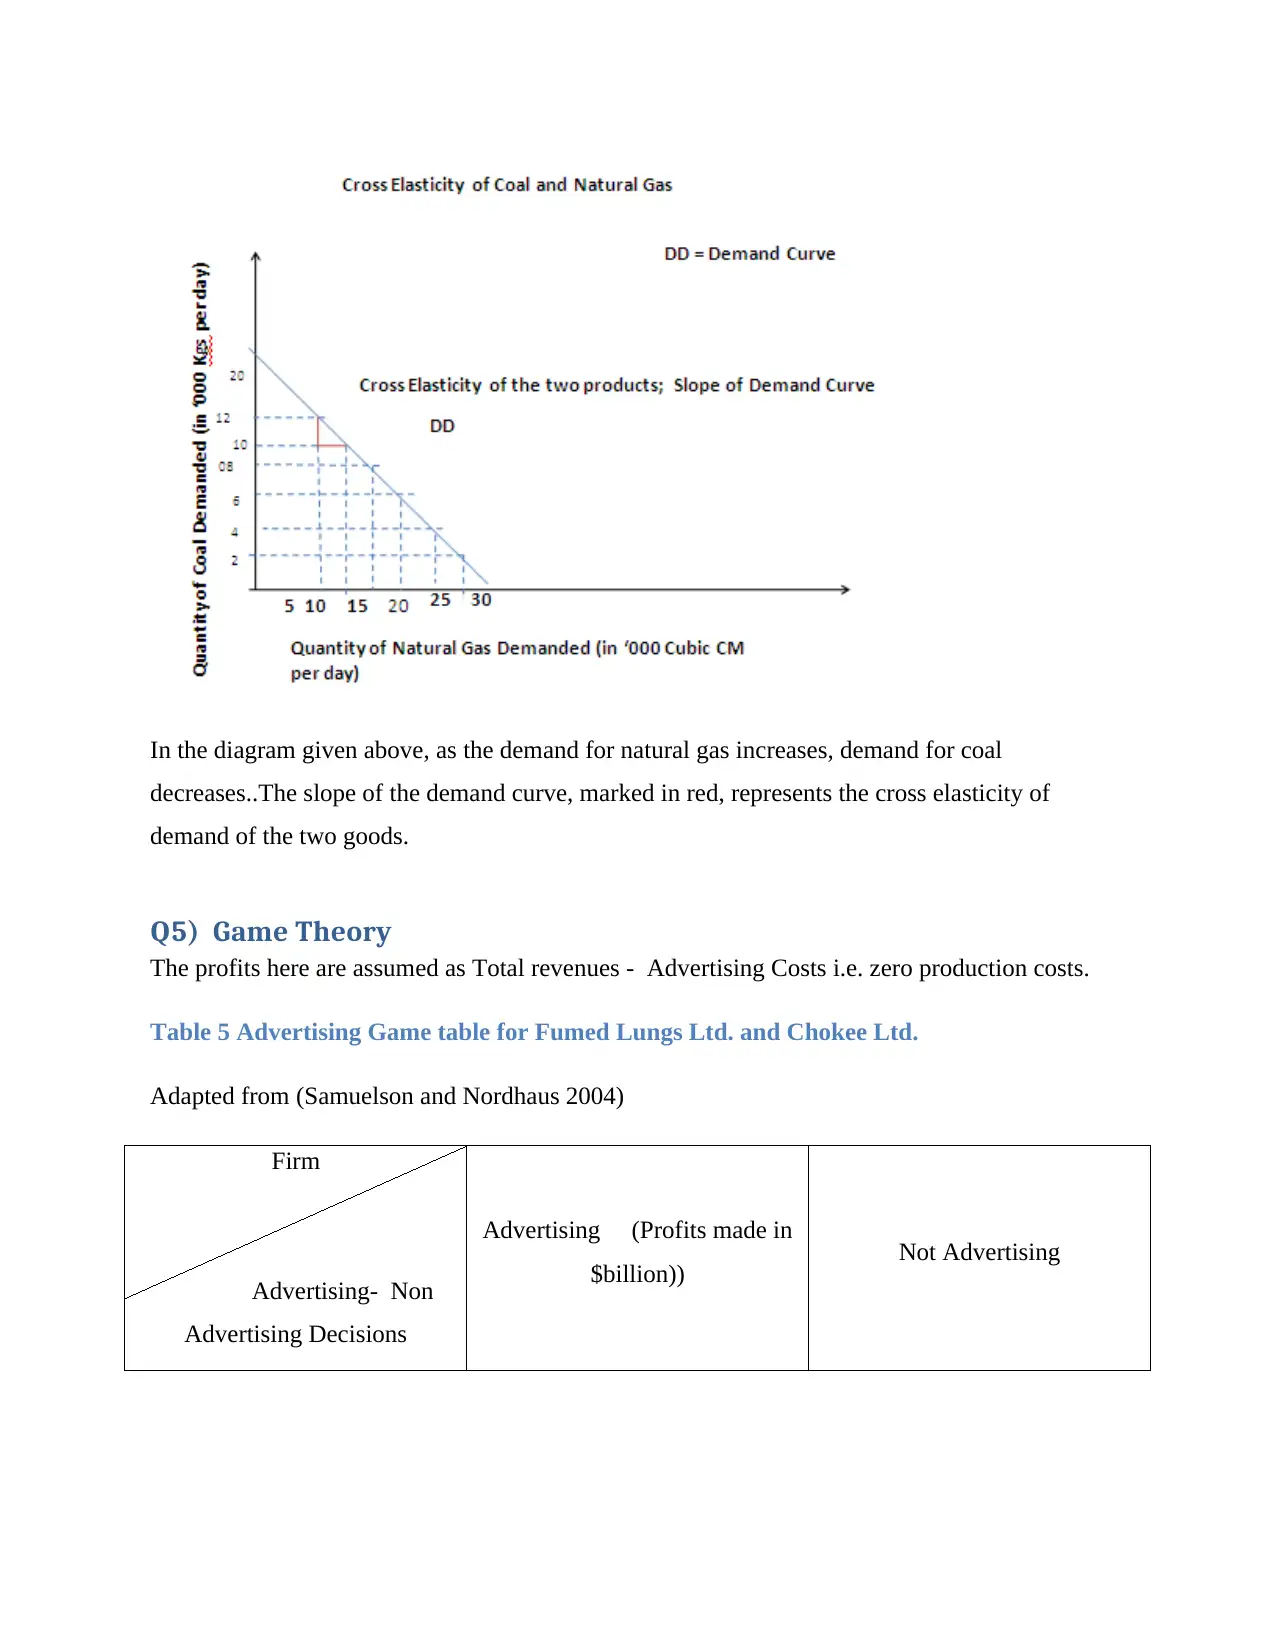
In the diagram given above, as the demand for natural gas increases, demand for coal
decreases..The slope of the demand curve, marked in red, represents the cross elasticity of
demand of the two goods.
Q5) Game Theory
The profits here are assumed as Total revenues - Advertising Costs i.e. zero production costs.
Table 5 Advertising Game table for Fumed Lungs Ltd. and Chokee Ltd.
Adapted from (Samuelson and Nordhaus 2004)
Firm
Advertising- Non
Advertising Decisions
Advertising (Profits made in
$billion)) Not Advertising
Paraphrase This Document
Need a fresh take? Get an instant paraphrase of this document with our AI Paraphraser
A
When firm B is Advertising
When
firm B is not Advertising
When Firm A is
Advertising
When
firm A is not Advertising
3
7
0
4
B
When firm A s Advertising
When firm a
is not Advertising
When Firm A is Advertising
When firm A is
not Advertising
3
7
0
4
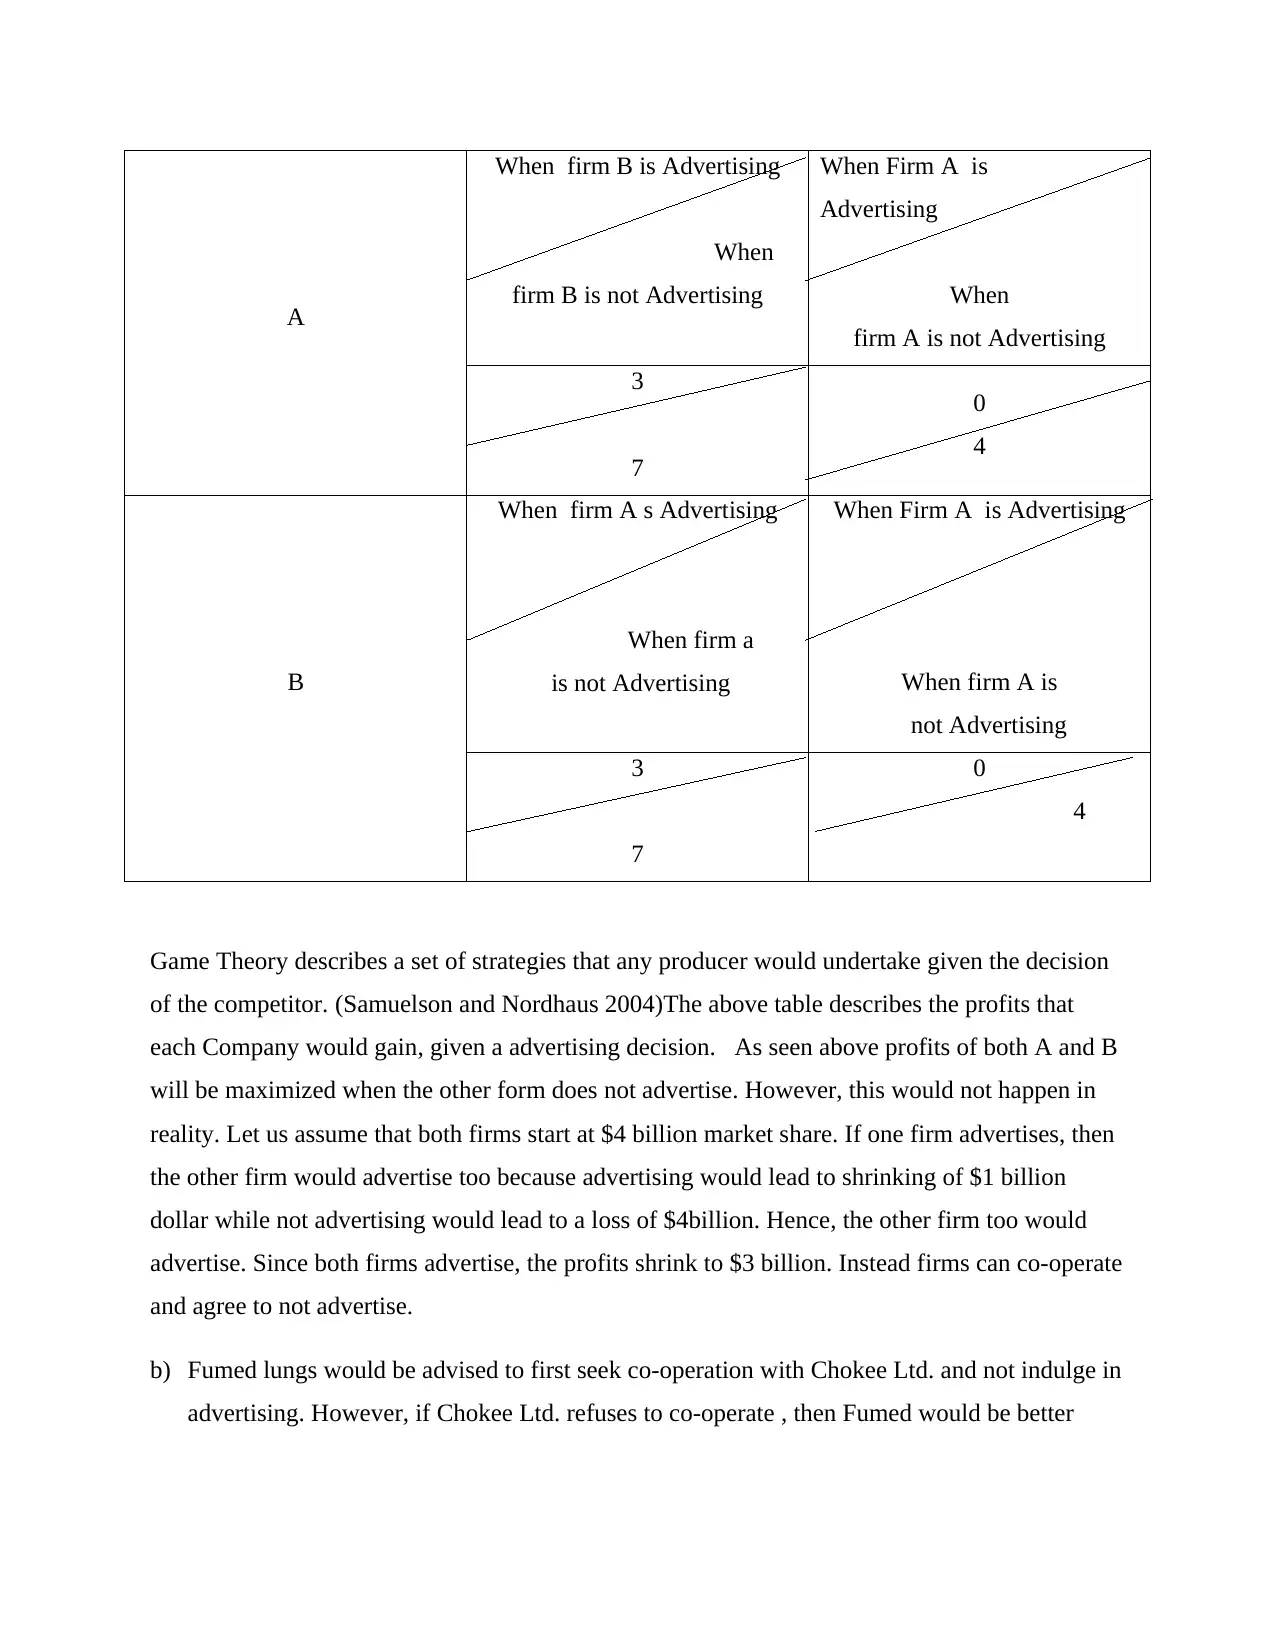
Game Theory describes a set of strategies that any producer would undertake given the decision
of the competitor. (Samuelson and Nordhaus 2004)The above table describes the profits that
each Company would gain, given a advertising decision. As seen above profits of both A and B
will be maximized when the other form does not advertise. However, this would not happen in
reality. Let us assume that both firms start at $4 billion market share. If one firm advertises, then
the other firm would advertise too because advertising would lead to shrinking of $1 billion
dollar while not advertising would lead to a loss of $4billion. Hence, the other firm too would
advertise. Since both firms advertise, the profits shrink to $3 billion. Instead firms can co-operate
and agree to not advertise.
b) Fumed lungs would be advised to first seek co-operation with Chokee Ltd. and not indulge in
advertising. However, if Chokee Ltd. refuses to co-operate , then Fumed would be better
When firm B is Advertising
When
firm B is not Advertising
When Firm A is
Advertising
When
firm A is not Advertising
3
7
0
4
B
When firm A s Advertising
When firm a
is not Advertising
When Firm A is Advertising
When firm A is
not Advertising
3
7
0
4
Game Theory describes a set of strategies that any producer would undertake given the decision
of the competitor. (Samuelson and Nordhaus 2004)The above table describes the profits that
each Company would gain, given a advertising decision. As seen above profits of both A and B
will be maximized when the other form does not advertise. However, this would not happen in
reality. Let us assume that both firms start at $4 billion market share. If one firm advertises, then
the other firm would advertise too because advertising would lead to shrinking of $1 billion
dollar while not advertising would lead to a loss of $4billion. Hence, the other firm too would
advertise. Since both firms advertise, the profits shrink to $3 billion. Instead firms can co-operate
and agree to not advertise.
b) Fumed lungs would be advised to first seek co-operation with Chokee Ltd. and not indulge in
advertising. However, if Chokee Ltd. refuses to co-operate , then Fumed would be better
advised to follow the leadership of Chokee i.e advertise of Chokee advertises and do not
advertise , if the other firm does not advertise.
c) Both firms will try to maximize their own profits. Initially, both firms do not know if the
other firm would follow suit. Hence, both firms would try to advertise to retain the entire
market. Thus, both firms will indulge in non-cooperative games. (Samuelson and Nordhaus
2004)
d) The optimal solution is to co-operate and seek $4billion profits by not advertising. However,
firms would not be sure of the outcome if they did not advertise. The loss of non-advertising
strategy is $8 billion. Hence, both firms will not be able to achieve it.
Q6) Project Costs and Benefits
Let the investment be described as the Coal Mine Project. The profits of the coal mine
would be accrued over 30 years. The Company may have decided that the cash flows that
would be paid out in the future as a result of forgoing present profits, would be greater
than the sacrifices today I.e the future value of the Company is greater than the Present
Value of the Company, today. (Frederick 1999)
While investing , firms try to estimate to estimate future cash inflows (expected earnings
and other gains) and Cash Out Flows (expected costs). The firm would , generally, set a
discount rate at which future gains would be more profitable than current use of the cash
that was invested in the plant. This process is known as “discounting” of investment.
(Frederick 1999)
The future gains would be higher if the access to infrastructure helps Yancoal drive other
firms out of the market or help it achieve another significant advantage. Thus, future
gains are subject to a variety of factors. (Government of Commonwealth of Australia
2006)
This is also known as a costs benefit analysis since the costs are weighed against the
benefits in the future. (Government of Commonwealth of Australia 2006)
Q7) Vehicular Insurance
In the first case, the monitoring device may help understand the driving behavior of a person.
This may help the firm understand the risk that is associated with the driver. If the driving skills
⊘ This is a preview!⊘
Do you want full access?
Subscribe today to unlock all pages.
Trusted by 1+ million students worldwide
1 out of 14
Related Documents


Your All-in-One AI-Powered Toolkit for Academic Success.
+13062052269
info@desklib.com
Available 24*7 on WhatsApp / Email
![[object Object]](/_next/static/media/star-bottom.7253800d.svg)
Unlock your academic potential
Copyright © 2020–2026 A2Z Services. All Rights Reserved. Developed and managed by ZUCOL.