HI5003 Economics for Business: Qantas Airways Report and Analysis
VerifiedAdded on 2022/12/19
|19
|4134
|117
Report
AI Summary
This economics assignment analyzes Qantas Airways Limited, a major Australian airline, within the context of the Australian economy. The report begins with an introduction to Qantas, its background, and its contribution to the Australian economy, followed by an overview of the Australian economic conditions including GDP, inflation, and unemployment rates. The assignment then delves into the market structure, specifically focusing on the oligopoly market structure and its features, followed by a comparison of Qantas's performance with its main rival, Virgin Australia. The core of the report examines the factors influencing supply and demand, including income, costs, technology, and promotional activities. The concept of elasticity of demand is explored, with determinants and influencing factors discussed. The report concludes with a market analysis, identifying relevant economic events affecting Qantas, and a conclusion summarizing the key findings. Appendices provide supporting economic data, such as GDP, inflation, unemployment, and foreign exchange rates. The report applies economic principles to assess Qantas's market position and performance within the Australian aviation industry.
ECONOMICS ASSIGNMENT.
QANTAS AIRWAYS LIMITED
Name:
Institution:
Date:
QANTAS AIRWAYS LIMITED
Name:
Institution:
Date:
Paraphrase This Document
Need a fresh take? Get an instant paraphrase of this document with our AI Paraphraser
ECONOMICS ASSIGNMENT
Table of Contents
1.0 INTRODUCTION....................................................................................................................1
1.1 Firm’s Background Information........................................................................................1
1.2. Australian Economic Condition.......................................................................................1
2.0 INFORMATION STRUCTURE OF MARKET....................................................................3
2.1. Oligopoly Market structure...............................................................................................3
2.1.1. Features of Oligopoly Market Structure.................................................................3
2.2. Rivals performance based on the market share..........................................................4
3.0 Factors that determine Supply and Demand.....................................................................5
3.1 Factors determining the demand.....................................................................................5
3.1.1 Income..........................................................................................................................5
3.1.2 Cost of Complementary goods.................................................................................5
3.1.3. The number of buyers due to promotional activities............................................5
3.2 Factor determining the supply..........................................................................................5
3.2.1. The Cost of Inputs.....................................................................................................5
3.2.2. Use of technology......................................................................................................5
3.2.3. Weather Conditions...................................................................................................6
4.0 Elasticity of Demand..............................................................................................................7
4.1 Determinants of Elasticity.................................................................................................7
4.1.1. The Level of Price......................................................................................................7
4.1.2. Cross elastic demand................................................................................................7
4.1.3. The price elastic demand.........................................................................................7
4.2 Factors determining elastic demand...............................................................................7
4.2.1. Substitutes..................................................................................................................7
4.2.2. Alternative Use of product........................................................................................7
ii
ECONOMICS ASSIGNMENT
4.2.3. Cost Limit....................................................................................................................8
4.2.4. Earnings Limit.............................................................................................................8
5.0 Market Analysis (Identify an event).....................................................................................9
6.0 Conclusion.............................................................................................................................10
Bibliography.................................................................................................................................11
APPENDICES..............................................................................................................................13
Appendix 1: GDP of Australia from 2001-2017..................................................................13
Appendix 2: The rate of Inflation in Australia from 2016-2019........................................14
Appendix 3: Rate of Unemployment in Australia from Apr 2018-Jan 2019...................15
Appendix 4: Australian Foreign exchange rate from 1991-2007.....................................16
iii
⊘ This is a preview!⊘
Do you want full access?
Subscribe today to unlock all pages.
Trusted by 1+ million students worldwide
ECONOMICS
QANTAS AIRWAYS LIMITED
1.0 INTRODUCTION
1.1 Firm’s Background Information.
Qantas Airways Company originated in Australia. It is a local and transnational
airline company. The Company is involved in the local and international air conveyance
activities, delivery of cargo activities and everyday flyer loyalty program (White, 2018).
Qantas has several sections which includes Qantas Domestic: commercial, customer,
marketing and operational arm, Qantas International, Jetstar Group operates in
Australia, Japan and New Zealand, Qantas Freight for air cargo and express freights
trades. The Qantas and Jetstar Group units are greatly involved in passengers flying
trades. The Qantas Consignment section is involved in the air shipment and direct
consignment trade (Shaffner, et al., 2017).
The Qantas Loyalty department is involved in the client allegiance appreciation
programs currently it has 12million members who have subscribed. Qantas foremost
operation is the transporting of clients to various destinations of the world with their
commonly known airline trademarks the Qantas and Jetstar (de Boer, 2018). The
company also has supplementary airline activities, like for instance, Q-Catering and
snap fresh. Qantas Airways company is a Public Company performing very well among
the best 20 firms in Australia. Qantas business possesses a fleet of over 313 aircraft
which includes 13 committed cargo airplanes and provides their services to global and
regional landing places (Lin, et al., 2018).
The company is estimated to have made approximately $17 Billion total income
and revenue in the year 2018, that is according to their website information provided.
The company has also an estimated 27,000 employees (de Boer, 2018). Currently the
company Chief executive officer is Mr. Allan Joyce. Qantas business contributes to the
Australian economy by injecting cash revenues which represents 0.7 per cent of the
Australian GDP (Fernando, 2018). The company supports and provides jobs to over
hundreds of thousands jobless Australian every year thereby reducing the
unemployment rate in Australia, this is in line with the government goals of addressing
unemployment under the tourism act 2020 which seeks to develop employment and
maintain industries, improving regional labour force organisation and expansion, finding
education and teaching openings and possible measures to tackle them and lastly,
helping the employees movement and increasing the traditional labour force (Karlson,
2018).
1.2. Australian Economic Condition.
Tourism in Australia contributed greatly in the economy, approximately 3.2 per
cent to GDP and 4.9 per cent to employment in the fiscal year 2016/2017. The research
studies reveal that the progression rate of GDP in Australia for the financial year starting
from 2001 to 2017 as indicated in the appendix 1. The GDP progressed by 6.1 percent
in the year 2017 compared to the preceding year (Hamilton & Webster, 2018). In
overall, the leading progression was recorded in the fiscal year 2001 with a progression
rate of 17.8%, perhaps this was due to the Olympics tournament which were held in
Sydney that year (Van Hoa, et al., 2018).
1
Paraphrase This Document
Need a fresh take? Get an instant paraphrase of this document with our AI Paraphraser
ECONOMICS
The Australian yearly price increase frequency dropped in the first few months of
2019 to 1.3% as compared to the preceding months of late 2018 which stood at 1.8%,
there was a missing market opportunities of approximately1.5% which was the
lowermost price increase frequency ever since mid-year of 2016, during a go-slow in
gasoline and dwelling cost as indicated in the appendix 2. On a four times a year
foundation, purchaser cost was uniform in March 2017, the puniest month price
increase frequency experienced after several years, after a less than 1% increase in the
preceding months, lower market agreement of less than 1%. Price increase frequency
was close to 5% since 1951 up to date, attainment of unprecedented great record close
to 24% in 1951 and a low record of negative 1% in 1962 (Bishop & Cassidy, 2017).
Australia joblessness rate increased to 5.0% in March 2019 from almost 8 years
of 4.9% in the preceding month and equivalent market opportunities. The economy
increased to approximately 25,700 new employments although the figure for jobless
rose by over 17,100 (Gregory & Smith, 2016). Joblessness Rate in Australia was close
to 6.84% since the year 1978 up to 2019, where the figure reached an unprecedented
rise of 11.2% in 1992 and it also a low record of 4% in the year 2008 as indicated in the
appendix 3 (Carvalho, 2015).
The United States against Australian dollar (USD / AUD) is the main currency
pair traded in the Australian Stock exchange market. AUD / USD accounts for 45% of
total foreign exchange revenue, a comparable amount to that documented in the
preceding assessment as indicated in the Appendix 4. Conversely, comparable to
patterns witnessed in the international forex market, the distribution of revenue by legal
tender pair has risen ever since the year 2004. Australian revenue in the United states
dollar against Euro (USD/EUR) and United states dollar against Japanese yen (USD /
JPY) was consistently less as compared to 3 years before, nonetheless trades in United
States dollar against New Zealand dollar (USD / NZD), United States dollar against
Swiss Franc (USD / CHF) and the other major currency groupings which primarily
includes Asian and other developing-market exchanges improved remarkably as
percentage of whole revenue (Jahanshahloo & Cai, 2019).
2
ECONOMICS
2.0 INFORMATION STRUCTURE OF MARKET.
2.1. Oligopoly Market structure.
An oligopoly is a market structure which is controlled by a limited number of
companies. Whenever a market is dominated by a limited number of companies, it is
assumed to be extremely concentrated. Even though simply limited companies control,
it is likely that numerous insignificant number of companies are also in operational in the
market (Kumar & Kutlu, 2016). For instance, major airlines like United Emirates
and Virgin Australia also manoeuvre their directions with only a limited close rival.
However, there are also numerous insignificant airlines providing other expert service.
2.1.1. Features of Oligopoly Market Structure.
2.1.1.1. Few Sellers.
In Oligopoly market structure, there are few sellers and the several buyers.
Limited companies controlling the entire market and the prices of the product.
Interdependence. An essential feature of Oligopoly market structure. The seller has to
be careful when the rival company takes any action. Should any company make a price
change the all the other companies operating in the market which are few in nature
must comply with the price change in order to remain relevant and in competition in the
market. The few firms remain alert with what is happening with their rival. This shows
that there is total interdependence between sellers concerning price and output.
2.1.1.2. Advertising.
In Oligopoly market structure, each company publicises and promote their goods
and services regularly with a goal to reach numerous client and rise their clientele base.
Adverts make competition powerful.
Competition.
It is sincere that with a limited firm in the market, there will be a powerful struggle
between the traders. Any step by a company has a significant influence on its
competitors. Therefore, each trader is vigilant with what their competitors are doing and
they immediately counter-offend.
2.1.1.3. Entry and Exit Barriers.
The companies be able to exit the market at any time but are there exist
hindrances to joining the market. The hindrances include the Patency rights, high capital
requirement, Government licence among others.
2.1.1.4. Lack of Standardization.
There exists no standardisation between the companies considering their size,
others are bigger while others are small. Considering the fact that there are fewer
number of companies any act used by one company has a significant influence on the
other companies. Hence, each company is vigilant on its rivals and therefore organize
the publicity undertakings consequently (Buckley & Casson, 2016).
3
⊘ This is a preview!⊘
Do you want full access?
Subscribe today to unlock all pages.
Trusted by 1+ million students worldwide
ECONOMICS
2.2. Rivals performance based on the market share.
Qantas Airways Limited main rival in the Australian market is Virgin Australia.
The company enjoys on average a massive $3.8 Billion in terms of income and
revenues per year as compared to their counterpart the Qantas which enjoys on
average an enormous revenue of $12Billion annually. Virgin Australia has a total
number of employee which exceed 10,000 and velocity members of over 9 million. It
operates a fleet of 133 ranging from air cargo to passenger flying trades to over 460
destinations across the world.
Virgin Australia was the first to launch and exploit the US Flight market a decade
ago. Their flights account for a close to 23 percent share of the 2 million passengers
that made flights between Australia and Los Angeles in Fiscal year 2018 and a 14 per
cent share of the 3.19 million passengers flying from Australia to United States. Virgin
Australia 6.5 per cent growth in the Fiscal year 2018 was to some extent quicker than
the whole 4.5 per cent market growth (Zhang, et al., 2017). Virgin Australia also came
close to launch Sydney to New York direct flights but the board failed to ratify the
strategy. After a decade their main competitors Qantas is contemplating to acquire a
different aircraft from Sydney to New York which will permit it to additionally increase
the gap with Virgin Australia.
4
Paraphrase This Document
Need a fresh take? Get an instant paraphrase of this document with our AI Paraphraser
ECONOMICS
3.0 Factors that determine Supply and Demand
3.1 Factors determining the demand.
3.1.1 Income.
For a growing economy the resident will have their average income increasing.
Air ticket act as a normal good, since a rise in revenue results in demand increase for
air ticket bought. For instance, a household in good economic condition might travel
through Air frequently.
3.1.2 Cost of Complementary goods.
In this case a variation in value of a product might influence the demand of other
related product. In flight business, cost of petroleum has undeviating effect on the
number of those willing to purchase the air ticket. An increase in cost of fuel leads to the
industry increasing its air ticket in order to retain its income. There is an existence of
complimentary relationship between fuel cost and air ticket prices. An increase in
petroleum products results into a decline in the number of those willing to buy air ticket.
3.1.3. The number of buyers due to promotional activities.
As purchasers increase in the business, the more the number of those willing to
buy air ticket. During the promotional event in the airline industries, more air ticket
buyers will be willing to purchase the air ticket. The buyers will be enticed by a reduction
in prices especially during low peak season. The air ticket demand goes up and the and
in return the industry will make more profit despite the air ticket selling at lower prices
but in large volume hence gaining through the economies of scale.
3.2 Factor determining the supply.
3.2.1. The Cost of Inputs.
Whenever the cost of manufacturing products rises, the quantity in circulation will
go down. In the airline business, fuel is the chief input while extra adjustable remaining
constant. When the petroleum prices go up, there will be a decline in the flights made
per day hence the revenue will greatly decline.
3.2.2. Use of technology.
The use of better and improved technology moves the curve representing the
quantity in circulation to the right. This simply means that cost will reduce and the
quantity will increase. Technological progression acts a significant part in the aircraft
business. The business is doing their greatest possible to get improved expertise that
might help in petroleum management. The industries also are working with the
companies that manufacture engine to come up with an engine that can help reduce
and regulate fuel consumption of flight. Improved technology will ensure more flights are
in operation while consuming the same amount of fuel they are using (Pigou, 2017).
5
ECONOMICS
3.2.3. Weather Conditions.
Aircraft uses air transportation, the weather condition in most cases is a huge
problem in the business. A substantial snowfall through wintertime may interrupts the
taking-off and landing stage of air flights. Regrettably, weather cannot be manipulated
by human beings, the industry has only a duty of care to provide their customers with
safety facilities which is not guarantee to safety in case of vagaries of nature including
bad weather condition.
6
⊘ This is a preview!⊘
Do you want full access?
Subscribe today to unlock all pages.
Trusted by 1+ million students worldwide
ECONOMICS
4.0 Elasticity of Demand.
Elasticity is an estimate of the proportionate variation of a variable in reaction to
variation in another variable. It indicates how easy a trader and consumer can adjust
their conduct and go for another product due to the power of motivation over selections
per the comparative value of the next best forgone alternative. Below are the factors of
elasticity (de Rassenfosse, 2019).
4.1 Determinants of Elasticity.
4.1.1. The Level of Price.
Elasticity of supply is also expected to differ at diverse prices. As a result, when
the cost of a product is comparatively increasing, the manufacturers are expected to be
providing near the restrictions of their capacity and would, therefore, be not be capable
to make much reply to an increasing price. When the price is comparatively lower the
manufacturers may have extra capacity which a higher price would persuade them to
use.
4.1.2. Cross elastic demand.
The cross elastic demand is a financial perception that estimates the sensitivity in
the quantity demanded of one product when the price for another product vary. The
cross-elastic demand is the proportional variation in the quantity demanded of a product
resulting from a proportional variation in the cost of alternative product.
4.1.3. The price elastic demand.
The price elastic is an estimate of the sensitivity of demand to variations in the
product cost. When the variations in cost are minimal, we use an estimate of the
sensitivity of demand the point elastic demand. When the variations in cost are big, we
use the arc elastic demand as the appropriate estimate.
4.2 Factors determining elastic demand.
4.2.1. Substitutes.
Demand is flexible for the products with alternatives and inflexible for the
products with no alternatives. The accessibility of alternative products decides the
elastic demand. For example, butter and margarine are alternative goods. The variation
in the cost of butter influence the demand for margarine. Therefore, the demand for
margarine and butter is said to be flexible (Todorov & Akbar, 2018).
4.2.2. Alternative Use of product.
Elastic demand for some product is determined by the number of alternative
uses. The demand is said to be elastic if a product has got more than one use and it is
said to be inflexible when it has a single usage. The petroleum has several alternative
7
Paraphrase This Document
Need a fresh take? Get an instant paraphrase of this document with our AI Paraphraser
ECONOMICS
usages, when the cost for petroleum go down, the demand for coal will go up hence
individual will use it more in cooking, heating and industrial functions. On the contrary
when the price for coal goes up, the individual using coal will reduce it usage greatly.
4.2.3. Cost Limit.
The demand is flexible for reasonable costs nonetheless it is inflexible for low
and high cost. The high income earners and the low income earners worry less on the
cost of the products they purchase. For instance, the rich will purchase gold and
diamonds irrespective of the cost. On the other hand, the poor will purchase low quality
rice and cloths irrespective of their price.
4.2.4. Earnings Limit.
The demand is inflexible for high and low earning individuals and flexible for
averaged earning individuals. The high income earning individuals with high revenue
worry less on the prices. They may remain purchasing the same quantity of product
irrespective of the price. The poor individual with low income will continue to purchase
the minimum requirement, therefore, they are convinced neither to purchase extra
goods at a low cost nor fewer at a high cost. The average paid individual is responsive
to the variation in cost. Therefore, they purchase extra at a low cost and fewer at high
cost (Na, 2016).
8
ECONOMICS
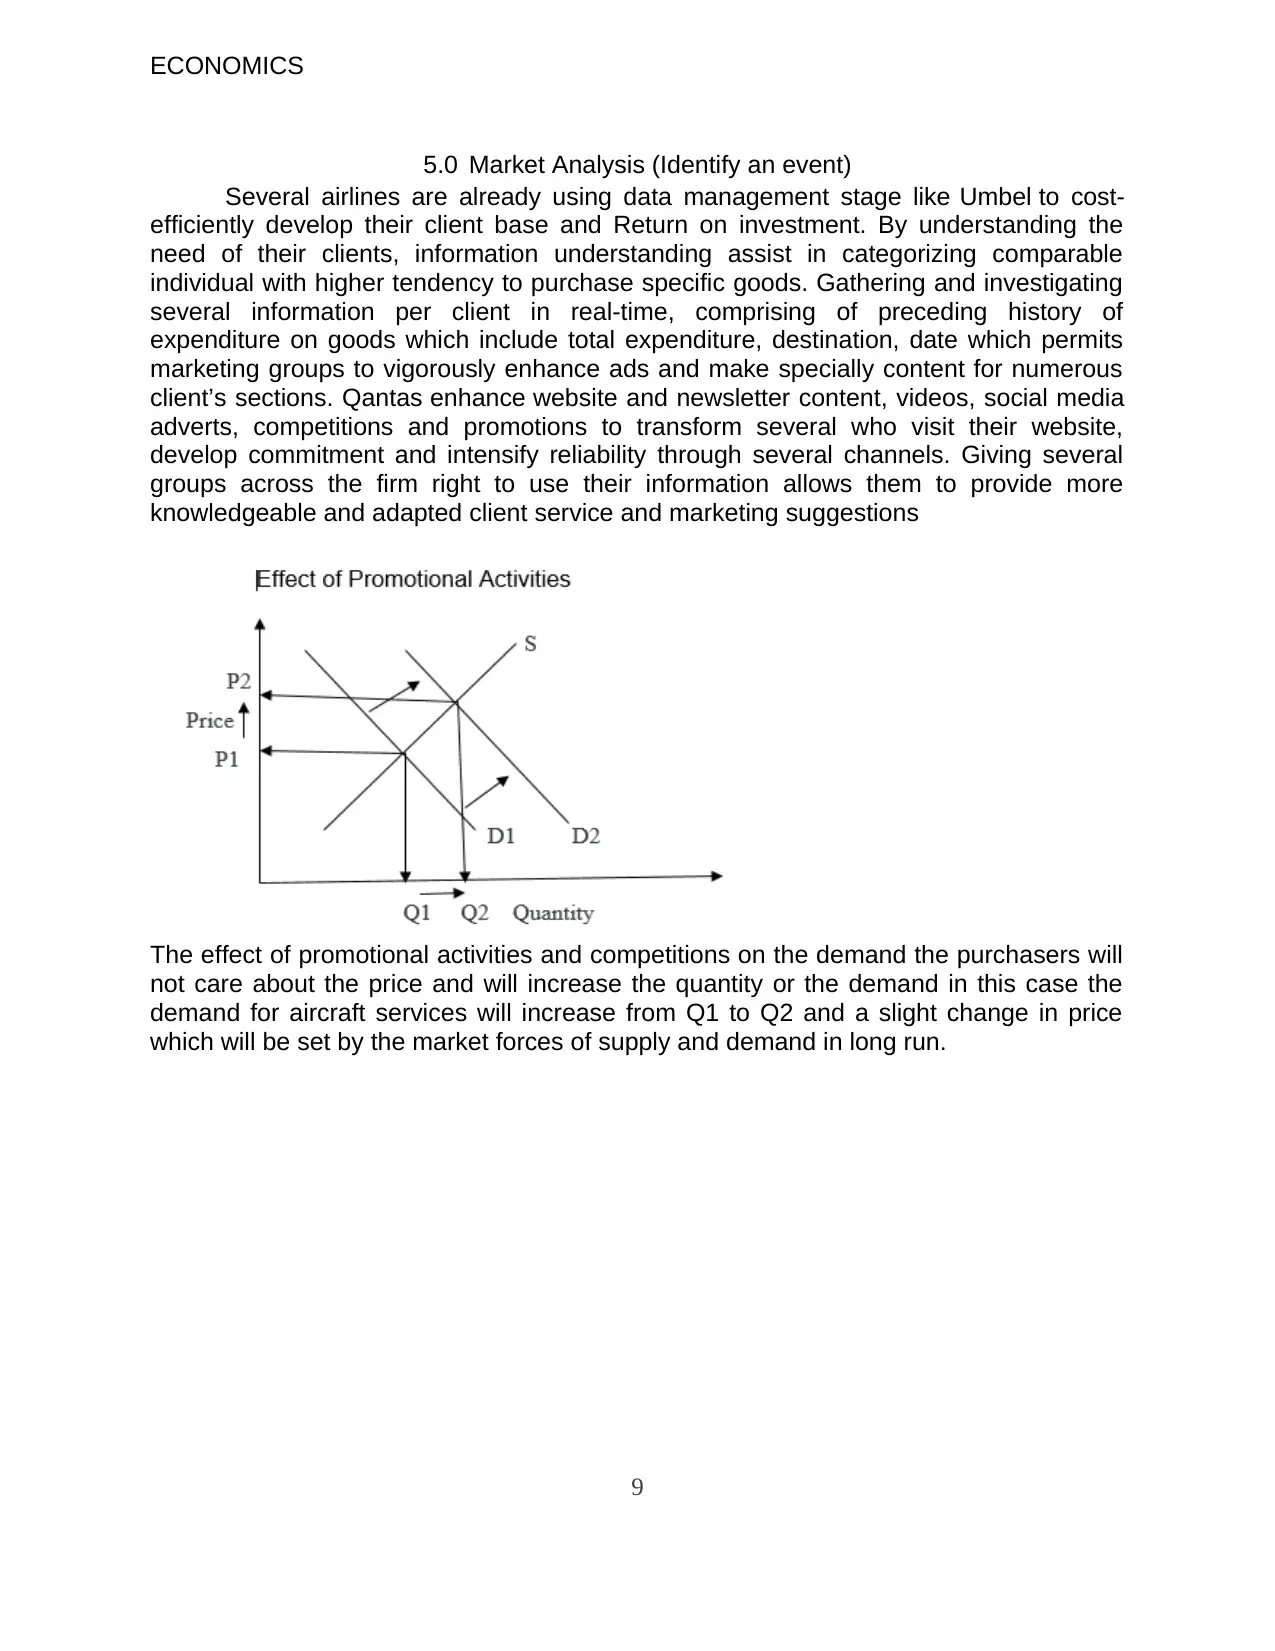
5.0 Market Analysis (Identify an event)
Several airlines are already using data management stage like Umbel to cost-
efficiently develop their client base and Return on investment. By understanding the
need of their clients, information understanding assist in categorizing comparable
individual with higher tendency to purchase specific goods. Gathering and investigating
several information per client in real-time, comprising of preceding history of
expenditure on goods which include total expenditure, destination, date which permits
marketing groups to vigorously enhance ads and make specially content for numerous
client’s sections. Qantas enhance website and newsletter content, videos, social media
adverts, competitions and promotions to transform several who visit their website,
develop commitment and intensify reliability through several channels. Giving several
groups across the firm right to use their information allows them to provide more
knowledgeable and adapted client service and marketing suggestions
The effect of promotional activities and competitions on the demand the purchasers will
not care about the price and will increase the quantity or the demand in this case the
demand for aircraft services will increase from Q1 to Q2 and a slight change in price
which will be set by the market forces of supply and demand in long run.
9
⊘ This is a preview!⊘
Do you want full access?
Subscribe today to unlock all pages.
Trusted by 1+ million students worldwide
1 out of 19
Related Documents


Your All-in-One AI-Powered Toolkit for Academic Success.
+13062052269
info@desklib.com
Available 24*7 on WhatsApp / Email
![[object Object]](/_next/static/media/star-bottom.7253800d.svg)
Unlock your academic potential
Copyright © 2020–2026 A2Z Services. All Rights Reserved. Developed and managed by ZUCOL.