Economics and Quantitative Analysis: Linear Regression of RR and GR

Verified

Added on  2023/04/26

|7
|1771
|365
Report
AI Summary
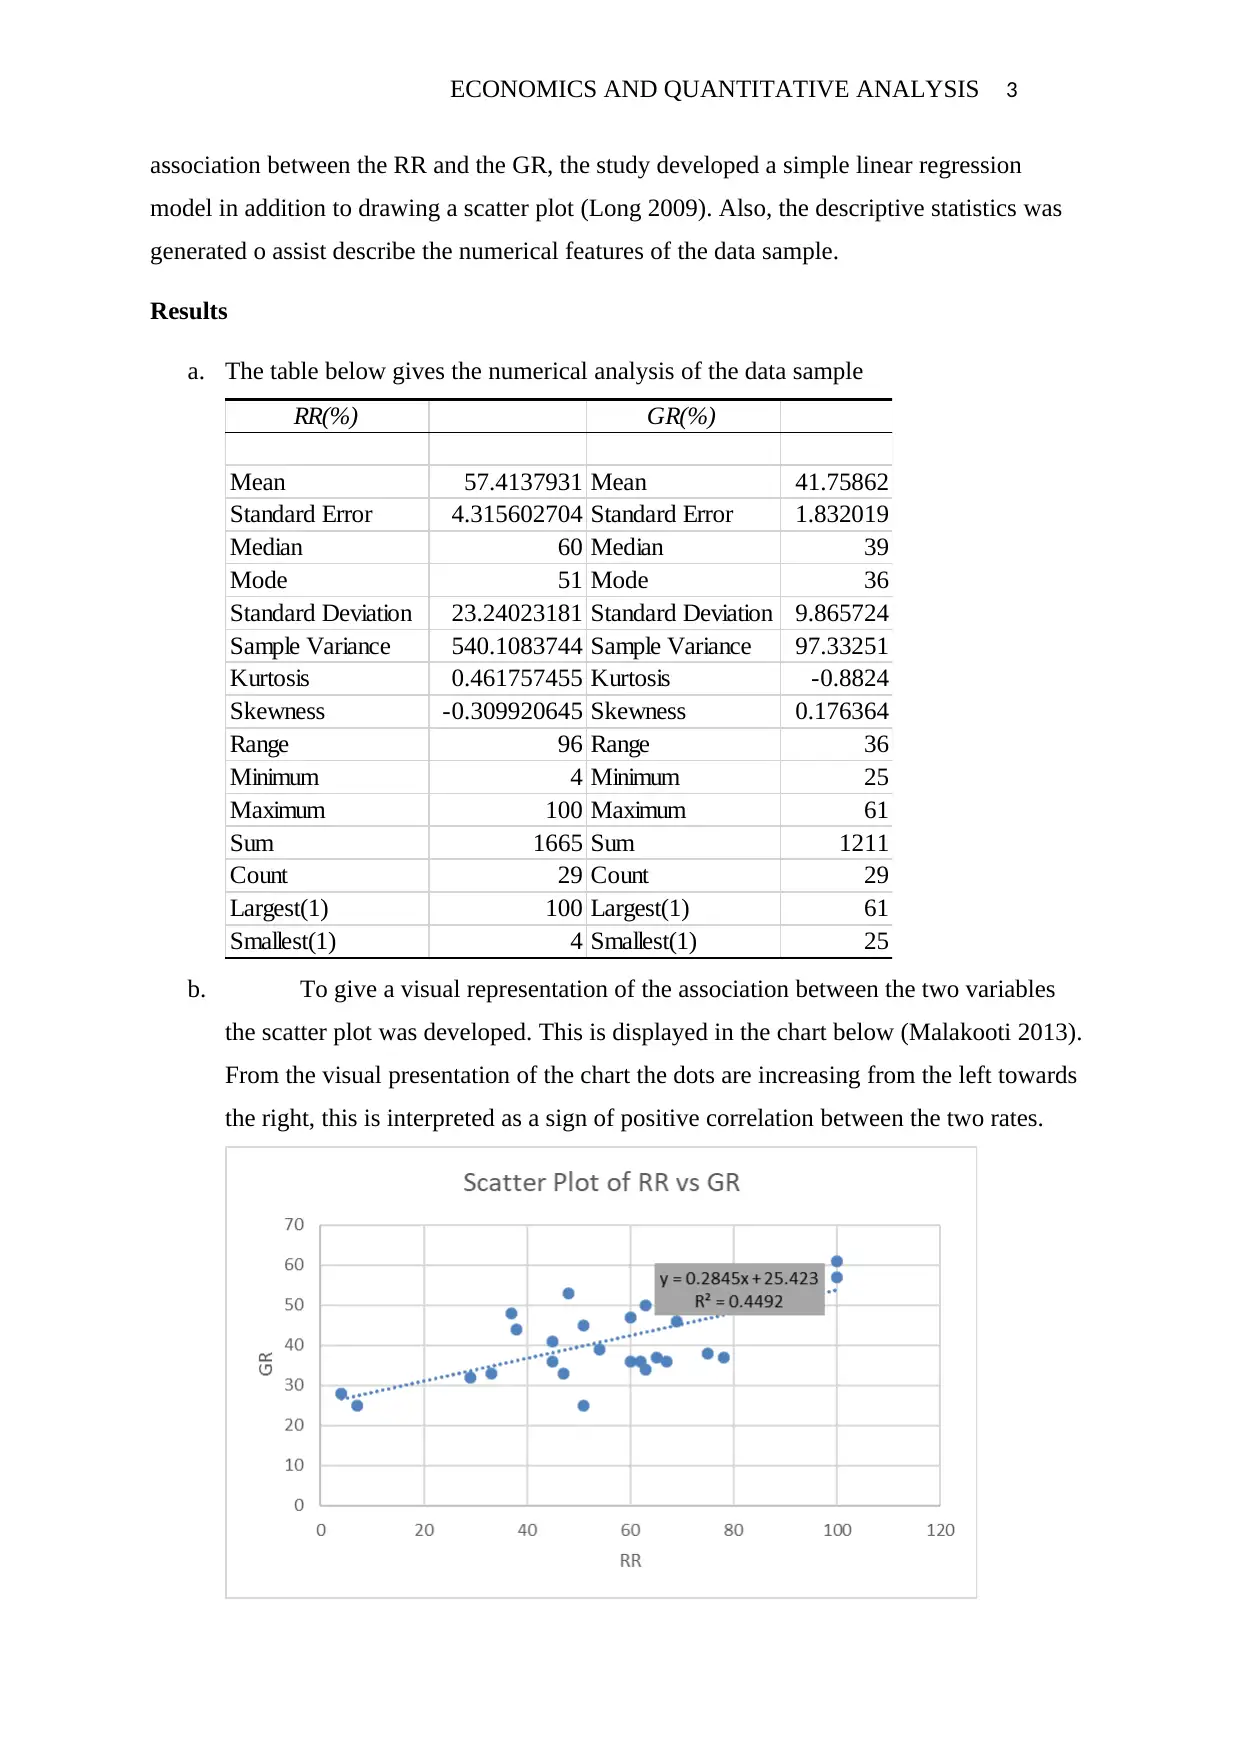
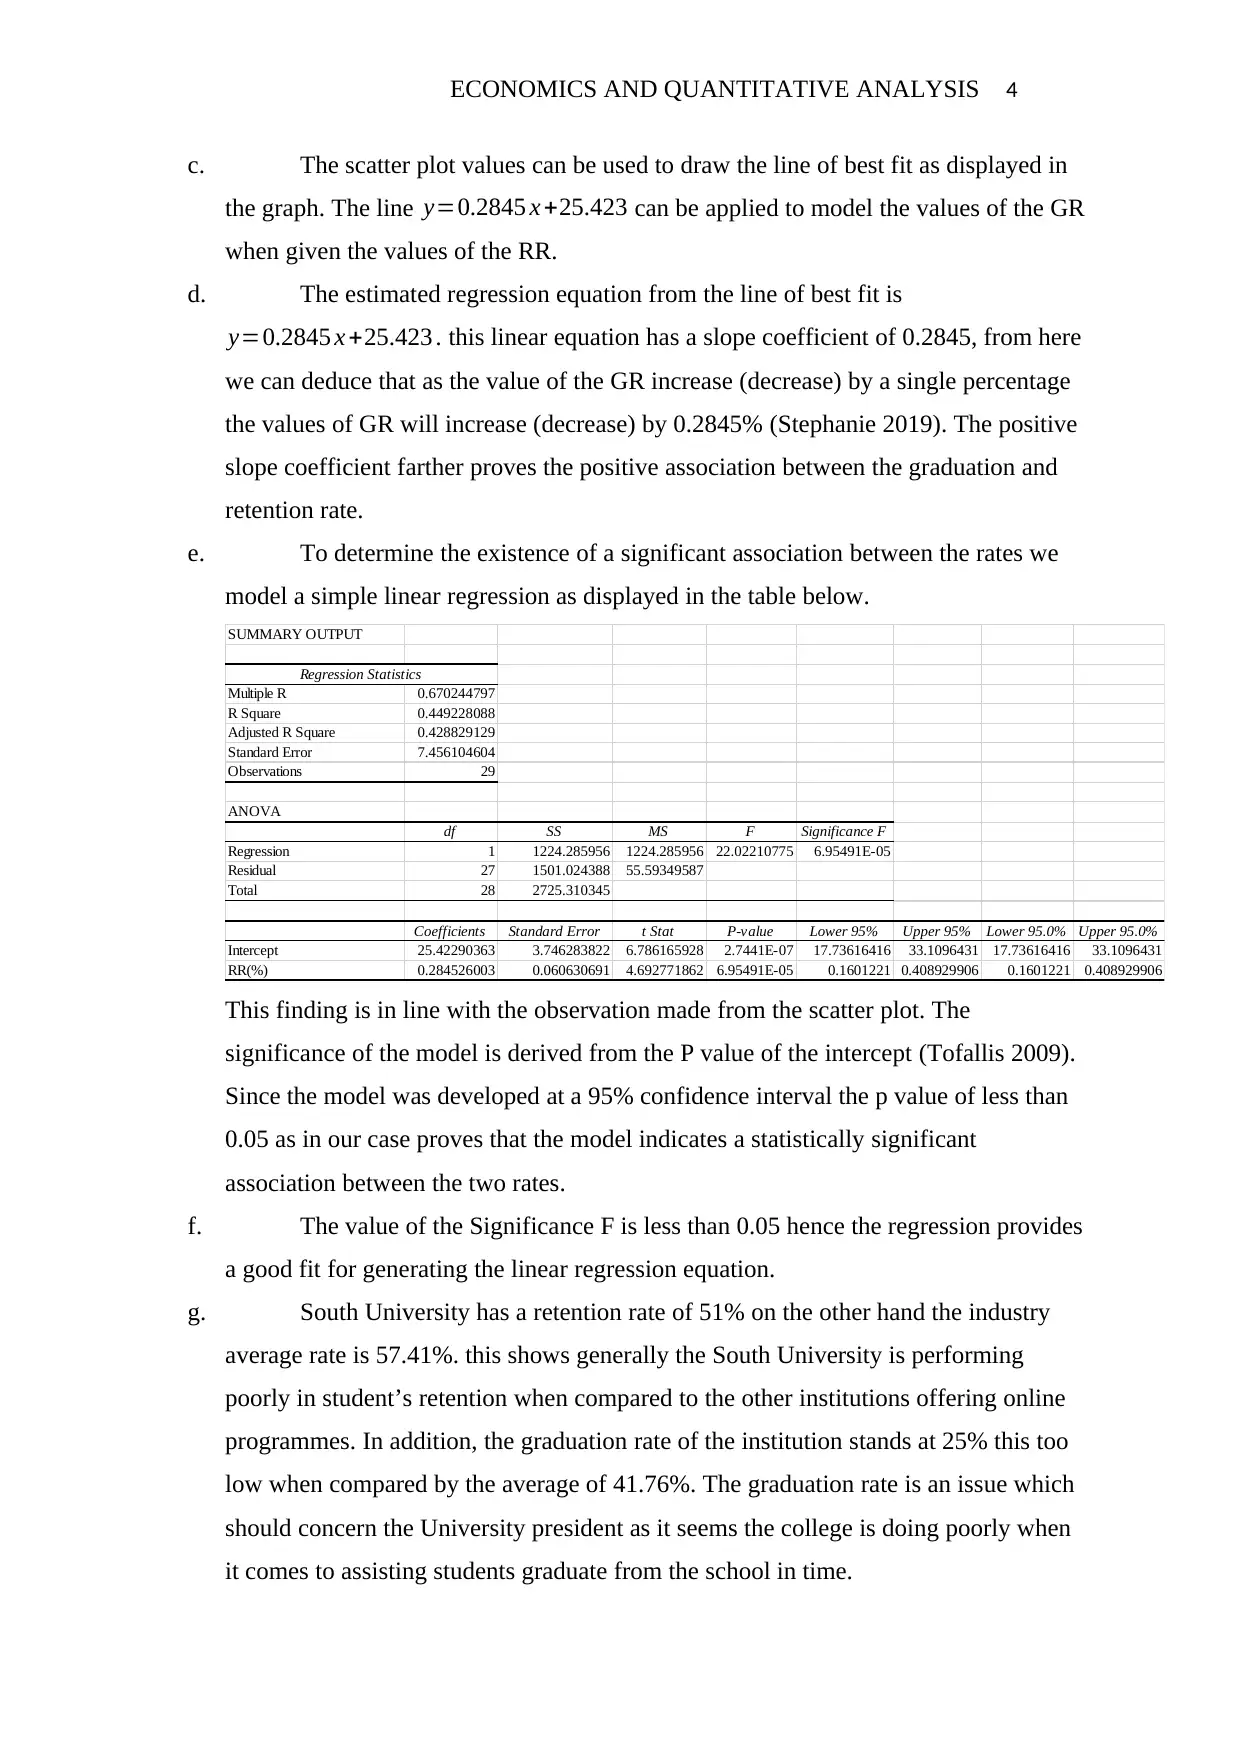
This report presents a linear regression analysis to determine the correlation between retention rate (RR) and graduation rate (GR) in online education. The study utilizes secondary data from the Online Educational Database and employs a simple linear regression model, along with a scatter plot and descriptive statistics, to evaluate the relationship between the two rates. The findings reveal a positive correlation between RR and GR, with a regression equation of y = 0.2845x + 25.423. The analysis indicates that the model provides a good fit for generating the linear regression equation, and the results align with previous research highlighting the association between the two rates. The report also discusses the performance of two universities based on their RR and GR, provides recommendations for improving the quality of education, and highlights the importance of considering factors beyond the school's control that may impact these rates.
Document Page
ECONOMICS AND QUANTITATIVE ANALYSIS 1
ECONOMICS AND QUANTITATIVE ANALYSIS
Student Name
Course Name
Professor’s Name
Institution name
State
Date
tabler-icon-diamond-filled.svg

Paraphrase This Document

Need a fresh take? Get an instant paraphrase of this document with our AI Paraphraser
Document Page
ECONOMICS AND QUANTITATIVE ANALYSIS 2
Linear Regression Report
Purpose
The main objective of this study is to identify the correlation between the retention
rate (RR) and the graduation rate (GR). These two rates are vital for measuring the
performance of colleges and can assist students gauge the right school to undertake farther
studies (Craig 2015). By identifying the relationship between the rates, one may be able to
use one as a predictor of the other.
Background
Online courses are university programmes that students take through computers
connected to the internet. This is different from the normal learning system where students
have to attend classes at designated locations. Due to the improved technology, spreading of
the global internet coverage and the demand for flexible school schedules by individual’s
online education have recently gone up (Morris 2018). As several institutions crop up to offer
online courses students and parents are thrown in to a dilemma as they struggle to select the
best school to attend. Having removed the physical barriers that may hinder a student from
attending a college far away, the online platform’s biggest challenge is the selection the
college offering best quality education. Two rates have emerged that can be applied in
making this choice simple for the students; that is the graduation rate (RR) and the retention
rate (GR) (Sabbah 2011). The GR is the proportion of an institutions first years who goes
ahead to complete their studies in the institution within 150% of the recommended time for
the course (Anstine 2013). The retention rate RR is the proportion of first year students who
register for their second year to study in the same institution.
The two rates can be applied in making comparisons and hence gauging the quality of
education being offered in an institution in comparison to the other universities offering
online studies. This makes them of interests to economists who are interested in making the
quality comparisons.
Method
The data sample used in the analysis was derived from the Online Educational
Database. This is an organisation which was formulated to independently generate the list of
universities accredited to offer online study programs. This data is a secondary data that has
been collected verified and recorded by previous research activities. To evaluate the
Document Page
ECONOMICS AND QUANTITATIVE ANALYSIS 3
association between the RR and the GR, the study developed a simple linear regression
model in addition to drawing a scatter plot (Long 2009). Also, the descriptive statistics was
generated o assist describe the numerical features of the data sample.
Results
a. The table below gives the numerical analysis of the data sample
RR(%) GR(%)
Mean 57.4137931 Mean 41.75862
Standard Error 4.315602704 Standard Error 1.832019
Median 60 Median 39
Mode 51 Mode 36
Standard Deviation 23.24023181 Standard Deviation 9.865724
Sample Variance 540.1083744 Sample Variance 97.33251
Kurtosis 0.461757455 Kurtosis -0.8824
Skewness -0.309920645 Skewness 0.176364
Range 96 Range 36
Minimum 4 Minimum 25
Maximum 100 Maximum 61
Sum 1665 Sum 1211
Count 29 Count 29
Largest(1) 100 Largest(1) 61
Smallest(1) 4 Smallest(1) 25
b. To give a visual representation of the association between the two variables
the scatter plot was developed. This is displayed in the chart below (Malakooti 2013).
From the visual presentation of the chart the dots are increasing from the left towards
the right, this is interpreted as a sign of positive correlation between the two rates.
Document Page
ECONOMICS AND QUANTITATIVE ANALYSIS 4
c. The scatter plot values can be used to draw the line of best fit as displayed in
the graph. The line y=0.2845 x +25.423 can be applied to model the values of the GR
when given the values of the RR.
d. The estimated regression equation from the line of best fit is
y=0.2845 x +25.423 . this linear equation has a slope coefficient of 0.2845, from here
we can deduce that as the value of the GR increase (decrease) by a single percentage
the values of GR will increase (decrease) by 0.2845% (Stephanie 2019). The positive
slope coefficient farther proves the positive association between the graduation and
retention rate.
e. To determine the existence of a significant association between the rates we
model a simple linear regression as displayed in the table below.
SUMMARY OUTPUT
Regression Statistics
Multiple R 0.670244797
R Square 0.449228088
Adjusted R Square 0.428829129
Standard Error 7.456104604
Observations 29
ANOVA
df SS MS F Significance F
Regression 1 1224.285956 1224.285956 22.02210775 6.95491E-05
Residual 27 1501.024388 55.59349587
Total 28 2725.310345
Coefficients Standard Error t Stat P-value Lower 95% Upper 95% Lower 95.0% Upper 95.0%
Intercept 25.42290363 3.746283822 6.786165928 2.7441E-07 17.73616416 33.1096431 17.73616416 33.1096431
RR(%) 0.284526003 0.060630691 4.692771862 6.95491E-05 0.1601221 0.408929906 0.1601221 0.408929906
This finding is in line with the observation made from the scatter plot. The
significance of the model is derived from the P value of the intercept (Tofallis 2009).
Since the model was developed at a 95% confidence interval the p value of less than
0.05 as in our case proves that the model indicates a statistically significant
association between the two rates.
f. The value of the Significance F is less than 0.05 hence the regression provides
a good fit for generating the linear regression equation.
g. South University has a retention rate of 51% on the other hand the industry
average rate is 57.41%. this shows generally the South University is performing
poorly in student’s retention when compared to the other institutions offering online
programmes. In addition, the graduation rate of the institution stands at 25% this too
low when compared by the average of 41.76%. The graduation rate is an issue which
should concern the University president as it seems the college is doing poorly when
it comes to assisting students graduate from the school in time.
tabler-icon-diamond-filled.svg

Paraphrase This Document

Need a fresh take? Get an instant paraphrase of this document with our AI Paraphraser
Document Page
ECONOMICS AND QUANTITATIVE ANALYSIS 5
h. A view into the statistics from the Phoenix university shows the institution has
a retention rate of 4%. When this is compared to the industry average of 57.41% the
evident of poor performance cannot be more visible. The retention rate of the
institution is extremely low. The college seems to be very effective in attracting
students to register with them but making very little effort to keep the already
administered students. The graduation rate of just 28% versus the industry rate of 41%
is a proof of the poor-quality services that the institution is offering.
Discussion
The retention rate has a mean of 57.41% while the graduation rate has a mean 41.78%
when the simple linear regression model is developed a regression coefficient of 0.6702 is
obtained. This proves that there is a strong positive association between the retention and the
graduation rates. The same findings are visible in the scatter plot that has been drawn from
the sample data. The equation that best describes the relationship between the two variables is
y=0.2845 x +25.423. The analysis uses secondary data which has been collected verified and
recorded, this type of data is reliable. Despite the reliability of the data the research still faces
the challenge of authenticity. The study uses tow rates to evaluate quality of education in
institutions, this might not reflect the reality as education is faced with challenges that are
occasionally out of school administration’s control.
The conclusion that RR is positively correlated to GR is in line with studies conducted
by other scholars. The work by Meek (2018) proved that RR and GR have similar
contributors hence highlighting the possibility of correlation between the two variables.
Recommendations
From the study above the following recommendations need to be put in place
1. The two universities should review their curriculum to improve the quality of
education offered in the schools.
2. Phoenix university should develop a quality department to assist students achieve
their expectations from the institution.
3. The two universities need to conduct an analysis into their student’s
comfortability to assist highlight issues behind the poor RR and GR.
Document Page
ECONOMICS AND QUANTITATIVE ANALYSIS 6
References
Anstine, J 2013, Graduation Rates at U.S. Colleges and Universities: A Large Data Set
Analysis. Business Education & Accreditation, 5(2), pp. 2-8.
Craig, R 2015, A Brief History (And Future) Of Online Degrees. [Online]
Available at: https://www.forbes.com/sites/ryancraig/2015/06/23/a-brief-history-and-future-
of-online-degrees/#1519378348d9
[Accessed 1 February 2018].
Long, Y 2009, Human age estimation by metric learning for regression problems, Leipzig,
Germany: Inselstrasse.
Malakooti, B 2013, Operations and Production Systems with Multiple Objectives, s.l.: John
Wiley & Sons.
Meek, K 2018, Why Graduation and Retention Rates Matter. [Online]
Available at: https://www.northcentral.edu/news/why-graduation-and-retention-rates-matter/
[Accessed 1 February 2019].
Morris, C 2018, Why School Graduation and Retention Rates Are Important to Consider.
[Online]
Available at: https://www.earnest.com/blog/graduation-and-retention-rates/
[Accessed 1 February 2019].
Sabbah, J 2011, Retention and graduation rates affect students, university. [Online]
Available at: https://northernstar.info/campus/retention-and-graduation-rates-affect-students-
university/article_61eef84a-7551-11e0-9185-001a4bcf6878.html
[Accessed 1 February 2019].
Stephanie 2019, Regression Equation: What it is and How to use it. [Online]
Available at: https://www.statisticshowto.datasciencecentral.com/what-is-a-regression-
equation/
[Accessed 1 February 2019].
Tofallis, C 2009, Least Squares Percentage Regression. Journal of Modern Applied
Statistical Methods, Volume 7, p. 526–534.
Further Maths Tutorials 2011, Maths Tutorial: Interpreting Scatterplots (statistics). [Online]
Document Page
ECONOMICS AND QUANTITATIVE ANALYSIS 7
Available at: https://www.youtube.com/watch?v=PE_BpXTyKCE
[Accessed 1 February 2019].
chevron_up_icon
1 out of 7
circle_padding
hide_on_mobile
zoom_out_icon
[object Object]