Economics and Quantitative Analysis Report: Life Satisfaction Analysis
VerifiedAdded on 2022/08/12
|10
|1594
|30
Report
AI Summary
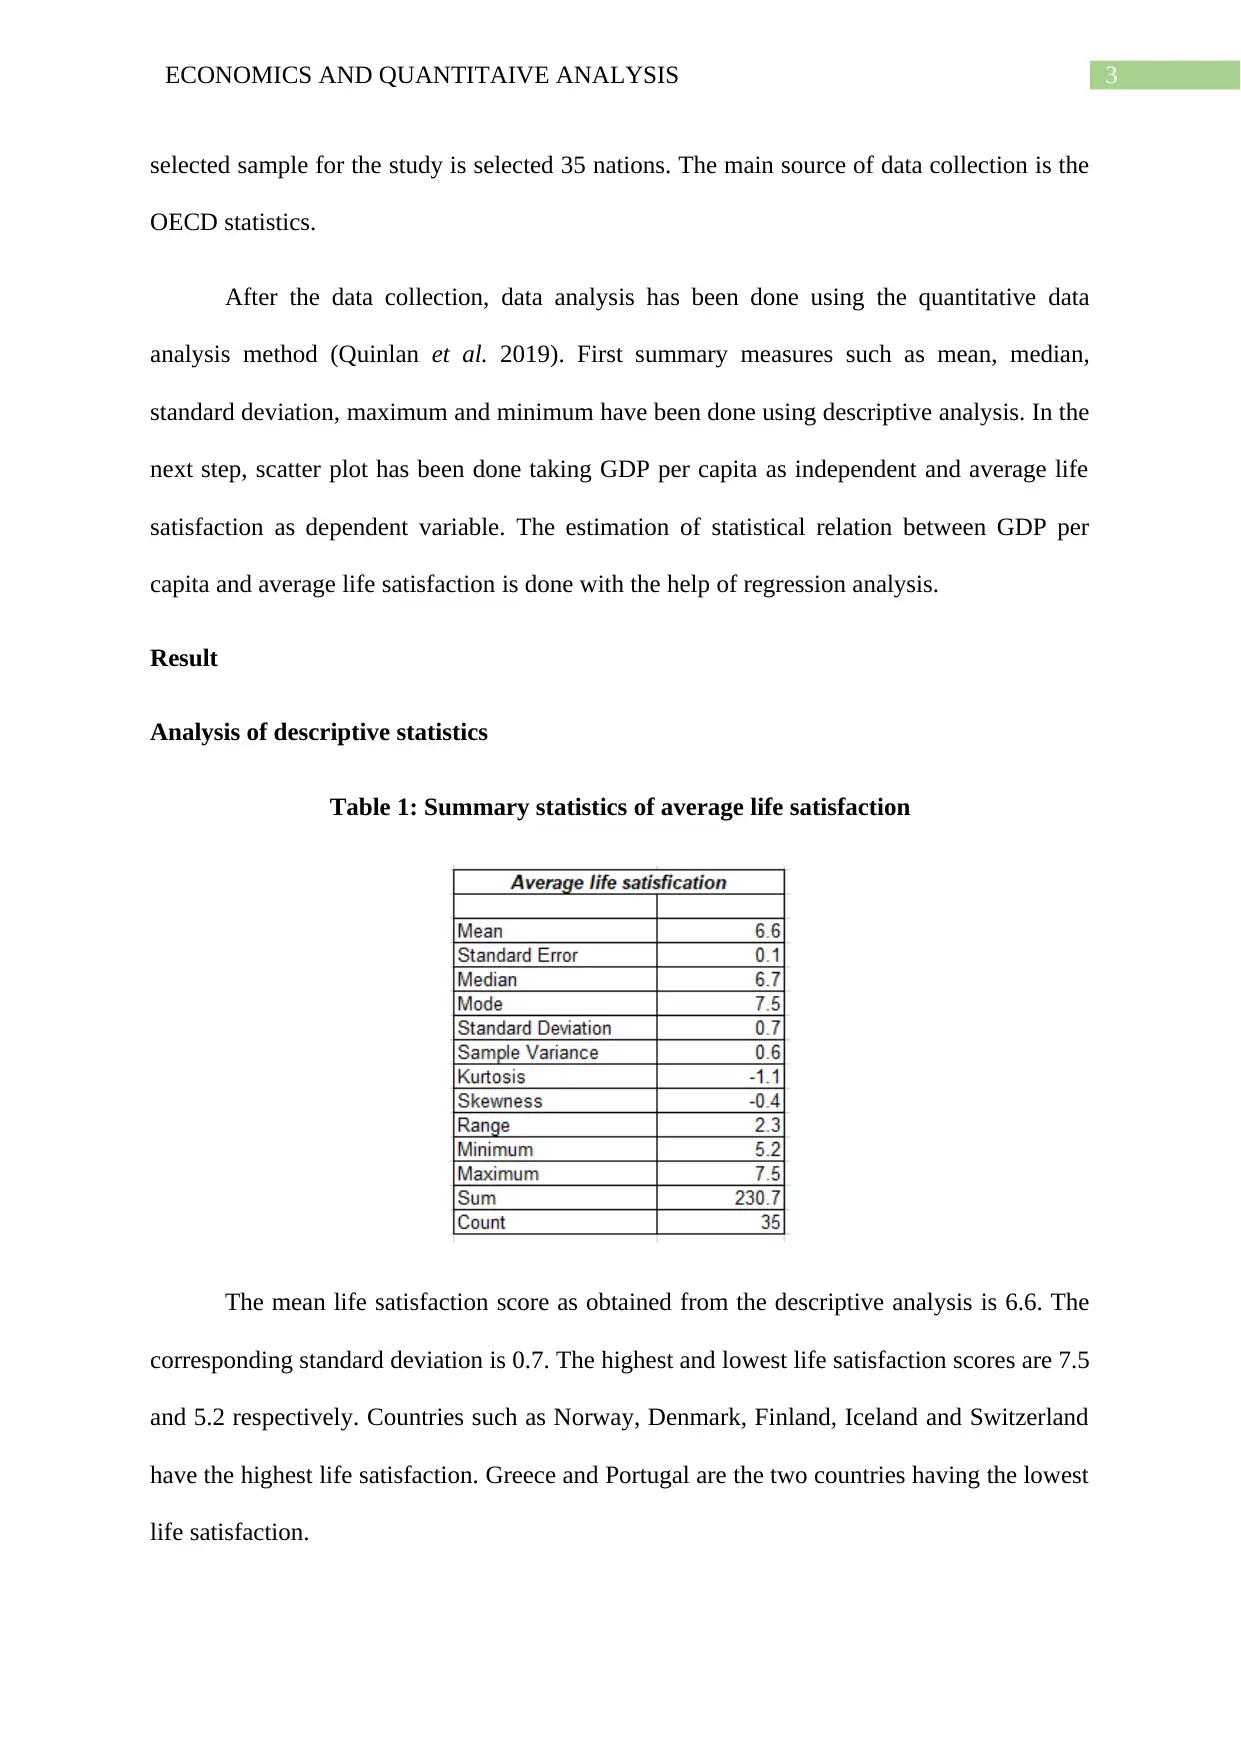
This economics report investigates the statistical association between average life satisfaction and GDP per capita, utilizing data from the OECD. The report begins with a concise purpose statement and a brief literature review, contextualizing the research within existing economic studies. The methodology section details the data sources and the quantitative data analysis techniques, including descriptive statistics, scatter plots, and regression analysis. The results section presents the statistical findings, including mean, standard deviation, and regression coefficients, highlighting the positive correlation between GDP per capita and life satisfaction. The discussion section addresses the limitations of the research and provides recommendations for policy implications, emphasizing the importance of income and other economic factors in enhancing life satisfaction. The report concludes with a comprehensive reference list, supporting the analysis and findings.

Running head: ECONOMICS AND QUANTITAIVE ANALYSIS
Economics and Quantitaive Analysis
Name of the Student
Name of the University
Course ID
Student ID
Economics and Quantitaive Analysis
Name of the Student
Name of the University
Course ID
Student ID
Secure Best Marks with AI Grader
Need help grading? Try our AI Grader for instant feedback on your assignments.

1ECONOMICS AND QUANTITAIVE ANALYSIS
Table of Contents
Purpose.......................................................................................................................................2
Background................................................................................................................................2
Method.......................................................................................................................................2
Result..........................................................................................................................................3
Analysis of descriptive statistics............................................................................................3
Analysis of scatter plot...........................................................................................................4
Analysis of regression model.................................................................................................5
Discussion..................................................................................................................................7
Recommendation........................................................................................................................8
References List...........................................................................................................................9

2ECONOMICS AND QUANTITAIVE ANALYSIS
Purpose
The paper conducts an economic analysis to understand the association of life
satisfaction with income. The purpose is to correctly identify the direction of the relation and
make clear policy implication.
Background
Study of life satisfaction was one central theme of different studies in the field of
American Social Indicator in 1970s. Eastelin conducted a study on life satisfaction and
economic growth during this time and arrived at the conclusion that average income does not
have any significant impact on life satisfaction (Kim, Linton and Lum 2015). Studies were
also conducted out of USA. Richard A in 1995 observed that individual happiness and life
satisfaction is one important part of life satisfaction. During early nineties, research on
relation between life satisfaction and income have become an important area of research.
Some cross sectional and panel studies supported a positive relation of life satisfaction with
average income. Though GDP was initially thought of as an important determinant of life
satisfaction one paper in the early twenty first century concluded that there is only a marginal
positive impact of GDP on life satisfaction after $10,000. A similar result was obtained in a
paper made by Stevenson and Wolfers (Meyer and Dunga 2014). Given the differences in
findings of different research paper continuous researches are carrying out in this field.
Method
Use of appropriate data analysis method is the key to reach reliable result. The first
step is to collect data on selected indicators. The paper aims to evaluate association of life
satisfaction with average income. For average income data on annual per capita GDP are
collected. As a measure of life satisfaction data are collected on life satisfaction scores. The

3ECONOMICS AND QUANTITAIVE ANALYSIS
selected sample for the study is selected 35 nations. The main source of data collection is the
OECD statistics.
After the data collection, data analysis has been done using the quantitative data
analysis method (Quinlan et al. 2019). First summary measures such as mean, median,
standard deviation, maximum and minimum have been done using descriptive analysis. In the
next step, scatter plot has been done taking GDP per capita as independent and average life
satisfaction as dependent variable. The estimation of statistical relation between GDP per
capita and average life satisfaction is done with the help of regression analysis.
Result
Analysis of descriptive statistics
Table 1: Summary statistics of average life satisfaction
The mean life satisfaction score as obtained from the descriptive analysis is 6.6. The
corresponding standard deviation is 0.7. The highest and lowest life satisfaction scores are 7.5
and 5.2 respectively. Countries such as Norway, Denmark, Finland, Iceland and Switzerland
have the highest life satisfaction. Greece and Portugal are the two countries having the lowest
life satisfaction.
Secure Best Marks with AI Grader
Need help grading? Try our AI Grader for instant feedback on your assignments.

4ECONOMICS AND QUANTITAIVE ANALYSIS
Table 2: Summary statistics of annual per capita GDP
Mean GDP per capita from the descriptive statistics is obtained as $39011.51.
Standard deviation for GDP per capita series is 14006.21. The highest and lowest per capita
GDP are $86788.14 and $17122.53 accounted by the respective nation of Luxemberg and
Mexico.
Analysis of scatter plot
Chart 1: Scatter diagram of per capita GDP and life satisfaction

5ECONOMICS AND QUANTITAIVE ANALYSIS
The graphical presentation of association between GDP per capita and average life
satisfaction through scatter diagram shows that the direction of elation between the two
variable is positive. That means as GDP per capita increases life satisfaction improves.
Analysis of regression model
Regression analysis provides a useful way of predicting a variable for a given value of
another variable. Therefore, given the GDP per capita life satisfaction can be predicted with
the help of following model
Y = βX
In the above mentioned model Y is predicted variable that is life satisfaction. X is predictor
of life satisfaction that is GDP per capita. β denotes the slope coefficient. In order to magnify
the impact of per capita GDP on life satisfaction the intercept term has been omitted.
The obtained regression estimate is produced below
Table 3: Regression result of life satisfaction on average per capita GDP

6ECONOMICS AND QUANTITAIVE ANALYSIS
Regression equation
Life satisfaction=(0.0001537 ×GDP per capita)
As obtained from the regression equation the slope coefficient is 1.5366. A positive
regression coefficient indicates a positive impact of per capita GDP on life satisfaction. That
means life satisfaction increases as per capita GDP increases and vice-versa. The value of the
coefficient suggests how much life satisfaction changes for a given change in GDP per capita.
The obtained value suggests that life satisfaction improves by 1.54 points when GDP
increases by 1 percent.
Association between GDP per capita and life satisfaction is statistically significant
when regression slope coefficient is statistically significant. P value associated with the slope
coefficient is 0.00000. The obtained p value is less than statistical significance level both at
5% and 1% meaning the null hypothesis that the coefficient is insignificant can be rejected
(Yu and Yao 2017). The obtained positive association therefore is statistically significant.
Given the statistically significant association life satisfaction can be said to increase when per
capita GDP increases.
The value of R square in the model is 0.92. R square is a measure of explanatory
power of the model and hence, indicate goodness of fit of the model. Obtained R square value
has the implication that annual GDP per capita is accountant for 92 percent variation of life
satisfaction. This in effect implies the model explains major part of variation in the dependent
variable and therefore the developed model is a good fit.
Paraphrase This Document
Need a fresh take? Get an instant paraphrase of this document with our AI Paraphraser

7ECONOMICS AND QUANTITAIVE ANALYSIS
Table 4: Regression estimation dropping the outliers
New regression equation
Life satisfaction=(0.0001734 × GDP per capita)
Removing outliers from the model raises the value of slope coefficient to 1.7346. The
larger value of slope coefficient means a greater impact of GDP per capita on life satisfaction.
The impact of per capita GDP thus is intensified in the new model. Fitness of the model has
also been improved as shown from a larger R square value of 0.96. 96 percent variation of
life satisfaction is now explained by GDP per capita (Das 2019). Higher explanatory power
implies improvement in model fitness.
Discussion
Study of the relation between life satisfaction and income finds that there is a
significant positive directional association between the variables. Higher income therefore
has the implication of higher life satisfaction.

8ECONOMICS AND QUANTITAIVE ANALYSIS
Quantitative data analysis technique adapted in the paper has the advantage of
providing a reliable result to fulfill the research objective. The data analysis method gives a
correct statistical estimation of the relation between life satisfaction and income and the result
can be generalized for a large population group (Sheard 2018). Limited sample size and
consideration of only income as determinant of life satisfaction are the two limitation of the
research.
The paper support some of the findings of 19th centuries suggesting positive
association between income and life satisfaction. Result of the paper has implication for
developing policy framework for ensuring a better satisfied life.
Recommendation
Considering finding of the paper the section offers policy recommendation for a better
life.
Income is a positive determinant of happiness or life satisfaction. Programs that directly or
indirectly support income will therefore be helpful for increasing life satisfaction.
Apart from income, life satisfaction is related to other economic factor such as
unemployment, income inequality, inflation and others. Government should ensure stability
in these aspects as well to increase life satisfaction.
Qualitative aspects of well-being (health, education, environmental quality and such others)
should also be focused while attempting to increase life satisfaction.

9ECONOMICS AND QUANTITAIVE ANALYSIS
References List
Das, P., 2019. Linear Regression Model: Goodness of Fit and Testing of Hypothesis.
In Econometrics in Theory and Practice (pp. 75-108). Springer, Singapore.
Kim, B.J., Linton, K.F. and Lum, W., 2015. Social capital and life satisfaction among
Chinese and Korean elderly immigrants. Journal of Social Work, 15(1), pp.87-100.
Meyer, D.F. and Dunga, S.H., 2014. The determinants of life satisfaction in a low-income,
poor community in South Africa. Mediterranean Journal of Social Sciences, 5(13), pp.163-
163.
Quinlan, C., Babin, B., Carr, J. and Griffin, M., 2019. Business research methods. South
Western Cengage.
Sheard, J., 2018. Quantitative data analysis. In Research Methods: Information, Systems, and
Contexts, Second Edition (pp. 429-452). Elsevier.
Yu, C. and Yao, W., 2017. Robust linear regression: A review and
comparison. Communications in Statistics-Simulation and Computation, 46(8), pp.6261-
6282.
1 out of 10
Related Documents

Your All-in-One AI-Powered Toolkit for Academic Success.
+13062052269
info@desklib.com
Available 24*7 on WhatsApp / Email
Unlock your academic potential
© 2024 | Zucol Services PVT LTD | All rights reserved.