Economics Report: Analyzing Low Real Wage Impact in Australia
VerifiedAdded on 2023/03/17
|15
|3241
|86
Report
AI Summary
This economics report provides a comprehensive analysis of the low real wage issue in Australia, addressing two key questions from an assignment brief. The first part examines the four expenditure components of GDP (consumption, investment, government spending, and net exports) from 1987/88 to 2017/18, using data from the Australian Bureau of Statistics (ABS) and presenting them in real per capita terms. The analysis includes graphical representations and economic explanations for observed trends, such as the impact of the 2008 global recession and the mining sector's contraction. The second part explores the impact of low real wage growth on macroeconomic equilibrium in Australia using diagrams and evidence. It delves into the causes of low real wage growth, including prolonged low inflation and underemployment, and discusses the resulting effects on productivity, demand, and the overall economy. The report concludes by suggesting potential government policy interventions, such as increasing the money supply, to address the challenges posed by low real wage growth and stimulate economic recovery.
Running head: ECONOMICS
Economics
Name of the Student
Name of the University
Author Note
Economics
Name of the Student
Name of the University
Author Note
Paraphrase This Document
Need a fresh take? Get an instant paraphrase of this document with our AI Paraphraser
1LOW REAL WAGE IN AUSTRALIA
Table of Contents
Answer 1....................................................................................................................................2
Introduction............................................................................................................................2
Analysis..................................................................................................................................2
Conclusion..............................................................................................................................6
Answer 2....................................................................................................................................6
Introduction............................................................................................................................6
Analysis..................................................................................................................................6
Conclusion............................................................................................................................11
References................................................................................................................................12
2LOW REAL WAGE IN AUSTRALIA
Answer 1
Introduction
Gross domestic product of a nation is an annual estimate of produced goods and
services within the nation. GDP can be computed using expenditure or income or production
approach. Among these expenditure approach is the most commonly used method for GDP
estimation. Four components of expenditure approach are consumption spending, gross
investment expenditure, government spending and net export. GDP here is estimated as a
sum of four components. This section discusses trend in real capita estimate of different
expenditure components of GDP of Australia from 1987/88 to 2017/18 and provides
economic explanation for the observed pattern in the series.
Analysis
Consumption
Personal consumption expenditure captures monetary values of goods and services
that household and non-profit institutions purchase in an accounting year. Consumption on
different goods and services are classified into durables, non-durables, semi-durables and
services.
1987
1989
1991
1993
1995
1997
1999
2001
2003
2005
2007
2009
2011
2013
2015
2017
20000.00
25000.00
30000.00
35000.00
40000.00
45000.00
Real per capita consumption
Year
Consumption
⊘ This is a preview!⊘
Do you want full access?
Subscribe today to unlock all pages.
Trusted by 1+ million students worldwide
3LOW REAL WAGE IN AUSTRALIA
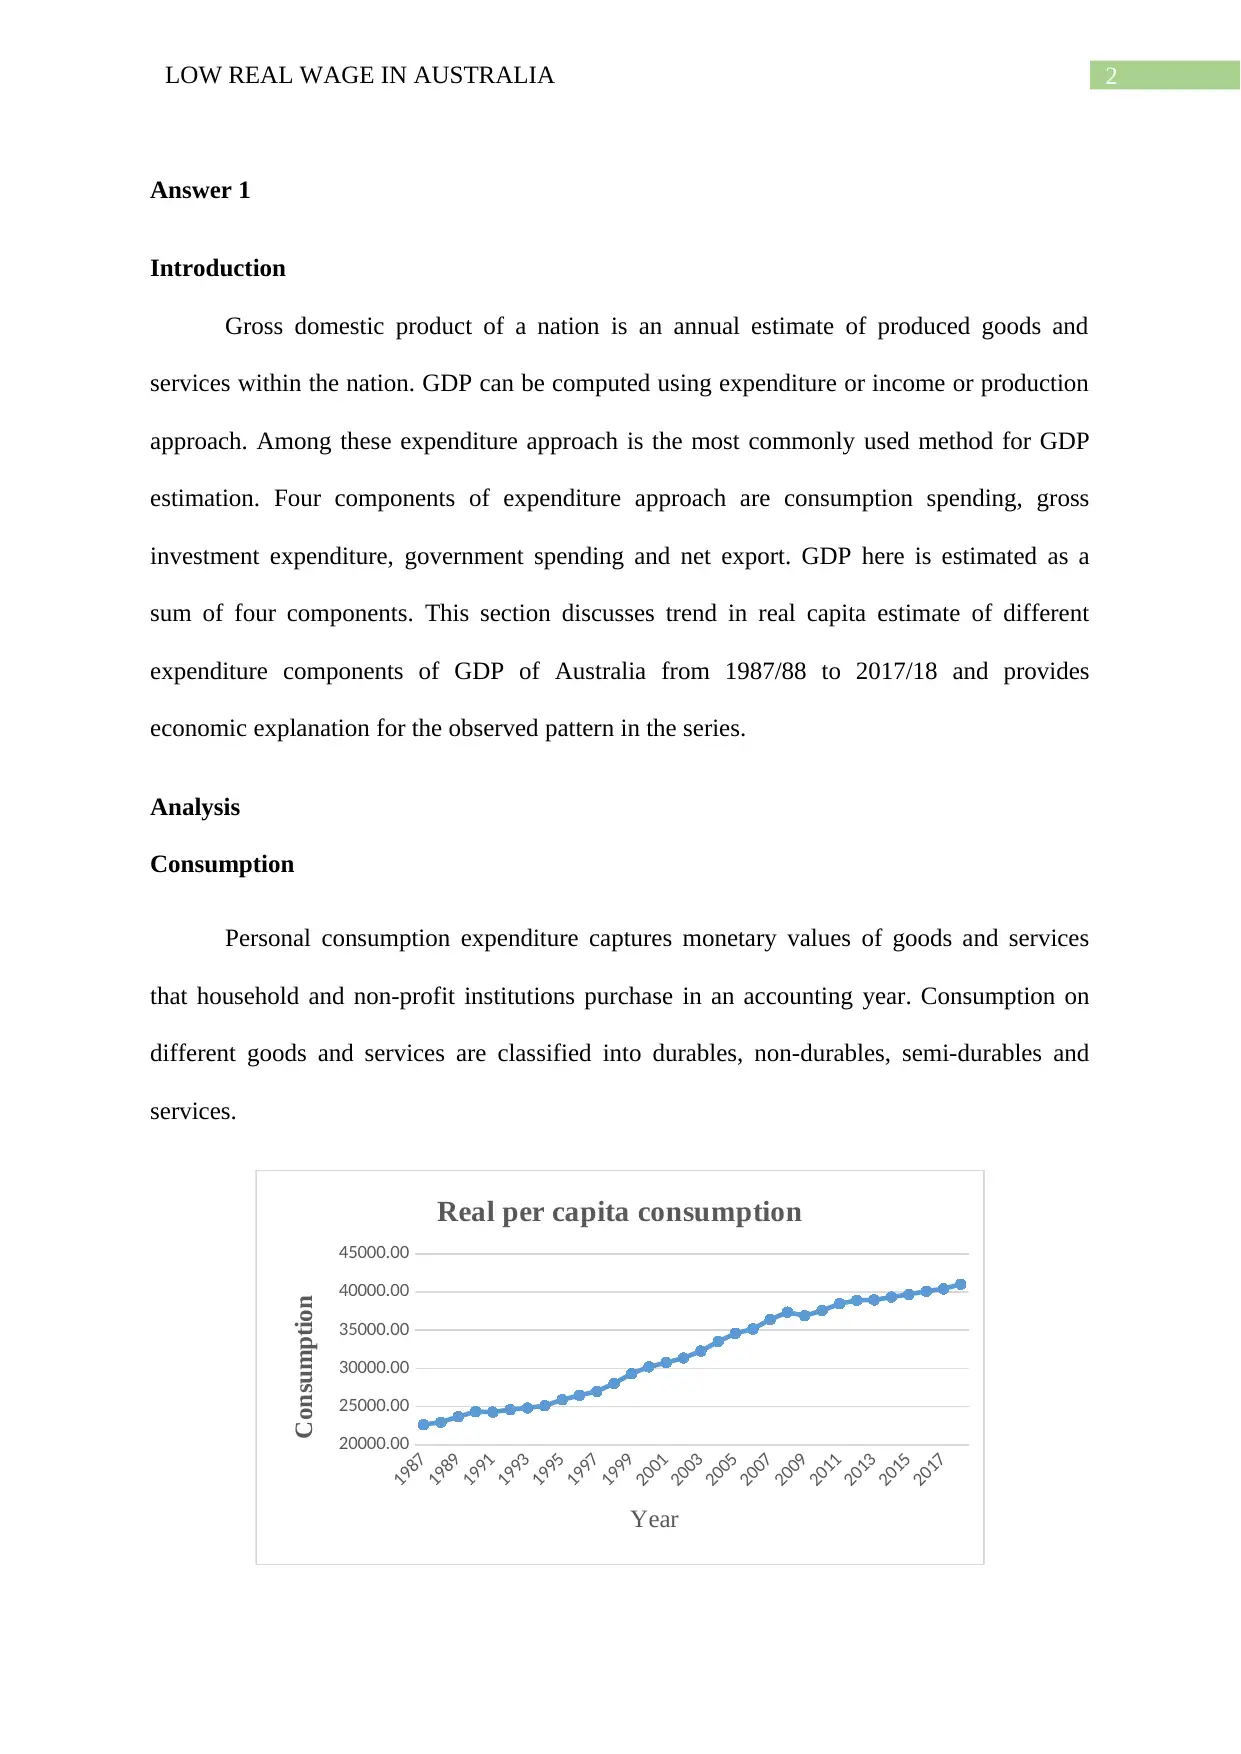
Figure 1: Real per capita consumption trend in Australia
The figure above represents trend in per capita real consumption for Australian
household for a sample period ranged from 1987 to 2018. The series of real per capita
consumption shows an increasing trend from beginning of the sample period. Per capita
consumption increased continuously from 1987 to 2007 (abs.gov.au, 2019). Consumption
declined slightly during 2008 and 2009. The decline in per capita consumption was the result
of global recession in 2008. Following economic recovery since 2010, income increased
resulting in an increase in consumption expenditure (Deo, Spong & Varua, 2017). In
Australia, consumption is the biggest contributor of gross domestic product. Rate of increases
in consumption expenditure exceeds the rate of increase in income causing per capita
consumption to increase continuously.
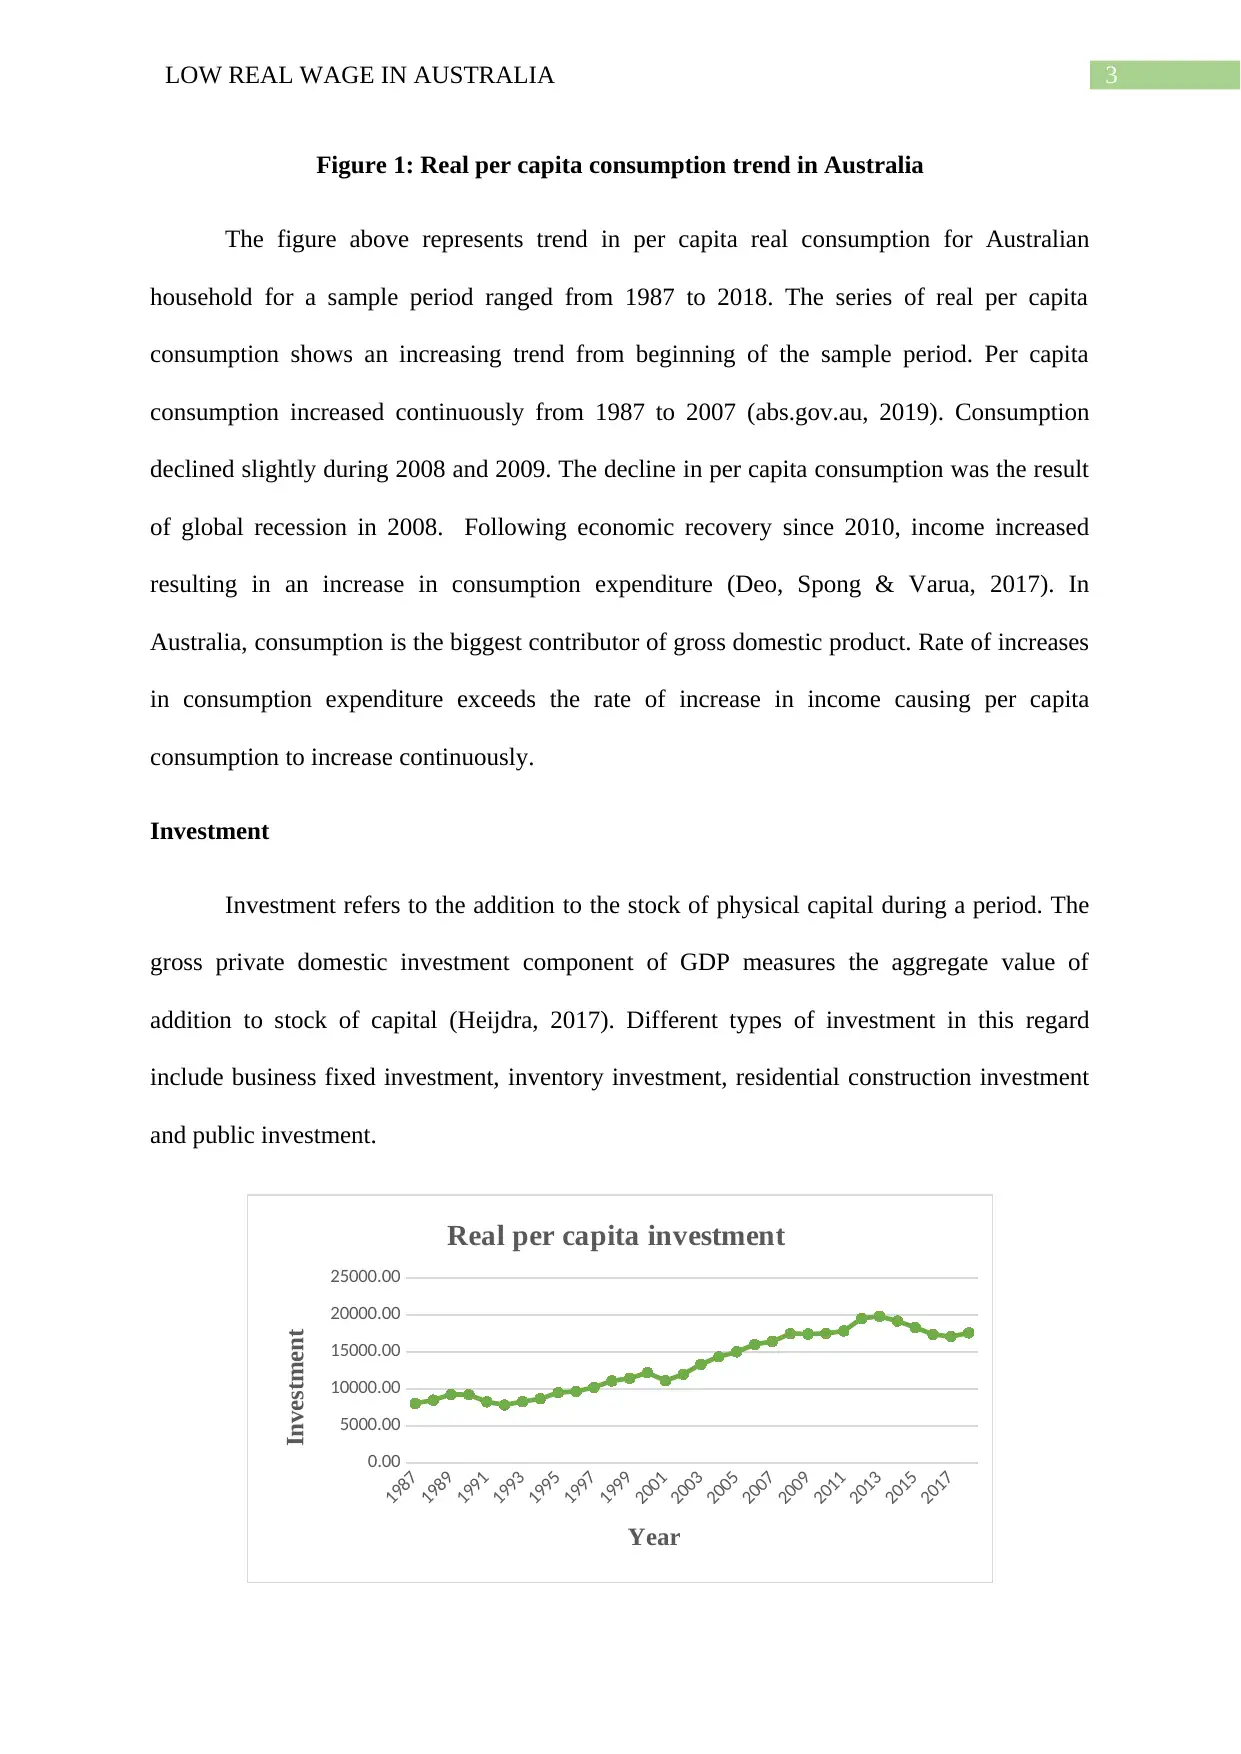
Investment
Investment refers to the addition to the stock of physical capital during a period. The
gross private domestic investment component of GDP measures the aggregate value of
addition to stock of capital (Heijdra, 2017). Different types of investment in this regard
include business fixed investment, inventory investment, residential construction investment
and public investment.
1987
1989
1991
1993
1995
1997
1999
2001
2003
2005
2007
2009
2011
2013
2015
2017
0.00
5000.00
10000.00
15000.00
20000.00
25000.00
Real per capita investment
Year
Investment
Figure 1: Real per capita consumption trend in Australia
The figure above represents trend in per capita real consumption for Australian
household for a sample period ranged from 1987 to 2018. The series of real per capita
consumption shows an increasing trend from beginning of the sample period. Per capita
consumption increased continuously from 1987 to 2007 (abs.gov.au, 2019). Consumption
declined slightly during 2008 and 2009. The decline in per capita consumption was the result
of global recession in 2008. Following economic recovery since 2010, income increased
resulting in an increase in consumption expenditure (Deo, Spong & Varua, 2017). In
Australia, consumption is the biggest contributor of gross domestic product. Rate of increases
in consumption expenditure exceeds the rate of increase in income causing per capita
consumption to increase continuously.
Investment
Investment refers to the addition to the stock of physical capital during a period. The
gross private domestic investment component of GDP measures the aggregate value of
addition to stock of capital (Heijdra, 2017). Different types of investment in this regard
include business fixed investment, inventory investment, residential construction investment
and public investment.
1987
1989
1991
1993
1995
1997
1999
2001
2003
2005
2007
2009
2011
2013
2015
2017
0.00
5000.00
10000.00
15000.00
20000.00
25000.00
Real per capita investment
Year
Investment
Paraphrase This Document
Need a fresh take? Get an instant paraphrase of this document with our AI Paraphraser
4LOW REAL WAGE IN AUSTRALIA
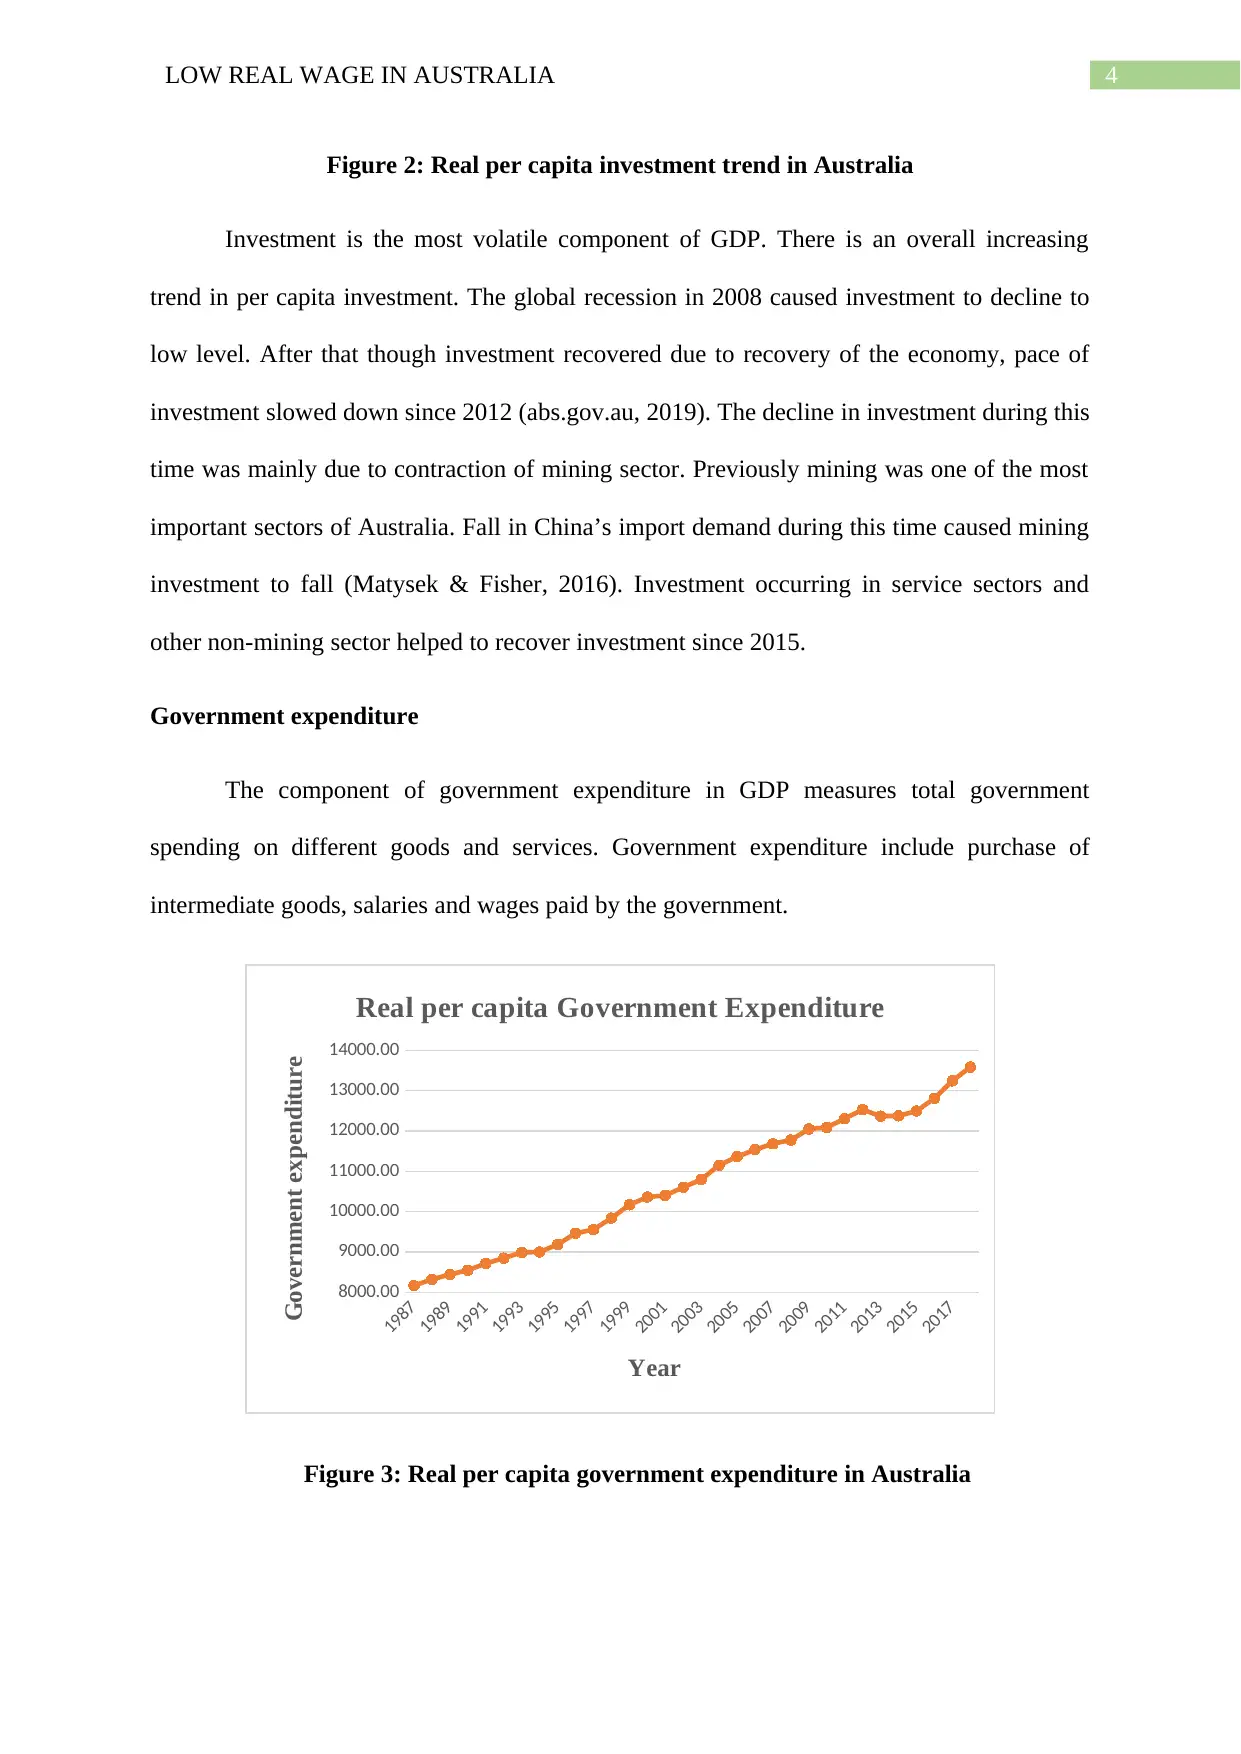
Figure 2: Real per capita investment trend in Australia
Investment is the most volatile component of GDP. There is an overall increasing
trend in per capita investment. The global recession in 2008 caused investment to decline to
low level. After that though investment recovered due to recovery of the economy, pace of
investment slowed down since 2012 (abs.gov.au, 2019). The decline in investment during this
time was mainly due to contraction of mining sector. Previously mining was one of the most
important sectors of Australia. Fall in China’s import demand during this time caused mining
investment to fall (Matysek & Fisher, 2016). Investment occurring in service sectors and
other non-mining sector helped to recover investment since 2015.
Government expenditure
The component of government expenditure in GDP measures total government
spending on different goods and services. Government expenditure include purchase of
intermediate goods, salaries and wages paid by the government.
1987
1989
1991
1993
1995
1997
1999
2001
2003
2005
2007
2009
2011
2013
2015
2017
8000.00
9000.00
10000.00
11000.00
12000.00
13000.00
14000.00
Real per capita Government Expenditure
Year
Government expenditure
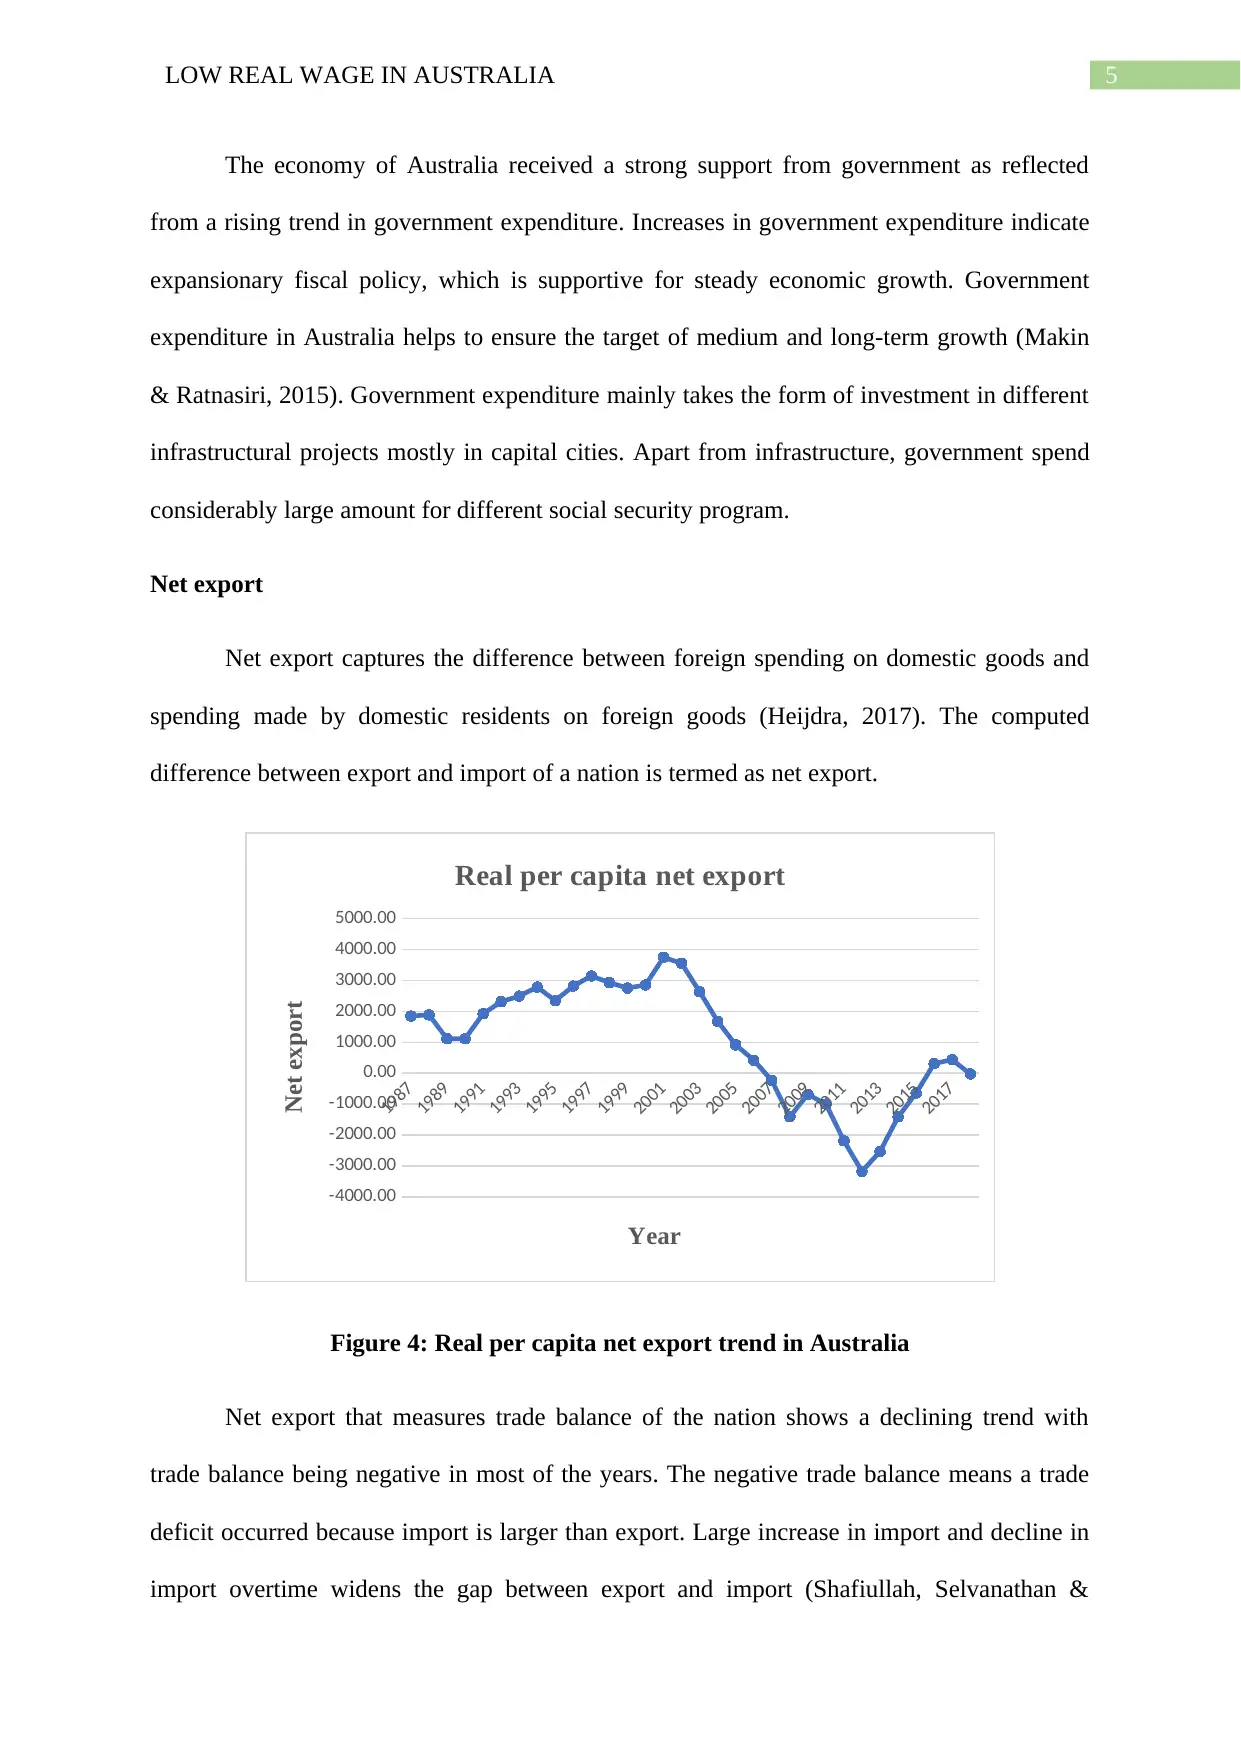
Figure 3: Real per capita government expenditure in Australia
Figure 2: Real per capita investment trend in Australia
Investment is the most volatile component of GDP. There is an overall increasing
trend in per capita investment. The global recession in 2008 caused investment to decline to
low level. After that though investment recovered due to recovery of the economy, pace of
investment slowed down since 2012 (abs.gov.au, 2019). The decline in investment during this
time was mainly due to contraction of mining sector. Previously mining was one of the most
important sectors of Australia. Fall in China’s import demand during this time caused mining
investment to fall (Matysek & Fisher, 2016). Investment occurring in service sectors and
other non-mining sector helped to recover investment since 2015.
Government expenditure
The component of government expenditure in GDP measures total government
spending on different goods and services. Government expenditure include purchase of
intermediate goods, salaries and wages paid by the government.
1987
1989
1991
1993
1995
1997
1999
2001
2003
2005
2007
2009
2011
2013
2015
2017
8000.00
9000.00
10000.00
11000.00
12000.00
13000.00
14000.00
Real per capita Government Expenditure
Year
Government expenditure
Figure 3: Real per capita government expenditure in Australia
5LOW REAL WAGE IN AUSTRALIA
The economy of Australia received a strong support from government as reflected
from a rising trend in government expenditure. Increases in government expenditure indicate
expansionary fiscal policy, which is supportive for steady economic growth. Government
expenditure in Australia helps to ensure the target of medium and long-term growth (Makin
& Ratnasiri, 2015). Government expenditure mainly takes the form of investment in different
infrastructural projects mostly in capital cities. Apart from infrastructure, government spend
considerably large amount for different social security program.
Net export
Net export captures the difference between foreign spending on domestic goods and
spending made by domestic residents on foreign goods (Heijdra, 2017). The computed
difference between export and import of a nation is termed as net export.
1987
1989
1991
1993
1995
1997
1999
2001
2003
2005
2007
2009
2011
2013
2015
2017
-4000.00
-3000.00
-2000.00
-1000.00
0.00
1000.00
2000.00
3000.00
4000.00
5000.00
Real per capita net export
Year
Net export
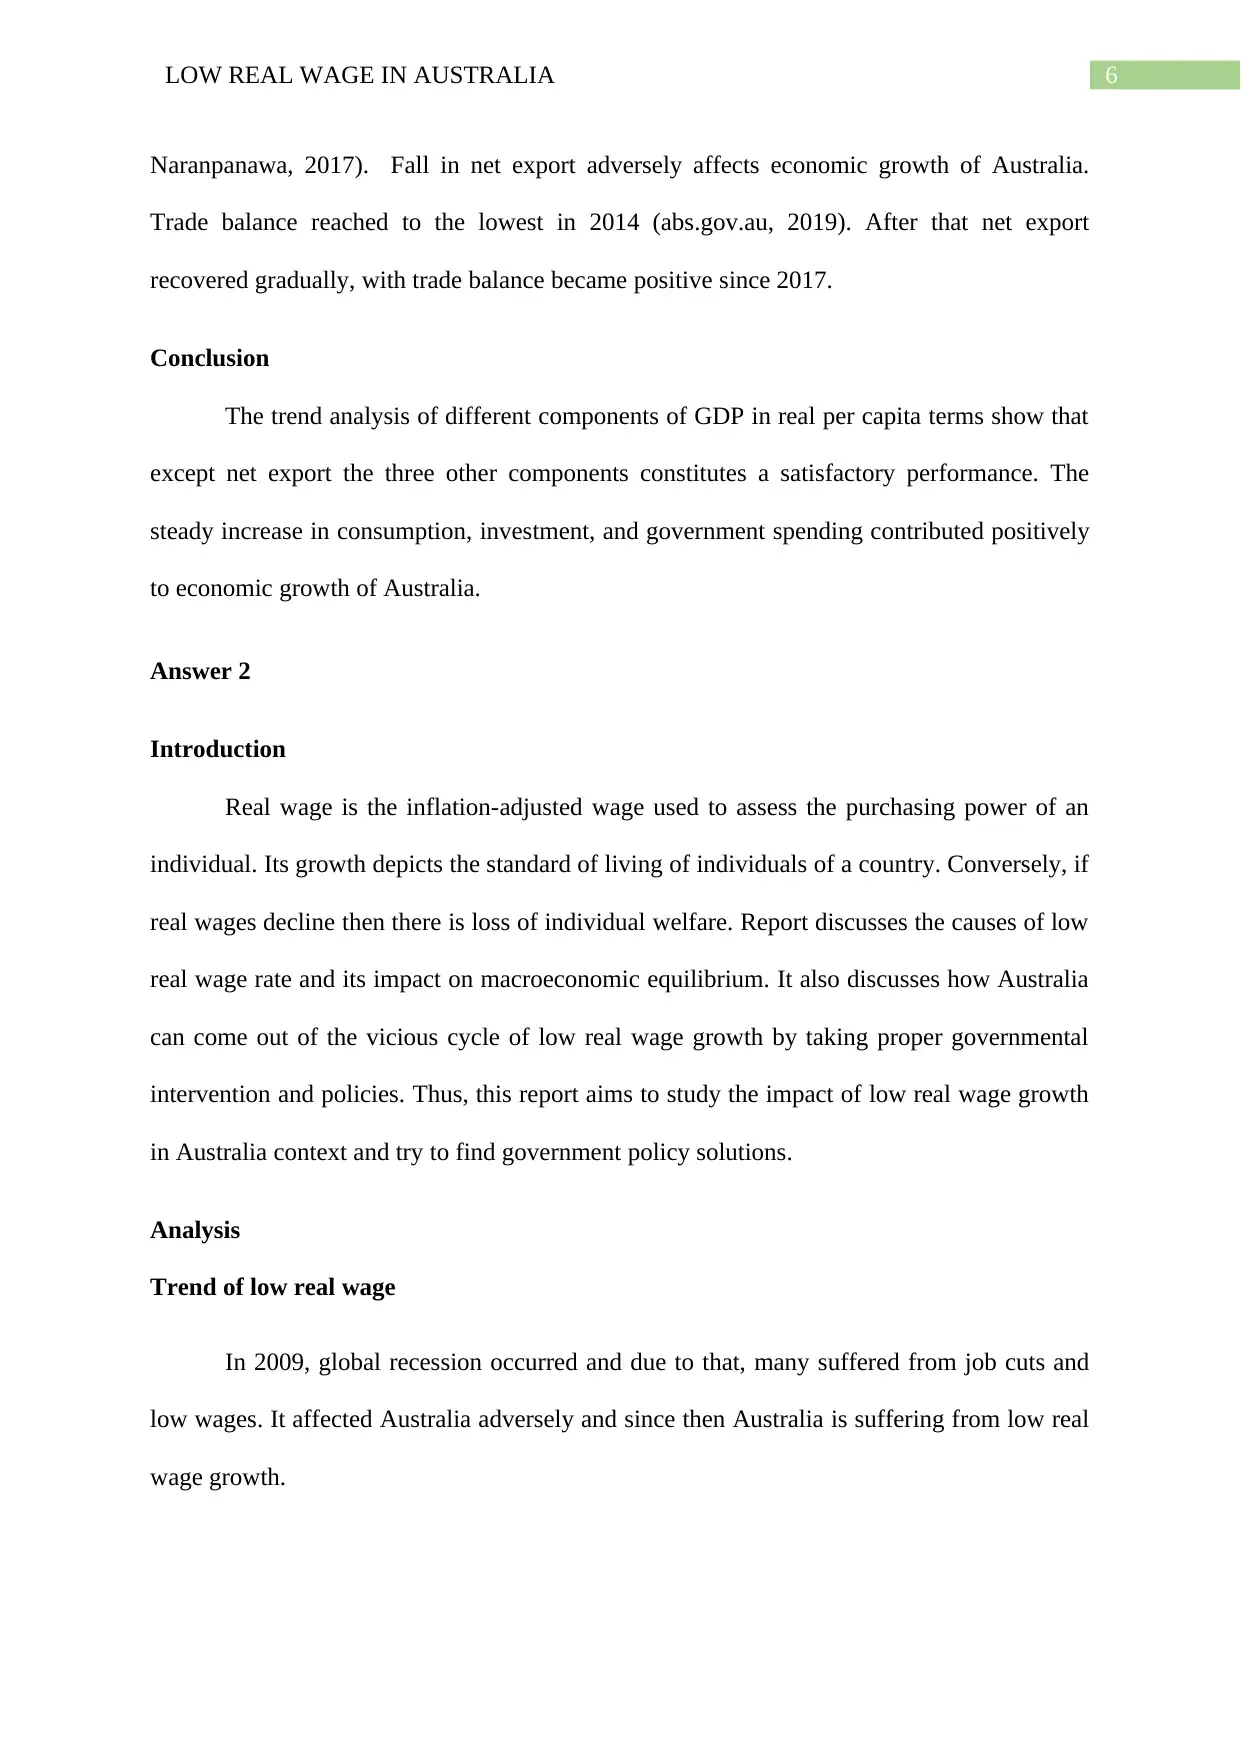
Figure 4: Real per capita net export trend in Australia
Net export that measures trade balance of the nation shows a declining trend with
trade balance being negative in most of the years. The negative trade balance means a trade
deficit occurred because import is larger than export. Large increase in import and decline in
import overtime widens the gap between export and import (Shafiullah, Selvanathan &
The economy of Australia received a strong support from government as reflected
from a rising trend in government expenditure. Increases in government expenditure indicate
expansionary fiscal policy, which is supportive for steady economic growth. Government
expenditure in Australia helps to ensure the target of medium and long-term growth (Makin
& Ratnasiri, 2015). Government expenditure mainly takes the form of investment in different
infrastructural projects mostly in capital cities. Apart from infrastructure, government spend
considerably large amount for different social security program.
Net export
Net export captures the difference between foreign spending on domestic goods and
spending made by domestic residents on foreign goods (Heijdra, 2017). The computed
difference between export and import of a nation is termed as net export.
1987
1989
1991
1993
1995
1997
1999
2001
2003
2005
2007
2009
2011
2013
2015
2017
-4000.00
-3000.00
-2000.00
-1000.00
0.00
1000.00
2000.00
3000.00
4000.00
5000.00
Real per capita net export
Year
Net export
Figure 4: Real per capita net export trend in Australia
Net export that measures trade balance of the nation shows a declining trend with
trade balance being negative in most of the years. The negative trade balance means a trade
deficit occurred because import is larger than export. Large increase in import and decline in
import overtime widens the gap between export and import (Shafiullah, Selvanathan &
⊘ This is a preview!⊘
Do you want full access?
Subscribe today to unlock all pages.
Trusted by 1+ million students worldwide
6LOW REAL WAGE IN AUSTRALIA
Naranpanawa, 2017). Fall in net export adversely affects economic growth of Australia.
Trade balance reached to the lowest in 2014 (abs.gov.au, 2019). After that net export
recovered gradually, with trade balance became positive since 2017.
Conclusion
The trend analysis of different components of GDP in real per capita terms show that
except net export the three other components constitutes a satisfactory performance. The
steady increase in consumption, investment, and government spending contributed positively
to economic growth of Australia.
Answer 2
Introduction
Real wage is the inflation-adjusted wage used to assess the purchasing power of an
individual. Its growth depicts the standard of living of individuals of a country. Conversely, if
real wages decline then there is loss of individual welfare. Report discusses the causes of low
real wage rate and its impact on macroeconomic equilibrium. It also discusses how Australia
can come out of the vicious cycle of low real wage growth by taking proper governmental
intervention and policies. Thus, this report aims to study the impact of low real wage growth
in Australia context and try to find government policy solutions.
Analysis
Trend of low real wage
In 2009, global recession occurred and due to that, many suffered from job cuts and
low wages. It affected Australia adversely and since then Australia is suffering from low real
wage growth.
Paraphrase This Document
Need a fresh take? Get an instant paraphrase of this document with our AI Paraphraser
7LOW REAL WAGE IN AUSTRALIA
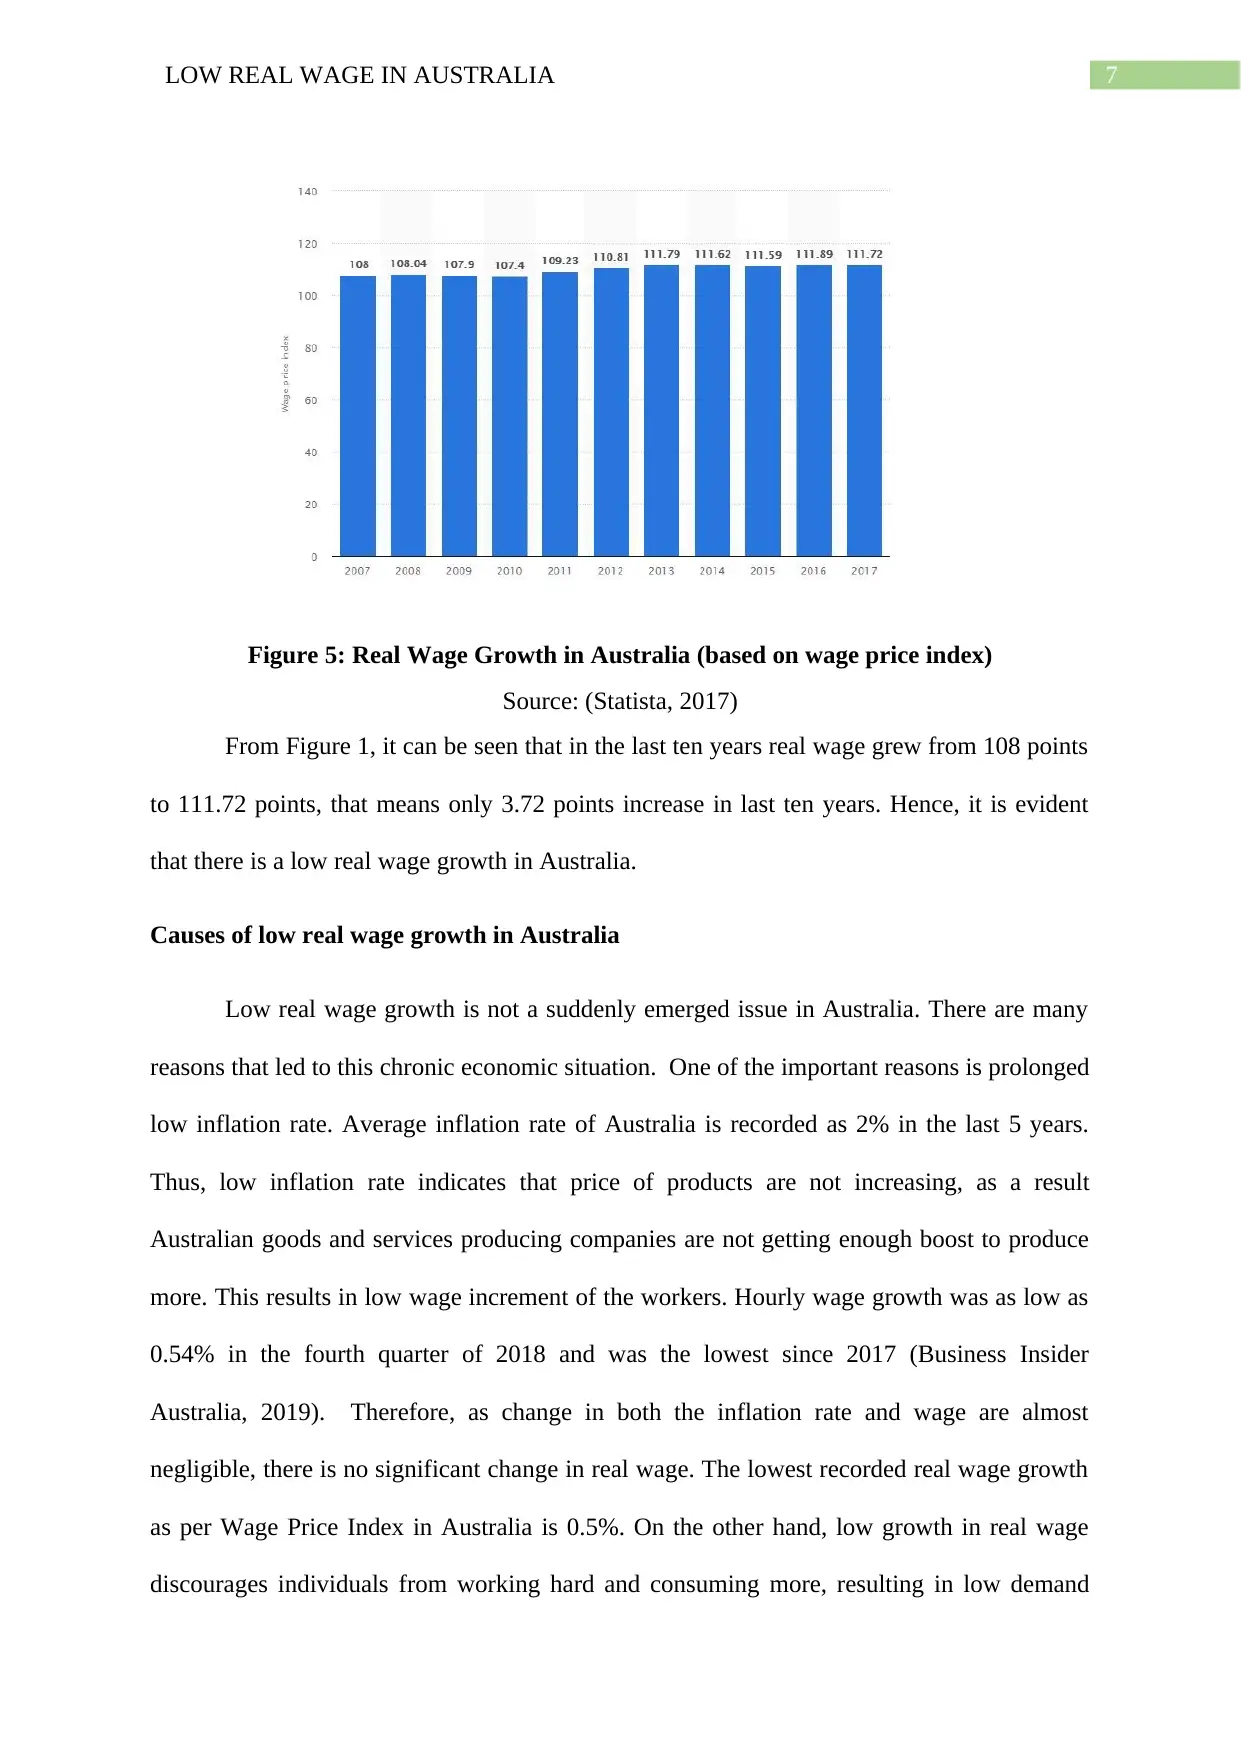
Figure 5: Real Wage Growth in Australia (based on wage price index)
Source: (Statista, 2017)
From Figure 1, it can be seen that in the last ten years real wage grew from 108 points
to 111.72 points, that means only 3.72 points increase in last ten years. Hence, it is evident
that there is a low real wage growth in Australia.
Causes of low real wage growth in Australia
Low real wage growth is not a suddenly emerged issue in Australia. There are many
reasons that led to this chronic economic situation. One of the important reasons is prolonged
low inflation rate. Average inflation rate of Australia is recorded as 2% in the last 5 years.
Thus, low inflation rate indicates that price of products are not increasing, as a result
Australian goods and services producing companies are not getting enough boost to produce
more. This results in low wage increment of the workers. Hourly wage growth was as low as
0.54% in the fourth quarter of 2018 and was the lowest since 2017 (Business Insider
Australia, 2019). Therefore, as change in both the inflation rate and wage are almost
negligible, there is no significant change in real wage. The lowest recorded real wage growth
as per Wage Price Index in Australia is 0.5%. On the other hand, low growth in real wage
discourages individuals from working hard and consuming more, resulting in low demand
8LOW REAL WAGE IN AUSTRALIA
and productivity. This sluggishness in market keeps the real wage growth at a low rate. There
are reports that provide a different notion regarding low real wage growth in Australia,
according to such reports underemployment is a key factor, which has negative impact on
real wage growth. As of May 2017, 1.13 million people were underemployed in Australia
(The Guardian, 2019). Hence, underemployed workers are paid less than expectation.
Therefore, Australia has been trapped in a vicious cycle of low real wage growth.
Impact of low real wage on macroeconomic equilibrium
Wage is one of the factor that influences workers’ productivity and the case is same with real
wage. Thus, change in real wage changes the productivity and efficiency of workers directly.
Therefore, low growth in real wage definitely affects the productivity adversely because low
real wage discourages workers to perform well and hence productivity fall (Storm &
Nasstepad, 2013). Many workers also leave job due to low real wage. With less disposable
income, people tend to spend less and as a result demand for products decreases (Bucheli et
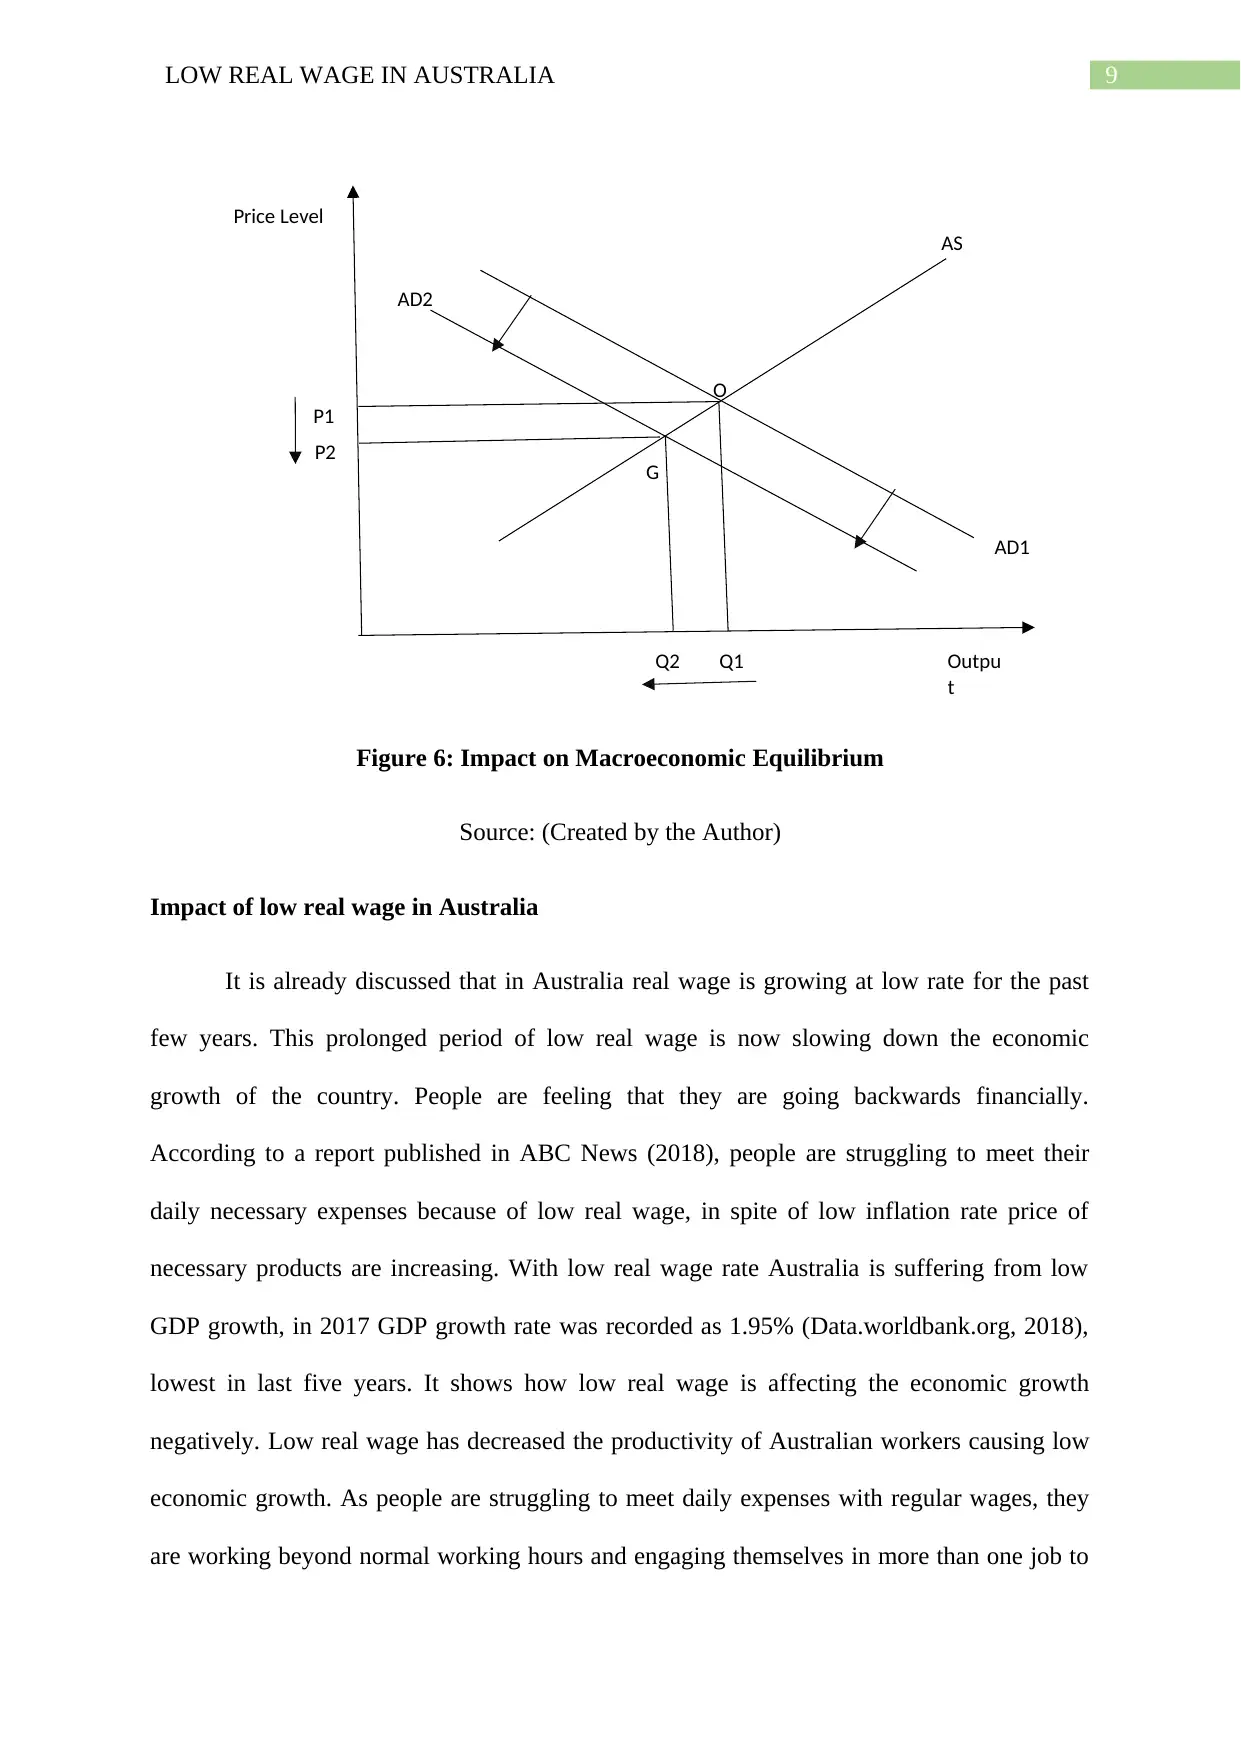
al., 2013). This fall in demand causes aggregate demand (AD) curve to shift left from AD1 to
AD2, as a result the price of the products fall as shown in Figure 2. Therefore, fall in product
price pushes down the price level (P) from P1 to P2. Perceiving the situation firms reduces
their production, which resulted in decreased output (Q) that is from Q1 to Q2. Therefore, the
macroeconomic equilibrium shifts from point O to a lower equilibrium point G. From the
discussion, it can be said that low real wage growth creates a vicious cycle that keeps the real
wage growth rate at a low level.
and productivity. This sluggishness in market keeps the real wage growth at a low rate. There
are reports that provide a different notion regarding low real wage growth in Australia,
according to such reports underemployment is a key factor, which has negative impact on
real wage growth. As of May 2017, 1.13 million people were underemployed in Australia
(The Guardian, 2019). Hence, underemployed workers are paid less than expectation.
Therefore, Australia has been trapped in a vicious cycle of low real wage growth.
Impact of low real wage on macroeconomic equilibrium
Wage is one of the factor that influences workers’ productivity and the case is same with real
wage. Thus, change in real wage changes the productivity and efficiency of workers directly.
Therefore, low growth in real wage definitely affects the productivity adversely because low
real wage discourages workers to perform well and hence productivity fall (Storm &
Nasstepad, 2013). Many workers also leave job due to low real wage. With less disposable
income, people tend to spend less and as a result demand for products decreases (Bucheli et
al., 2013). This fall in demand causes aggregate demand (AD) curve to shift left from AD1 to
AD2, as a result the price of the products fall as shown in Figure 2. Therefore, fall in product
price pushes down the price level (P) from P1 to P2. Perceiving the situation firms reduces
their production, which resulted in decreased output (Q) that is from Q1 to Q2. Therefore, the
macroeconomic equilibrium shifts from point O to a lower equilibrium point G. From the
discussion, it can be said that low real wage growth creates a vicious cycle that keeps the real
wage growth rate at a low level.
⊘ This is a preview!⊘
Do you want full access?
Subscribe today to unlock all pages.
Trusted by 1+ million students worldwide
9LOW REAL WAGE IN AUSTRALIA
Figure 6: Impact on Macroeconomic Equilibrium
Source: (Created by the Author)
Impact of low real wage in Australia
It is already discussed that in Australia real wage is growing at low rate for the past
few years. This prolonged period of low real wage is now slowing down the economic
growth of the country. People are feeling that they are going backwards financially.
According to a report published in ABC News (2018), people are struggling to meet their
daily necessary expenses because of low real wage, in spite of low inflation rate price of
necessary products are increasing. With low real wage rate Australia is suffering from low
GDP growth, in 2017 GDP growth rate was recorded as 1.95% (Data.worldbank.org, 2018),
lowest in last five years. It shows how low real wage is affecting the economic growth
negatively. Low real wage has decreased the productivity of Australian workers causing low
economic growth. As people are struggling to meet daily expenses with regular wages, they
are working beyond normal working hours and engaging themselves in more than one job to
G
O
AS
P1
AD1
Price Level
Outpu
t
AD2
P2
Q1Q2
Paraphrase This Document
Need a fresh take? Get an instant paraphrase of this document with our AI Paraphraser
10LOW REAL WAGE IN AUSTRALIA
earn more, giving rise to poor social life as reported in ABC News. Reuters (2017) reported
that consumption declines in Australia due to low real wage. Hence, impact of low real wage
is quite negative in Australia.
Government Policy
To deal with the issue of low real wage growth the government of Australia should
intervene actively. The government can increase the money supply in the economy by
increasing government expenditure; it will increase the disposable income of the people
suddenly and consumption rises (Palley, 2015). As a result, demand of product will rise and
due to induced effect price will rise. Thus, firms will start to produce more and there will be
increase in real wage of the workers. A cyclical effect will come into play due to this,
productivity of workers will increase, and eventually economy will grow. Apart from this, the
government can also put a floor on minimum real wage; any employer paying its employee
below the given minimum real wage will be prosecuted (Magruder, 2013). This measure will
definitely increase the real wage of the workers directly and reduces income inequality.
Investments on infrastructural development for education, healthcare and transport will
increase employment, real wage and productivity of workers. The government can provide
subsidies to firms and companies to encourage investment (Yu, 2016). It will enable the firms
to increase wage of their employees and boost production. Increased real wage boosts
aggregate demand and thereby increases GDP. With the help of Reserve Bank of Australia,
the government can reduce bank rate and thereby encourages investment, which in long run
will influence the real wage growth positively. Tax rate cuts can be an effective policy in this
regard if the government implement it successfully because tax cuts will increase the amount
of disposable income and helps to boost demand and economic growth (Jha, 2014). Hence,
the above discussed governmental policies are effective ways to mitigate negative effects of
low real wage growth.
11LOW REAL WAGE IN AUSTRALIA
Conclusion
The above discussion helps to conclude that low real wage growth does affect
macroeconomic equilibrium unfavourably. It can be understood from the case of Australia
discussed in this report. Economic growth, standard of living, social life and financial
stability suffered a lot due to low real wage growth in Australia. However, there are several
policies the government of Australia can implement to nullify the effects of low real wage
growth and revive the economy successfully. Policies like minimum real wage, subsidies to
firms and tax cuts are some of the effective ways to increase real wage in Australia.
⊘ This is a preview!⊘
Do you want full access?
Subscribe today to unlock all pages.
Trusted by 1+ million students worldwide
1 out of 15
Related Documents


Your All-in-One AI-Powered Toolkit for Academic Success.
+13062052269
info@desklib.com
Available 24*7 on WhatsApp / Email
![[object Object]](/_next/static/media/star-bottom.7253800d.svg)
Unlock your academic potential
Copyright © 2020–2026 A2Z Services. All Rights Reserved. Developed and managed by ZUCOL.