Economics and Quantitative Analysis Report: Linear Regression
VerifiedAdded on  2023/04/21
|10
|1813
|268
Report
AI Summary
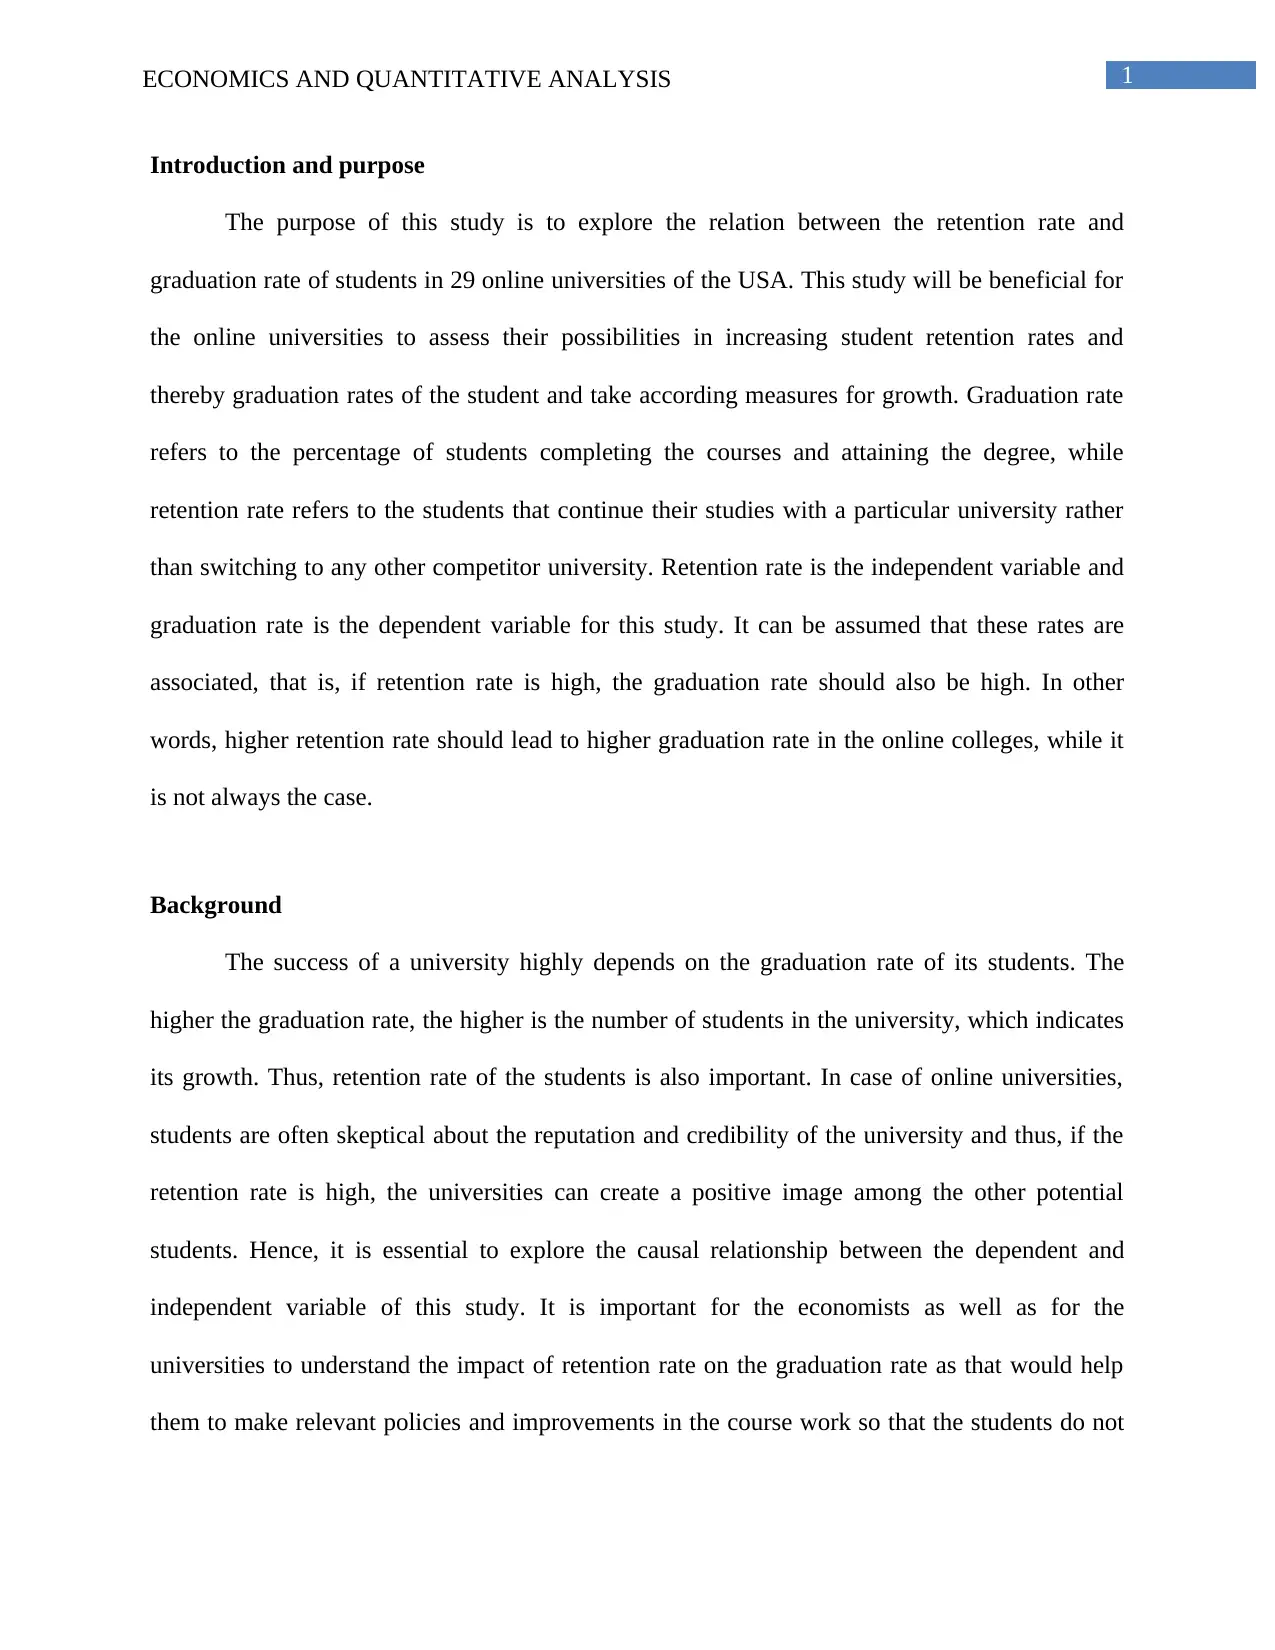
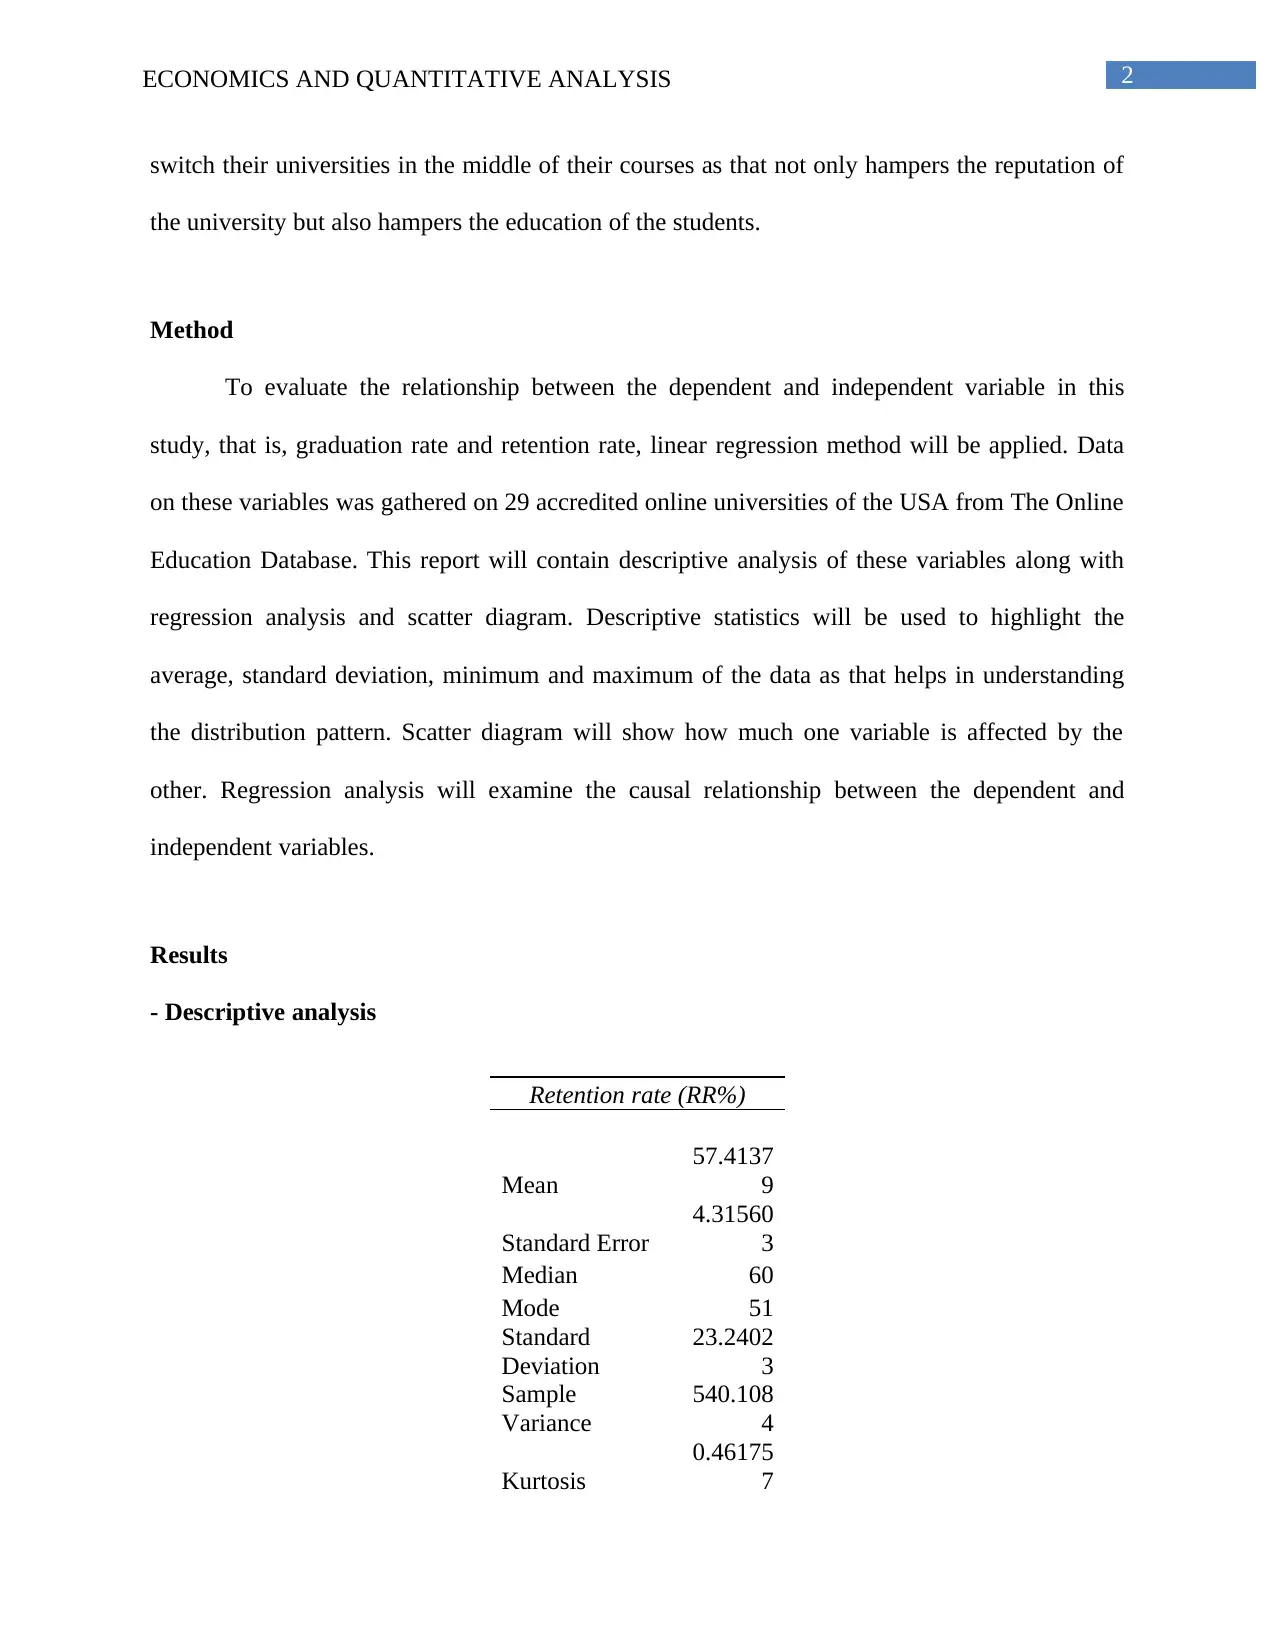
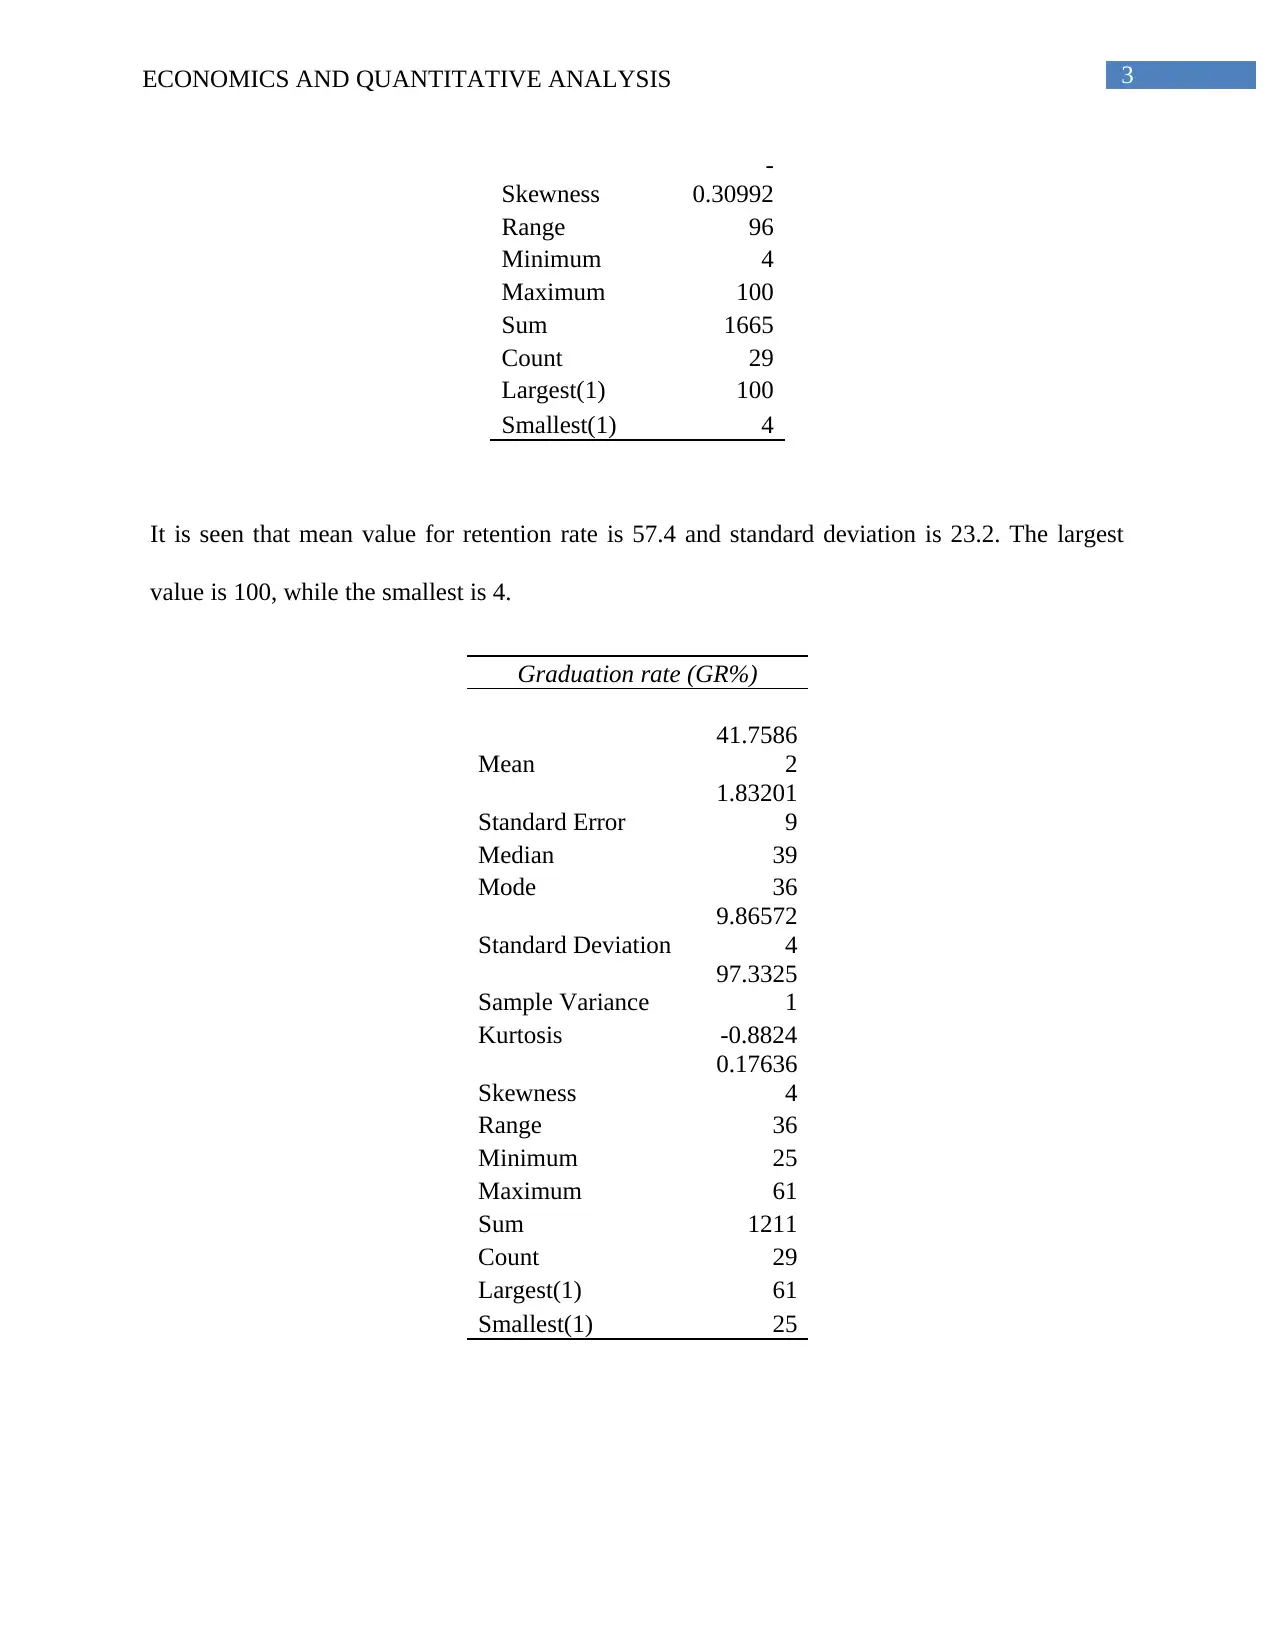
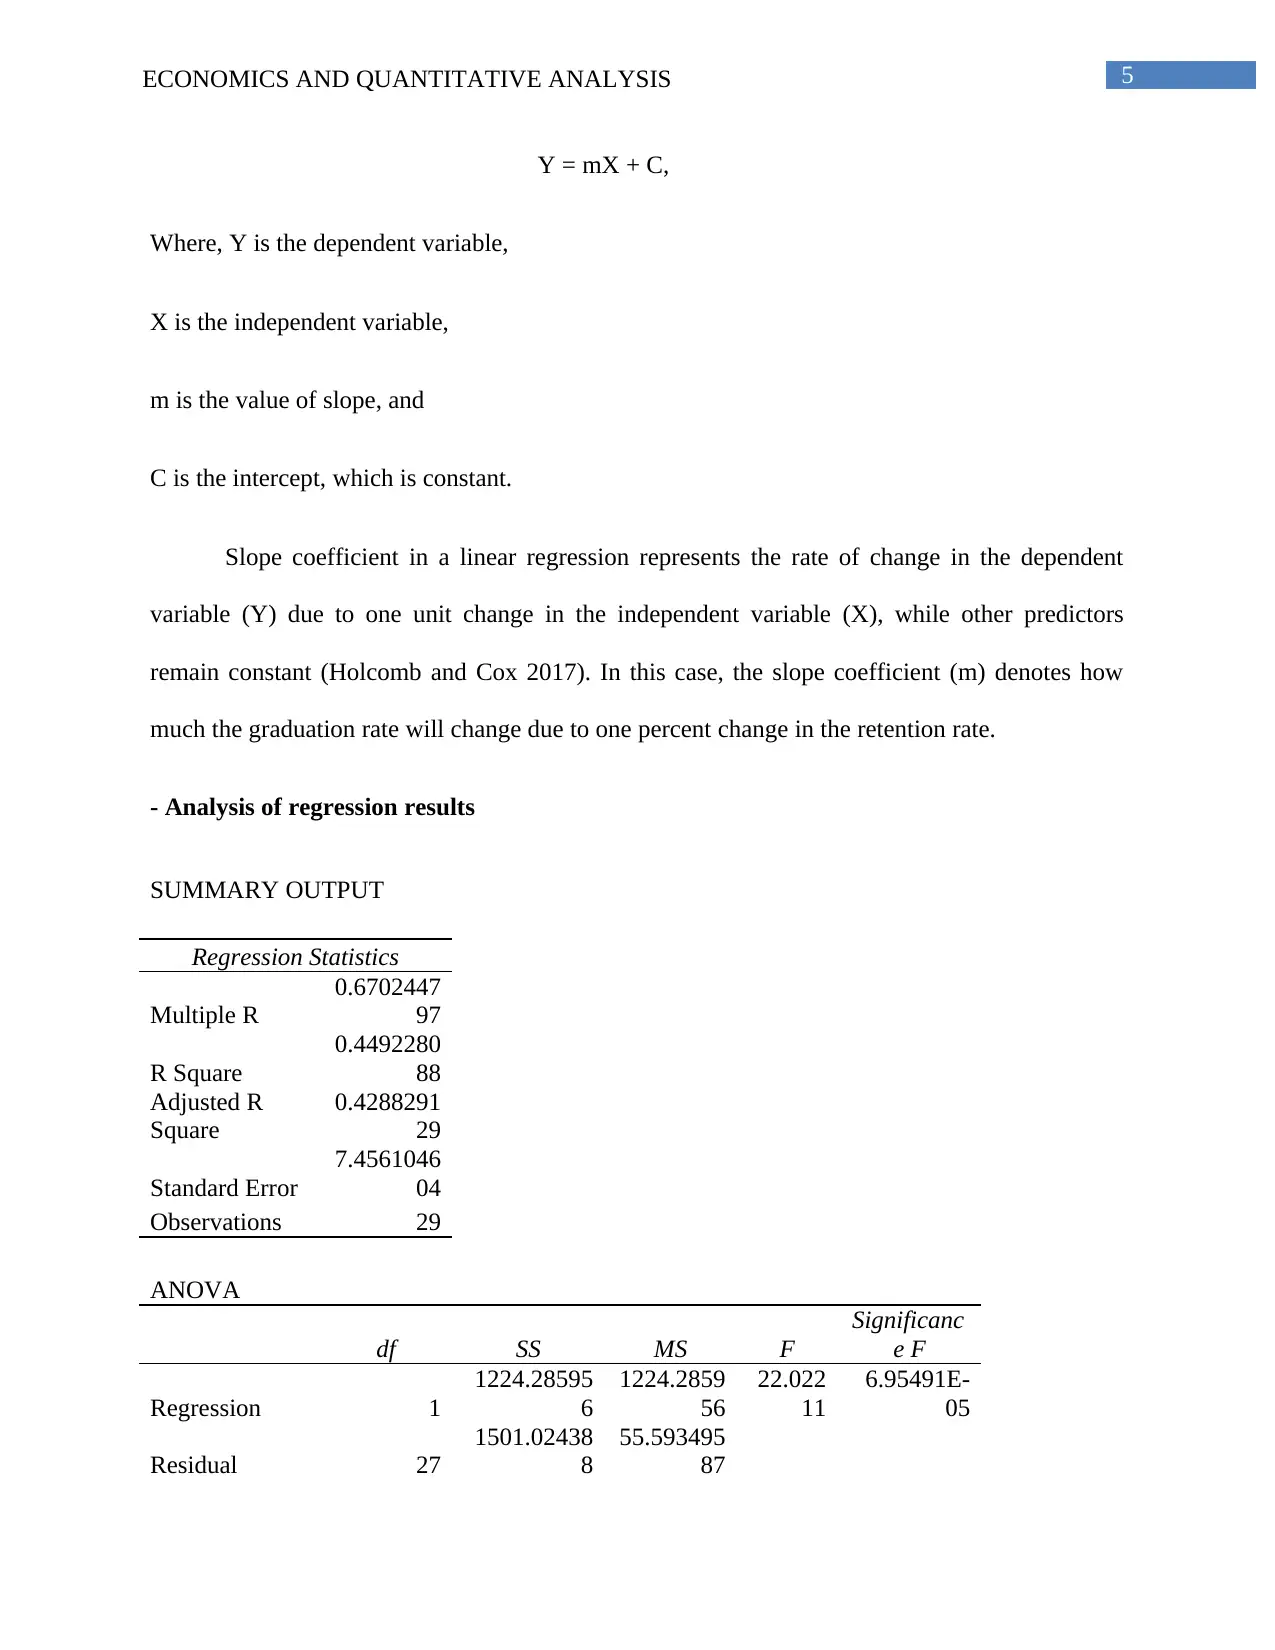
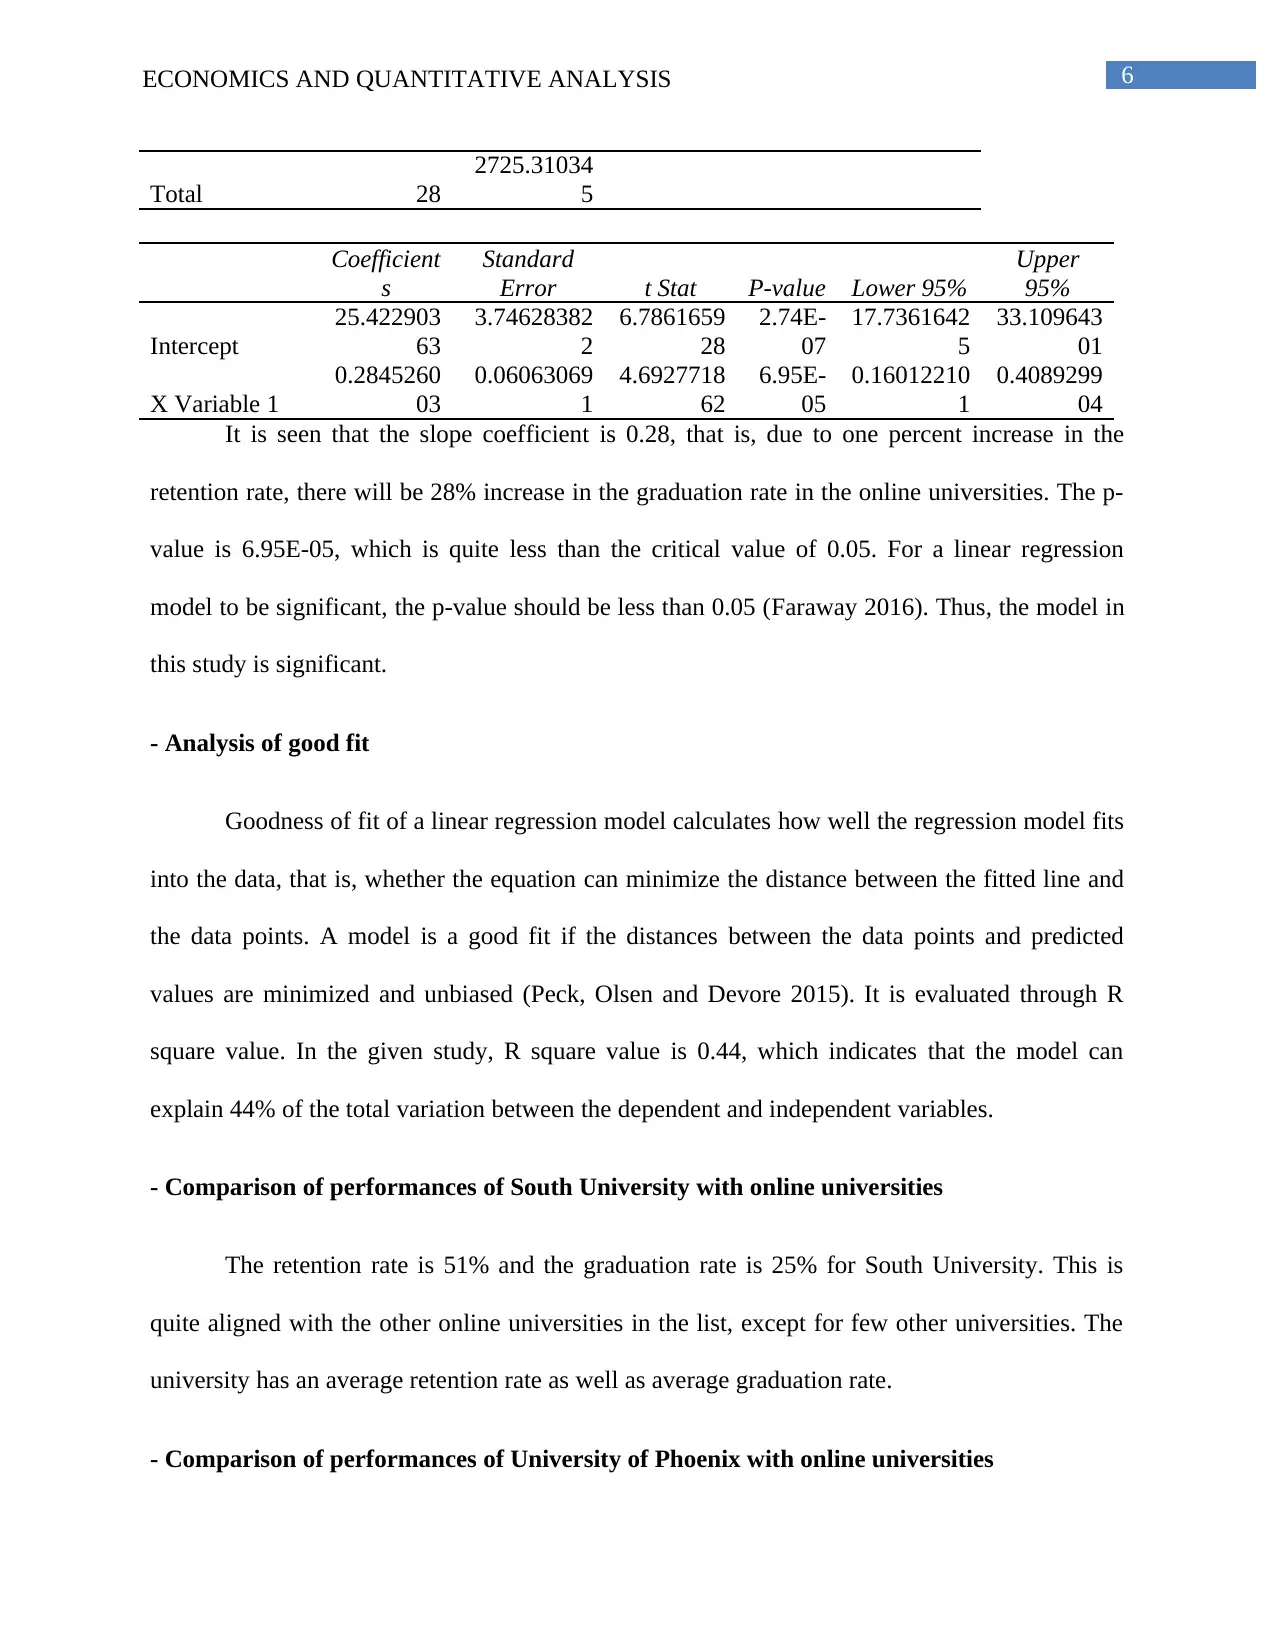
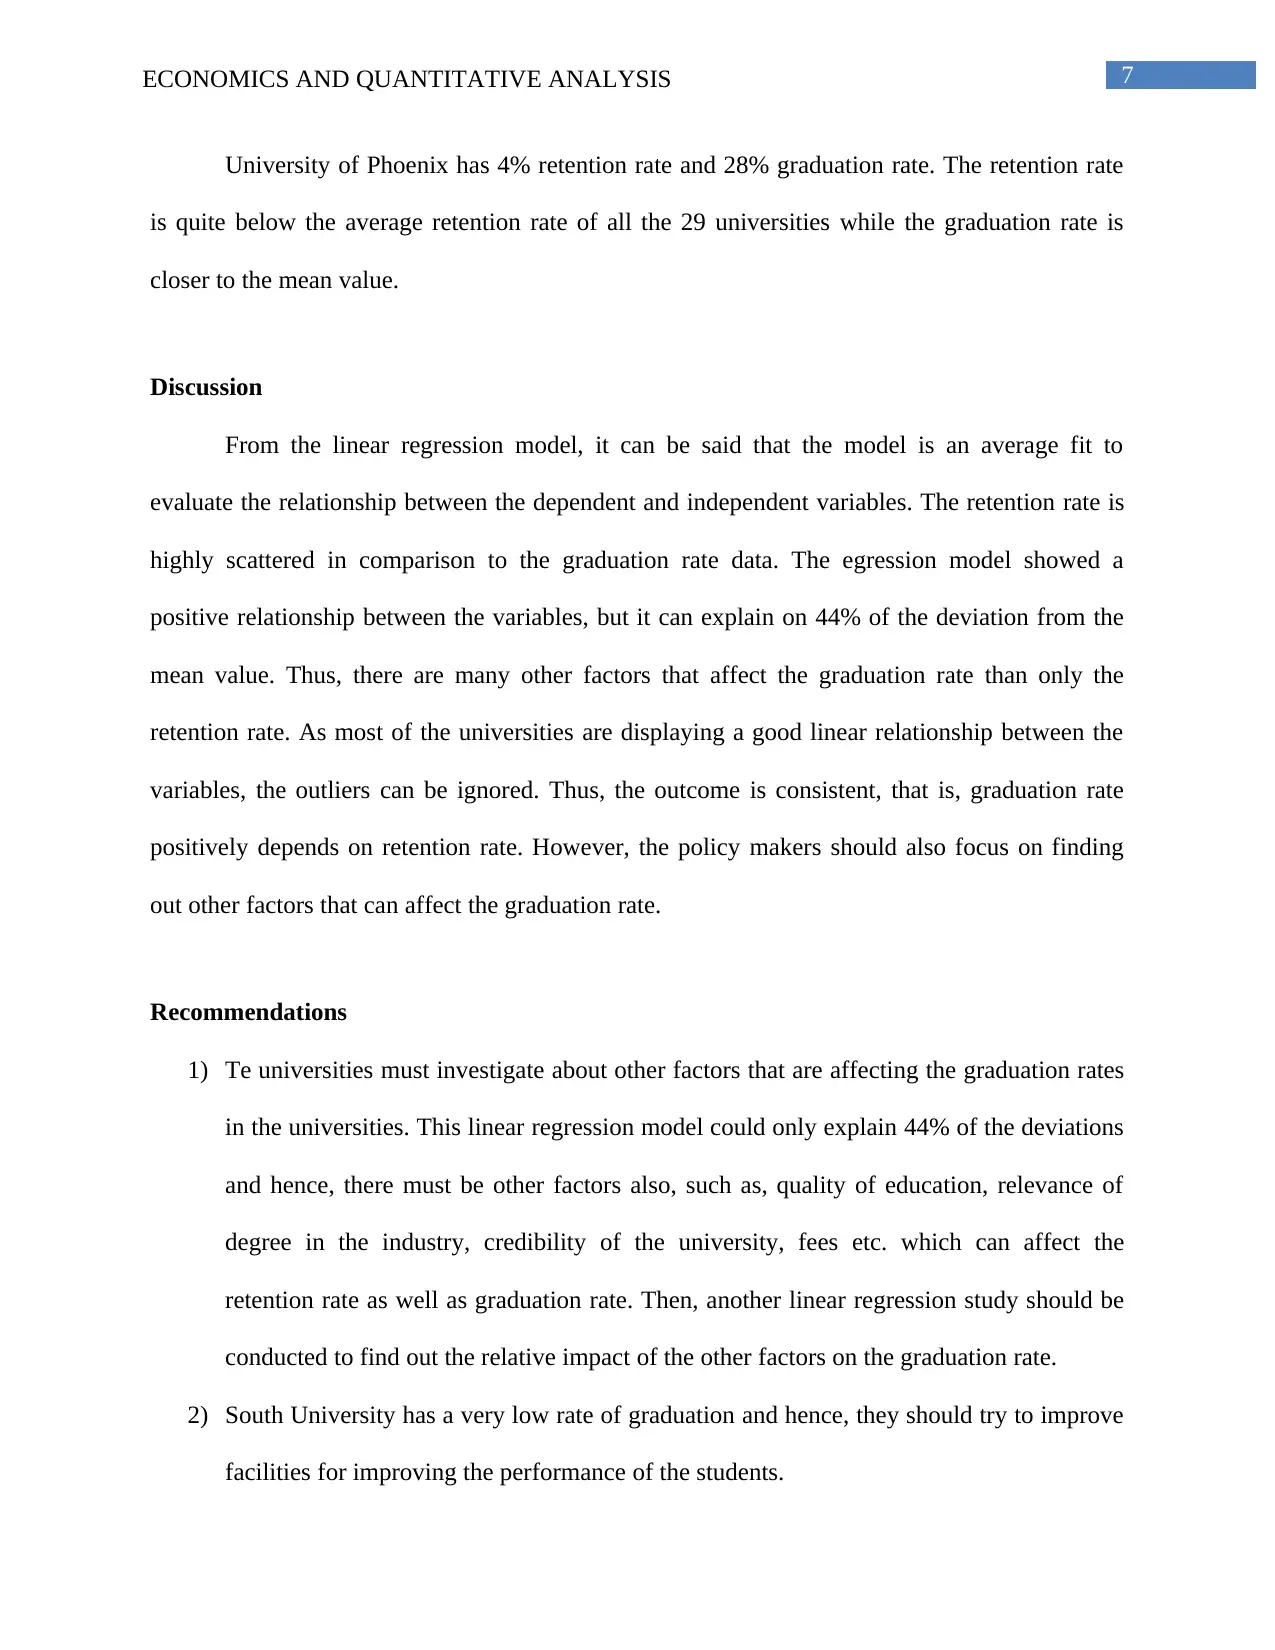
This report presents a linear regression analysis examining the relationship between student retention rates and graduation rates across 29 online universities in the USA. The study begins with an introduction outlining the purpose of the analysis, followed by a background discussion on the significance of these rates for university success. The methodology section details the use of linear regression, descriptive statistics, and scatter diagrams to evaluate the correlation between the independent variable (retention rate) and the dependent variable (graduation rate). The results section provides descriptive statistics, a scatter diagram illustrating the relationship, the regression equation, and an interpretation of the slope coefficient. The analysis includes a summary output of the regression statistics, an assessment of the model's goodness of fit, and comparisons of specific universities' performances. The report concludes with a discussion of the findings, highlighting the positive correlation between retention and graduation rates, and offers recommendations for universities to improve student outcomes, focusing on factors beyond retention and addressing specific cases like South University and University of Phoenix.

Running head: ECONOMICS AND QUANTITATIVE ANALYSIS
ECONOMICS AND QUANTITATIVE ANALYSIS: LINEAR REGRESSION REPORT
Name of the Student:
Name of the University:
Author note:
ECONOMICS AND QUANTITATIVE ANALYSIS: LINEAR REGRESSION REPORT
Name of the Student:
Name of the University:
Author note:
Paraphrase This Document
Need a fresh take? Get an instant paraphrase of this document with our AI Paraphraser

1ECONOMICS AND QUANTITATIVE ANALYSIS
Introduction and purpose
The purpose of this study is to explore the relation between the retention rate and
graduation rate of students in 29 online universities of the USA. This study will be beneficial for
the online universities to assess their possibilities in increasing student retention rates and
thereby graduation rates of the student and take according measures for growth. Graduation rate
refers to the percentage of students completing the courses and attaining the degree, while
retention rate refers to the students that continue their studies with a particular university rather
than switching to any other competitor university. Retention rate is the independent variable and
graduation rate is the dependent variable for this study. It can be assumed that these rates are
associated, that is, if retention rate is high, the graduation rate should also be high. In other
words, higher retention rate should lead to higher graduation rate in the online colleges, while it
is not always the case.
Background
The success of a university highly depends on the graduation rate of its students. The
higher the graduation rate, the higher is the number of students in the university, which indicates
its growth. Thus, retention rate of the students is also important. In case of online universities,
students are often skeptical about the reputation and credibility of the university and thus, if the
retention rate is high, the universities can create a positive image among the other potential
students. Hence, it is essential to explore the causal relationship between the dependent and
independent variable of this study. It is important for the economists as well as for the
universities to understand the impact of retention rate on the graduation rate as that would help
them to make relevant policies and improvements in the course work so that the students do not

2ECONOMICS AND QUANTITATIVE ANALYSIS
switch their universities in the middle of their courses as that not only hampers the reputation of
the university but also hampers the education of the students.
Method
To evaluate the relationship between the dependent and independent variable in this
study, that is, graduation rate and retention rate, linear regression method will be applied. Data
on these variables was gathered on 29 accredited online universities of the USA from The Online
Education Database. This report will contain descriptive analysis of these variables along with
regression analysis and scatter diagram. Descriptive statistics will be used to highlight the
average, standard deviation, minimum and maximum of the data as that helps in understanding
the distribution pattern. Scatter diagram will show how much one variable is affected by the
other. Regression analysis will examine the causal relationship between the dependent and
independent variables.
Results
- Descriptive analysis
Retention rate (RR%)
Mean
57.4137
9
Standard Error
4.31560
3
Median 60
Mode 51
Standard
Deviation
23.2402
3
Sample
Variance
540.108
4
Kurtosis
0.46175
7
⊘ This is a preview!⊘
Do you want full access?
Subscribe today to unlock all pages.

Trusted by 1+ million students worldwide

3ECONOMICS AND QUANTITATIVE ANALYSIS
Skewness
-
0.30992
Range 96
Minimum 4
Maximum 100
Sum 1665
Count 29
Largest(1) 100
Smallest(1) 4
It is seen that mean value for retention rate is 57.4 and standard deviation is 23.2. The largest
value is 100, while the smallest is 4.
Graduation rate (GR%)
Mean
41.7586
2
Standard Error
1.83201
9
Median 39
Mode 36
Standard Deviation
9.86572
4
Sample Variance
97.3325
1
Kurtosis -0.8824
Skewness
0.17636
4
Range 36
Minimum 25
Maximum 61
Sum 1211
Count 29
Largest(1) 61
Smallest(1) 25
Skewness
-
0.30992
Range 96
Minimum 4
Maximum 100
Sum 1665
Count 29
Largest(1) 100
Smallest(1) 4
It is seen that mean value for retention rate is 57.4 and standard deviation is 23.2. The largest
value is 100, while the smallest is 4.
Graduation rate (GR%)
Mean
41.7586
2
Standard Error
1.83201
9
Median 39
Mode 36
Standard Deviation
9.86572
4
Sample Variance
97.3325
1
Kurtosis -0.8824
Skewness
0.17636
4
Range 36
Minimum 25
Maximum 61
Sum 1211
Count 29
Largest(1) 61
Smallest(1) 25
Paraphrase This Document
Need a fresh take? Get an instant paraphrase of this document with our AI Paraphraser

4ECONOMICS AND QUANTITATIVE ANALYSIS
The mean is 41.7, which is less than the mean of retention rate, standard deviation is 9.8,
maximum is 61 and minimum observation is 25.
It can be said that the mean and standard deviation for the graduation rate is lower than
those of retention rate. The data points are more deviated from the mean values in case of
retention rate than for the graduation rates (Gupta 2016). Various factors can be accredited for
this.
- Scatter diagram
0 5 10 15 20 25 30 35
0
20
40
60
80
100
120
RR(%)
GR(%)
Retention rate
Graduation rate
This scatter diagram denotes the pattern in the relationship between the two variables. It
shows both the variables have an upward rising trend, but the retention rate is more scattered
than the graduation rate. Both are positively related and rise in retention rate will lead to rise in
graduation rate (Chambers 2017).
- Regression equation and meaning of slope coefficient
The regression equation is:

5ECONOMICS AND QUANTITATIVE ANALYSIS
Y = mX + C,
Where, Y is the dependent variable,
X is the independent variable,
m is the value of slope, and
C is the intercept, which is constant.
Slope coefficient in a linear regression represents the rate of change in the dependent
variable (Y) due to one unit change in the independent variable (X), while other predictors
remain constant (Holcomb and Cox 2017). In this case, the slope coefficient (m) denotes how
much the graduation rate will change due to one percent change in the retention rate.
- Analysis of regression results
SUMMARY OUTPUT
Regression Statistics
Multiple R
0.6702447
97
R Square
0.4492280
88
Adjusted R
Square
0.4288291
29
Standard Error
7.4561046
04
Observations 29
ANOVA
df SS MS F
Significanc
e F
Regression 1
1224.28595
6
1224.2859
56
22.022
11
6.95491E-
05
Residual 27
1501.02438
8
55.593495
87
⊘ This is a preview!⊘
Do you want full access?
Subscribe today to unlock all pages.

Trusted by 1+ million students worldwide

6ECONOMICS AND QUANTITATIVE ANALYSIS
Total 28
2725.31034
5
Coefficient
s
Standard
Error t Stat P-value Lower 95%
Upper
95%
Intercept
25.422903
63
3.74628382
2
6.7861659
28
2.74E-
07
17.7361642
5
33.109643
01
X Variable 1
0.2845260
03
0.06063069
1
4.6927718
62
6.95E-
05
0.16012210
1
0.4089299
04
It is seen that the slope coefficient is 0.28, that is, due to one percent increase in the
retention rate, there will be 28% increase in the graduation rate in the online universities. The p-
value is 6.95E-05, which is quite less than the critical value of 0.05. For a linear regression
model to be significant, the p-value should be less than 0.05 (Faraway 2016). Thus, the model in
this study is significant.
- Analysis of good fit
Goodness of fit of a linear regression model calculates how well the regression model fits
into the data, that is, whether the equation can minimize the distance between the fitted line and
the data points. A model is a good fit if the distances between the data points and predicted
values are minimized and unbiased (Peck, Olsen and Devore 2015). It is evaluated through R
square value. In the given study, R square value is 0.44, which indicates that the model can
explain 44% of the total variation between the dependent and independent variables.
- Comparison of performances of South University with online universities
The retention rate is 51% and the graduation rate is 25% for South University. This is
quite aligned with the other online universities in the list, except for few other universities. The
university has an average retention rate as well as average graduation rate.
- Comparison of performances of University of Phoenix with online universities
Paraphrase This Document
Need a fresh take? Get an instant paraphrase of this document with our AI Paraphraser

7ECONOMICS AND QUANTITATIVE ANALYSIS
University of Phoenix has 4% retention rate and 28% graduation rate. The retention rate
is quite below the average retention rate of all the 29 universities while the graduation rate is
closer to the mean value.
Discussion
From the linear regression model, it can be said that the model is an average fit to
evaluate the relationship between the dependent and independent variables. The retention rate is
highly scattered in comparison to the graduation rate data. The egression model showed a
positive relationship between the variables, but it can explain on 44% of the deviation from the
mean value. Thus, there are many other factors that affect the graduation rate than only the
retention rate. As most of the universities are displaying a good linear relationship between the
variables, the outliers can be ignored. Thus, the outcome is consistent, that is, graduation rate
positively depends on retention rate. However, the policy makers should also focus on finding
out other factors that can affect the graduation rate.
Recommendations
1) Te universities must investigate about other factors that are affecting the graduation rates
in the universities. This linear regression model could only explain 44% of the deviations
and hence, there must be other factors also, such as, quality of education, relevance of
degree in the industry, credibility of the university, fees etc. which can affect the
retention rate as well as graduation rate. Then, another linear regression study should be
conducted to find out the relative impact of the other factors on the graduation rate.
2) South University has a very low rate of graduation and hence, they should try to improve
facilities for improving the performance of the students.

8ECONOMICS AND QUANTITATIVE ANALYSIS
3) University of Phoenix has a very poor retention rate and thus, they should focus on
reducing student turnover by implementing better and improved education and other
services.
3) University of Phoenix has a very poor retention rate and thus, they should focus on
reducing student turnover by implementing better and improved education and other
services.
⊘ This is a preview!⊘
Do you want full access?
Subscribe today to unlock all pages.

Trusted by 1+ million students worldwide

9ECONOMICS AND QUANTITATIVE ANALYSIS
References
Chambers, J.M., 2017. Graphical Methods for Data Analysis: 0. Chapman and Hall/CRC.
Faraway, J.J., 2016. Extending the linear model with R: generalized linear, mixed effects and
nonparametric regression models (Vol. 124). CRC press.
Gupta, B., 2016. Introduction to Basic Statistics. In Interview Questions in Business
Analytics (pp. 23-35). Apress, Berkeley, CA.
Holcomb, Z.C. and Cox, K.S., 2017. Interpreting Basic Statistics: A Workbook Based on
Excerpts from Journal Articles. Routledge.
Peck, R., Olsen, C. and Devore, J.L., 2015. Introduction to statistics and data analysis. Cengage
Learning.
1 out of 10
Related Documents

Your All-in-One AI-Powered Toolkit for Academic Success.
 +13062052269
info@desklib.com
Available 24*7 on WhatsApp / Email
Unlock your academic potential
Copyright © 2020–2025 A2Z Services. All Rights Reserved. Developed and managed by ZUCOL.