Business Economics Report: Economic Analysis of Sri Lanka's Economy
VerifiedAdded on 2022/05/25
|27
|3791
|14
Report
AI Summary
This comprehensive business economics report delves into various key economic concepts. It begins with an analysis of Production Possibility Curves (PPC) using data from China and the United States, calculating opportunity costs to determine comparative advantages in producing rice and computers. The report then examines inflation, differentiating between demand-pull and cost-push inflation, supported by relevant graphs and examples. Furthermore, it explores different market structures, including perfect competition, monopolistic competition, pure monopoly, and oligopoly, outlining their characteristics, advantages, and disadvantages. Finally, the report discusses international trade, covering absolute and comparative advantage theories, and analyzes the economic situation in Sri Lanka, including its exports, imports, trade barriers, and the importance of international trade.
Table of Contents
Acknowledgement.......................................................................................................................................
Executive Summary.....................................................................................................................................
PPC Curves..................................................................................................................................................
Opportunity cost..........................................................................................................................................
Curves........................................................................................................................................................
ATC Curve.................................................................................................................................................
AVC Curve................................................................................................................................................
AFC Curve.................................................................................................................................................
MC Curve..................................................................................................................................................
Inflation......................................................................................................................................................
Demand- pull inflation...............................................................................................................................
Cost- push inflation....................................................................................................................................
Market Structure........................................................................................................................................
Market models...........................................................................................................................................
Perfect Competition...............................................................................................................................
Monopolistic Competition.....................................................................................................................
Pure Monopoly.......................................................................................................................................
Oligopoly...............................................................................................................................................
International trade......................................................................................................................................
Absolute advantage thread.....................................................................................................................
Comparative advantage thread...............................................................................................................
Economy situation in srilanka...................................................................................................................
Exports and imports...................................................................................................................................
Importance of international trade...............................................................................................................
Trade barriers.............................................................................................................................................
Conclusion.................................................................................................................................................
References..................................................................................................................................................
Table of Figures
1 Business Economics
Paraphrase This Document
Need a fresh take? Get an instant paraphrase of this document with our AI Paraphraser
Figure 1: PPC of China ...................................................................................................................
7
Figure 2: PPC of USA.................................................................................................................... 8
Figure 3: ATC Curve .................................................................................................................... 10
Figure 4: AVC Curve ....................................................................................................................
11
Figure 5: AFC Curve .................................................................................................................... 12
Figure 6: MC Curve ......................................................................................................................
13
Figure 7: Demand- Pull inflation ..................................................................................................
15
Figure 8: Cost- Push inflation .......................................................................................................
16
Figure 9: Exports........................................................................................................................... 25
Figure 10: Imports......................................................................................................................... 25
Table 1 ............................................................................................................................................ 7
Table 2: opportunity cost 1 ............................................................................................................. 8
Table 3: opportunity cost 2 ............................................................................................................. 9
Table 4 .......................................................................................................................................... 10
Table 5: Advantages and disadvantages of perfect competition ...................................................
18
Table 6: Advantages and disadvantages of monopolistic competition .........................................
20
Table 7: Advantages and disadvantages of pure monopoly.......................................................... 21
Table 8: Advantages and disadvantages of Oligopoly ..................................................................
22
2 Business Economics

Acknowledgement
I would like to express my sincere gratitude and appreciation to all those who always guided me
and gave me the possibility to complete this business economics report. I take this opportunity to
express my utmost regards to our respected lecturers Mrs. Harshani chathurika whose
unparalleled knowledge, moral fiber and judgment along with their know-how, was an immense
support in completing this assignment report in a highly successful manner.
I would also like to acknowledge with much appreciate the crucial role of the staff of library and
computer laboratory, who gave me the permission to use all required machinery and refer the
books. Many people, especially my classmates have made valuable comments for my report. I
also specially thanks for my parents that who encouraged me and about strengthening me at all
the time.
3 Business Economics
⊘ This is a preview!⊘
Do you want full access?
Subscribe today to unlock all pages.
Trusted by 1+ million students worldwide
Executive Summary
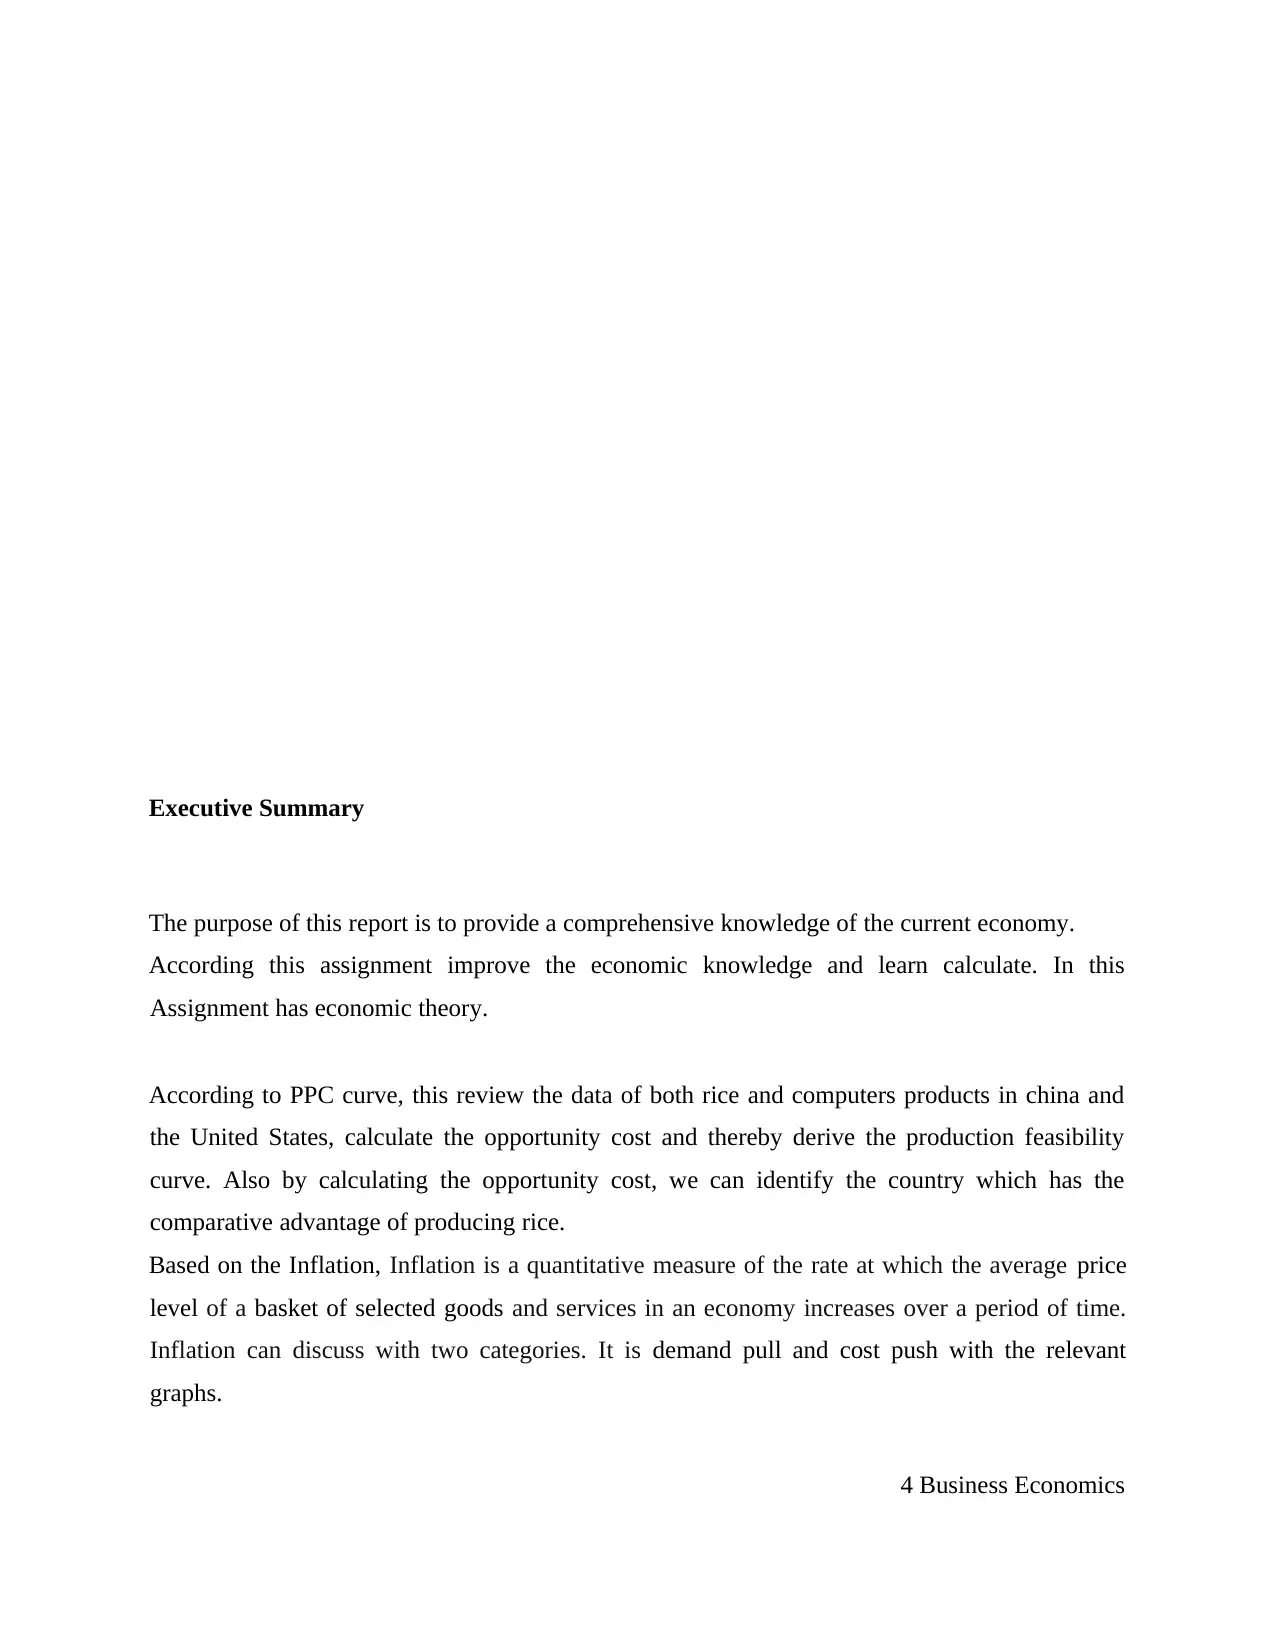
The purpose of this report is to provide a comprehensive knowledge of the current economy.
According this assignment improve the economic knowledge and learn calculate. In this
Assignment has economic theory.
According to PPC curve, this review the data of both rice and computers products in china and
the United States, calculate the opportunity cost and thereby derive the production feasibility
curve. Also by calculating the opportunity cost, we can identify the country which has the
comparative advantage of producing rice.
Based on the Inflation, Inflation is a quantitative measure of the rate at which the average price
level of a basket of selected goods and services in an economy increases over a period of time.
Inflation can discuss with two categories. It is demand pull and cost push with the relevant
graphs.
4 Business Economics
Paraphrase This Document
Need a fresh take? Get an instant paraphrase of this document with our AI Paraphraser
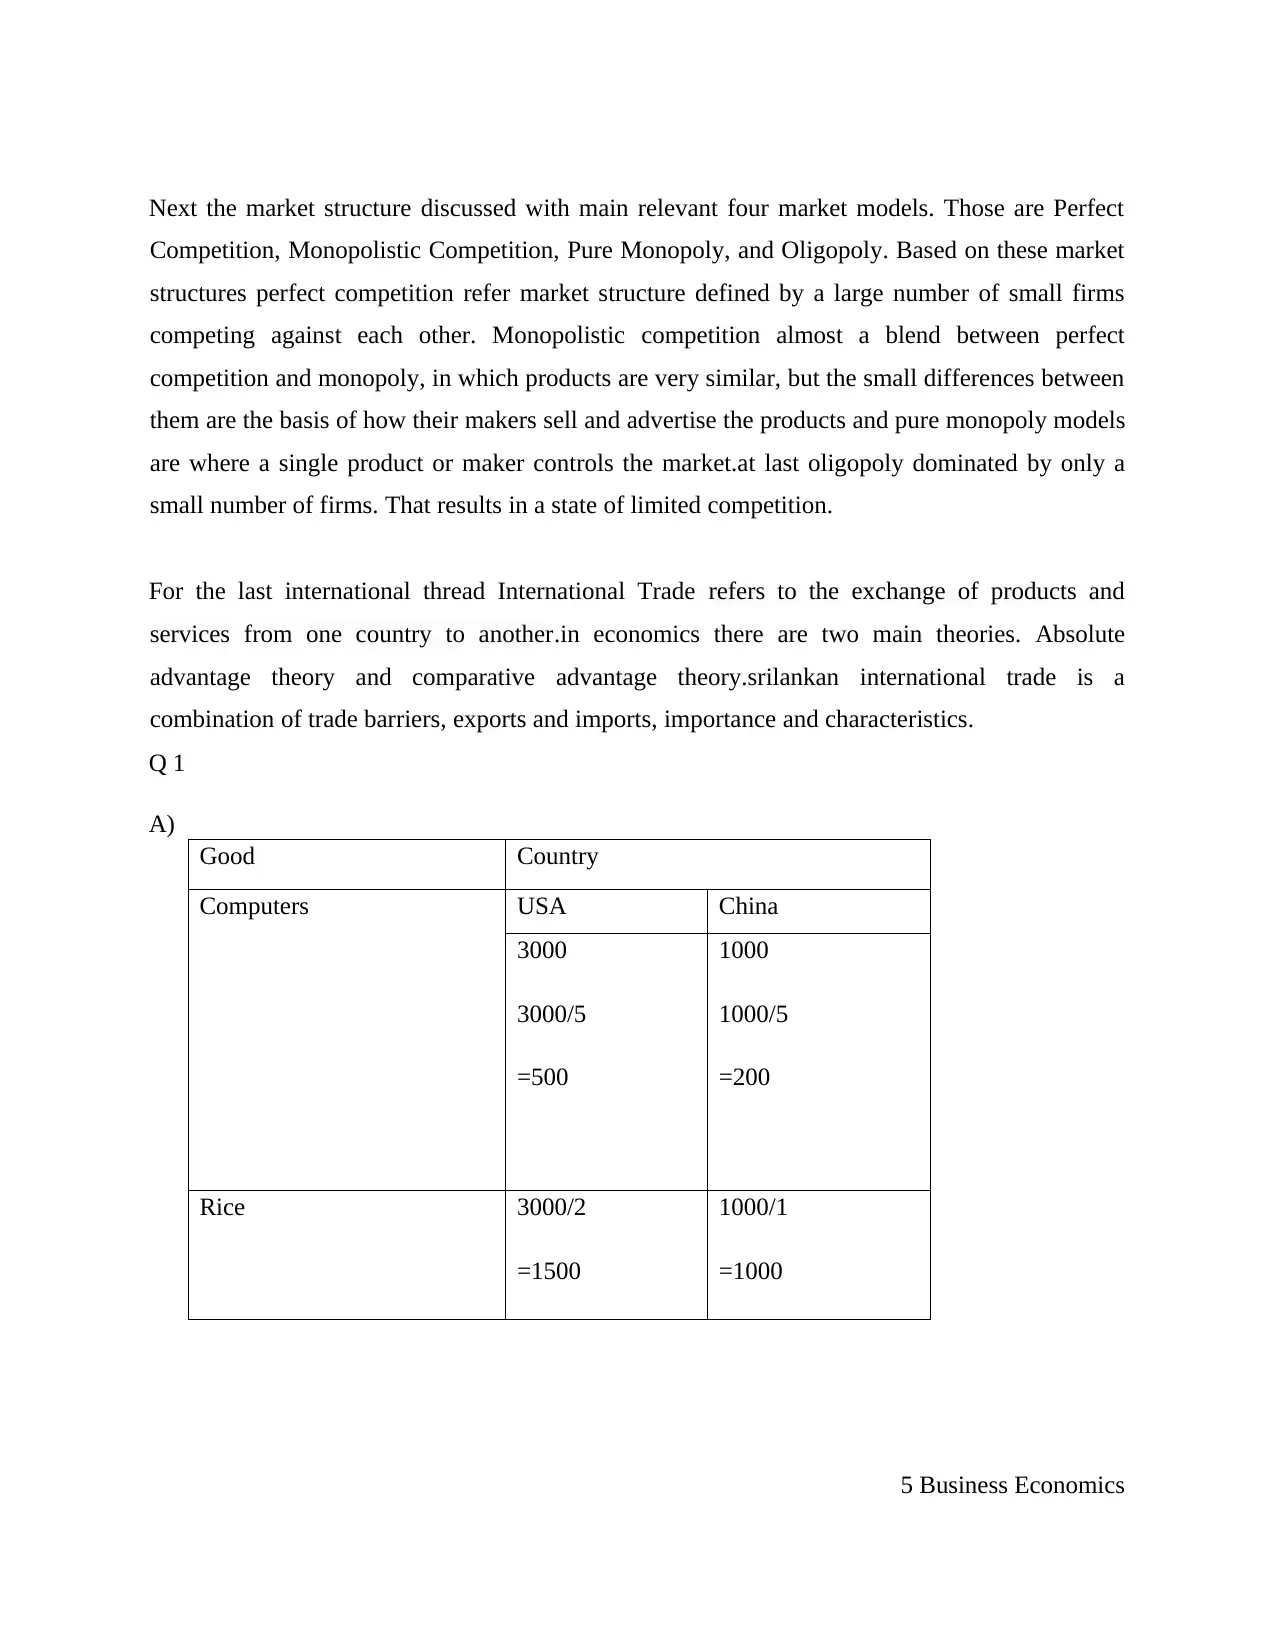
Next the market structure discussed with main relevant four market models. Those are Perfect
Competition, Monopolistic Competition, Pure Monopoly, and Oligopoly. Based on these market
structures perfect competition refer market structure defined by a large number of small firms
competing against each other. Monopolistic competition almost a blend between perfect
competition and monopoly, in which products are very similar, but the small differences between
them are the basis of how their makers sell and advertise the products and pure monopoly models
are where a single product or maker controls the market.at last oligopoly dominated by only a
small number of firms. That results in a state of limited competition.
For the last international thread International Trade refers to the exchange of products and
services from one country to another.in economics there are two main theories. Absolute
advantage theory and comparative advantage theory.srilankan international trade is a
combination of trade barriers, exports and imports, importance and characteristics.
Q 1
A)
Good Country
Computers USA China
3000
3000/5
=500
1000
1000/5
=200
Rice 3000/2
=1500
1000/1
=1000
5 Business Economics
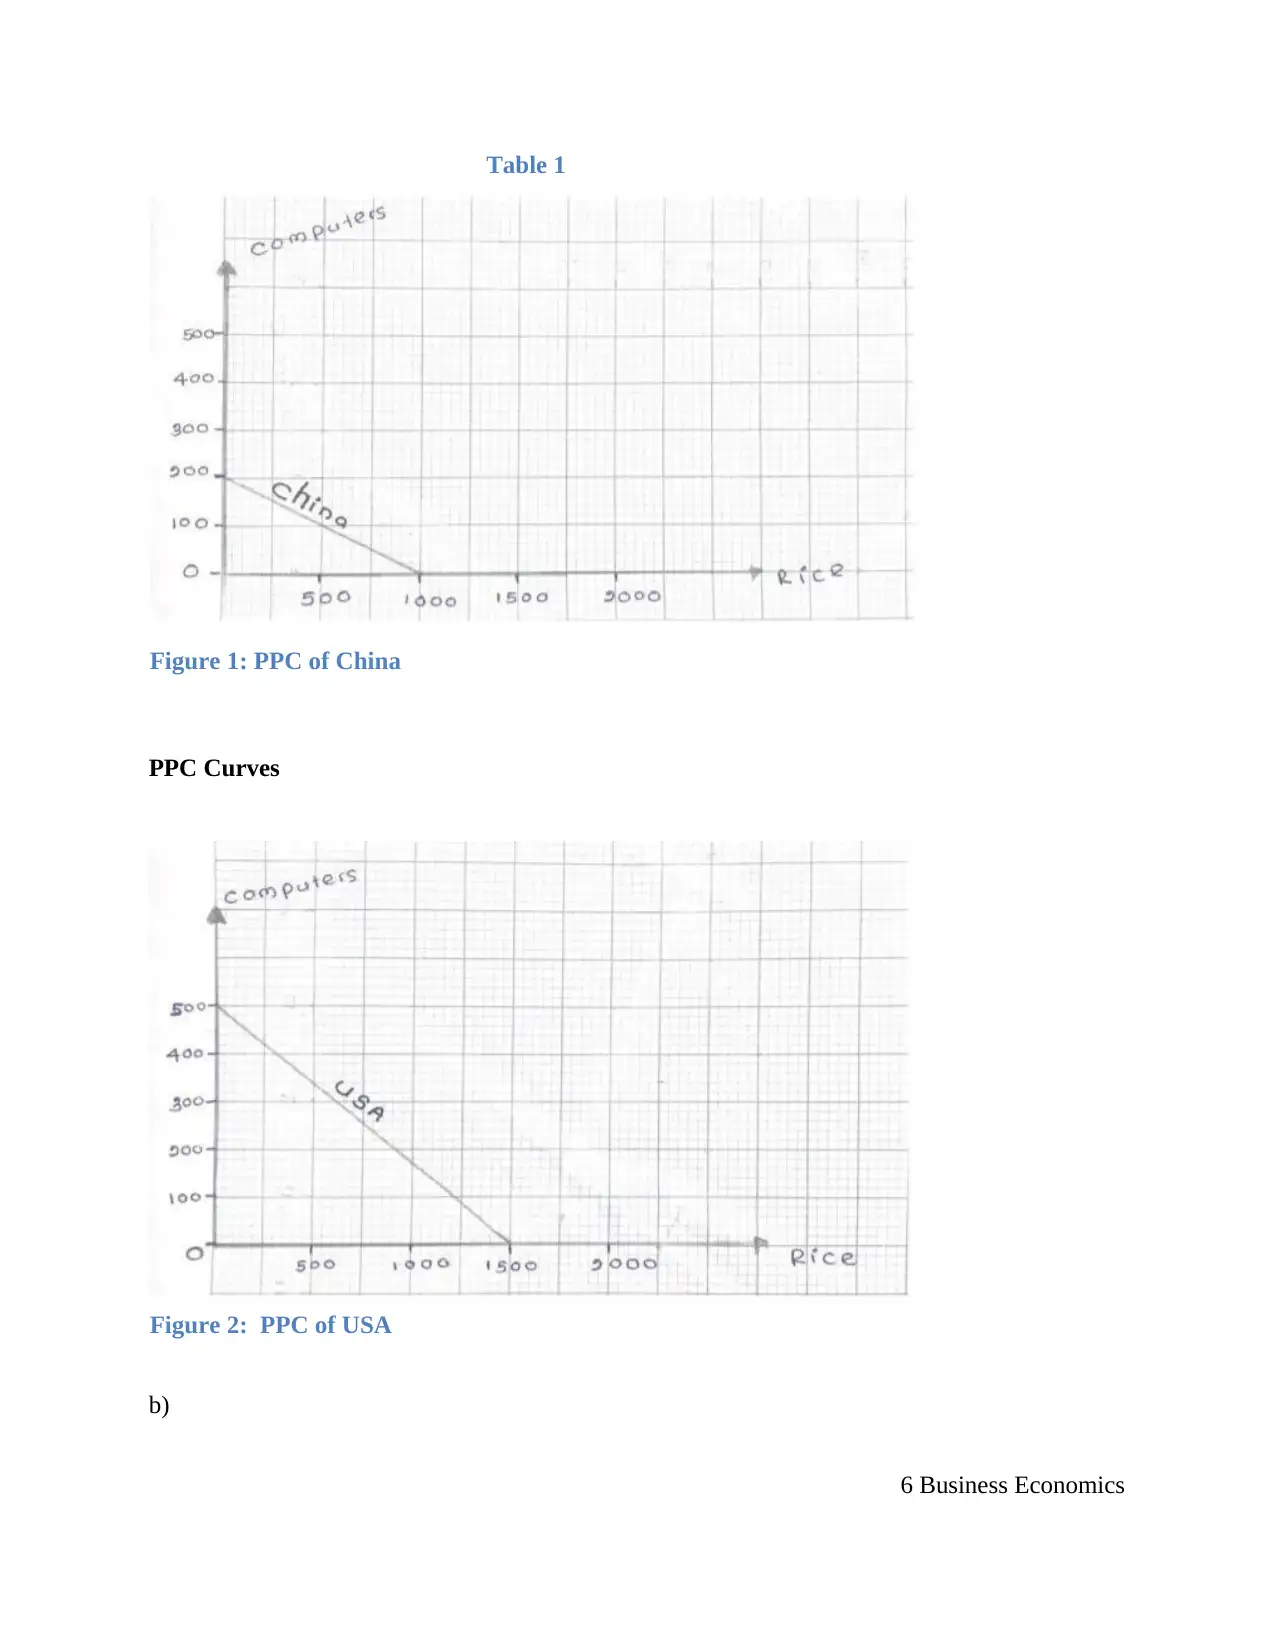
Table 1
Figure 1: PPC of China
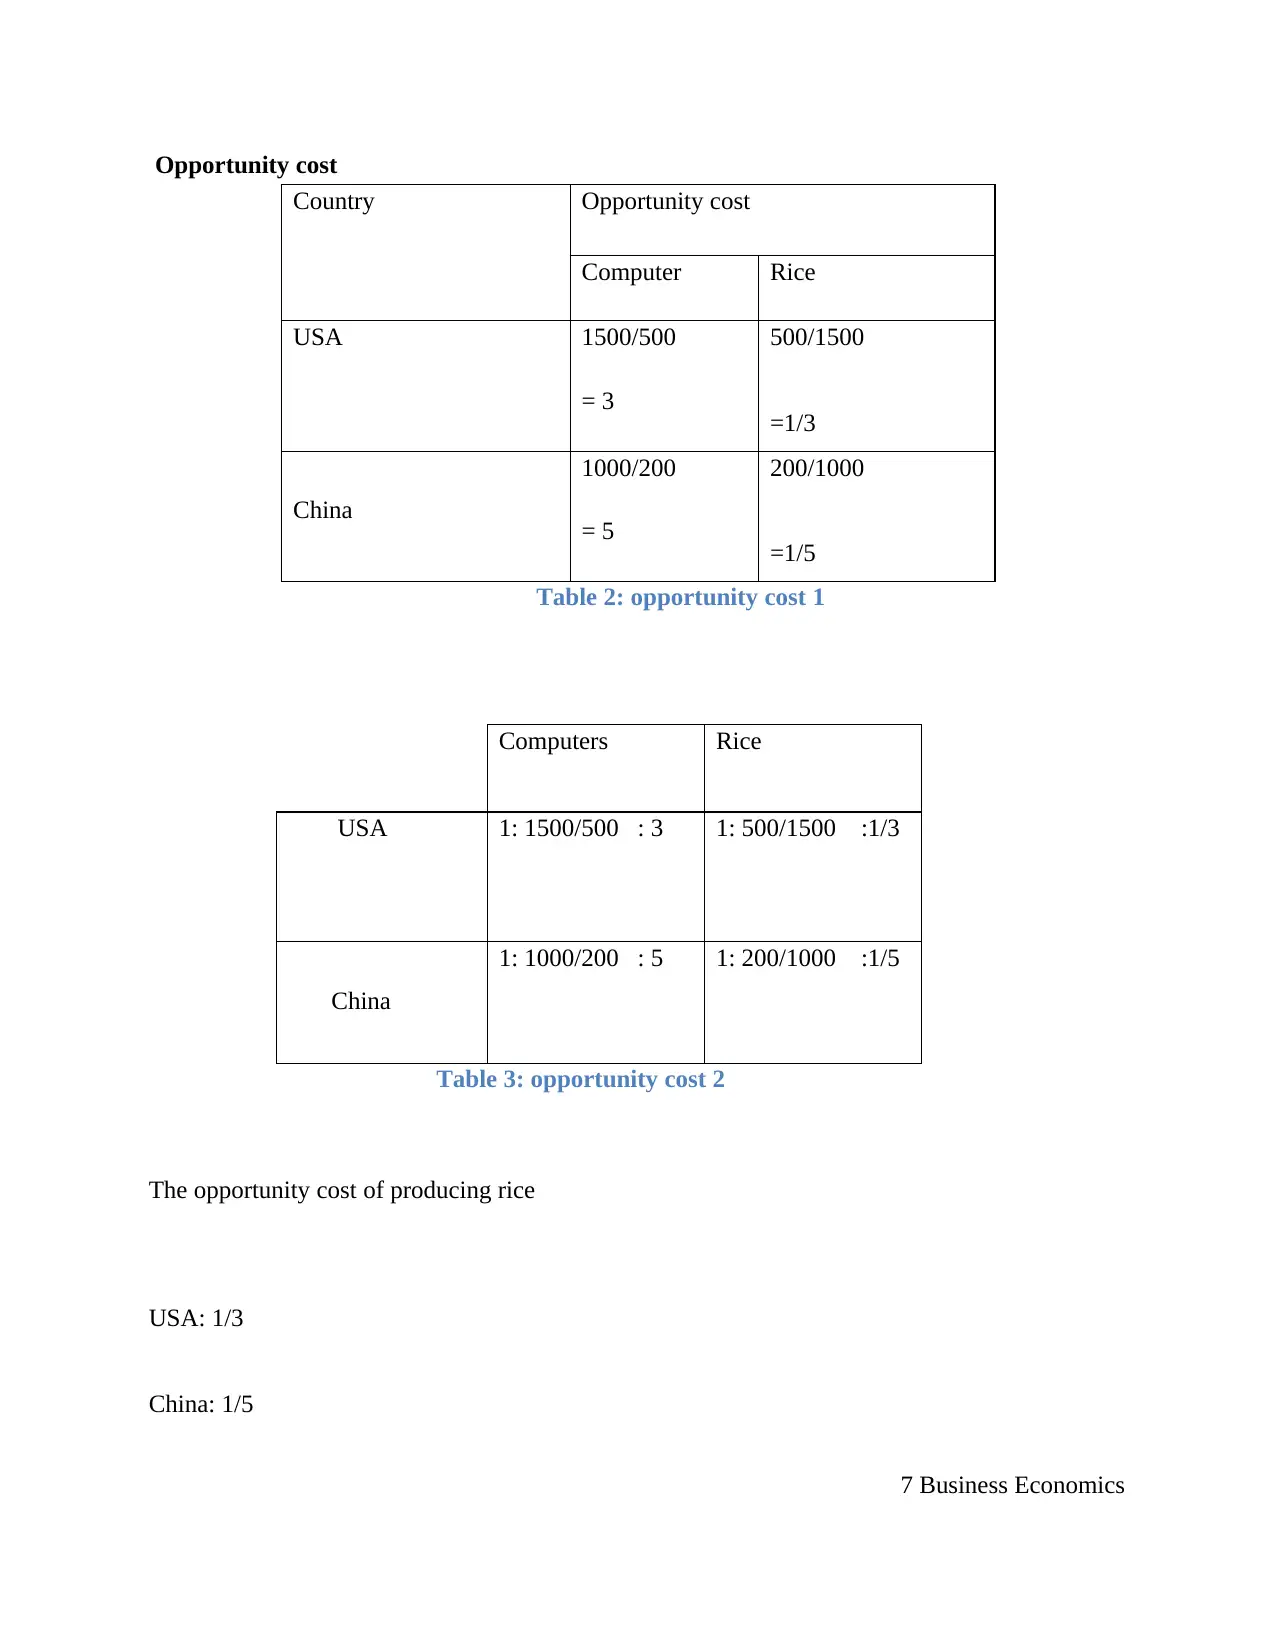
PPC Curves
Figure 2: PPC of USA
b)
6 Business Economics
Figure 1: PPC of China
PPC Curves
Figure 2: PPC of USA
b)
6 Business Economics
⊘ This is a preview!⊘
Do you want full access?
Subscribe today to unlock all pages.
Trusted by 1+ million students worldwide
Opportunity cost
Country Opportunity cost
Computer Rice
USA 1500/500
= 3
500/1500
=1/3
China
1000/200
= 5
200/1000
=1/5
Table 2: opportunity cost 1
Computers Rice
USA 1: 1500/500 : 3 1: 500/1500 :1/3
China
1: 1000/200 : 5 1: 200/1000 :1/5
Table 3: opportunity cost 2
The opportunity cost of producing rice
USA: 1/3
China: 1/5
7 Business Economics
Paraphrase This Document
Need a fresh take? Get an instant paraphrase of this document with our AI Paraphraser
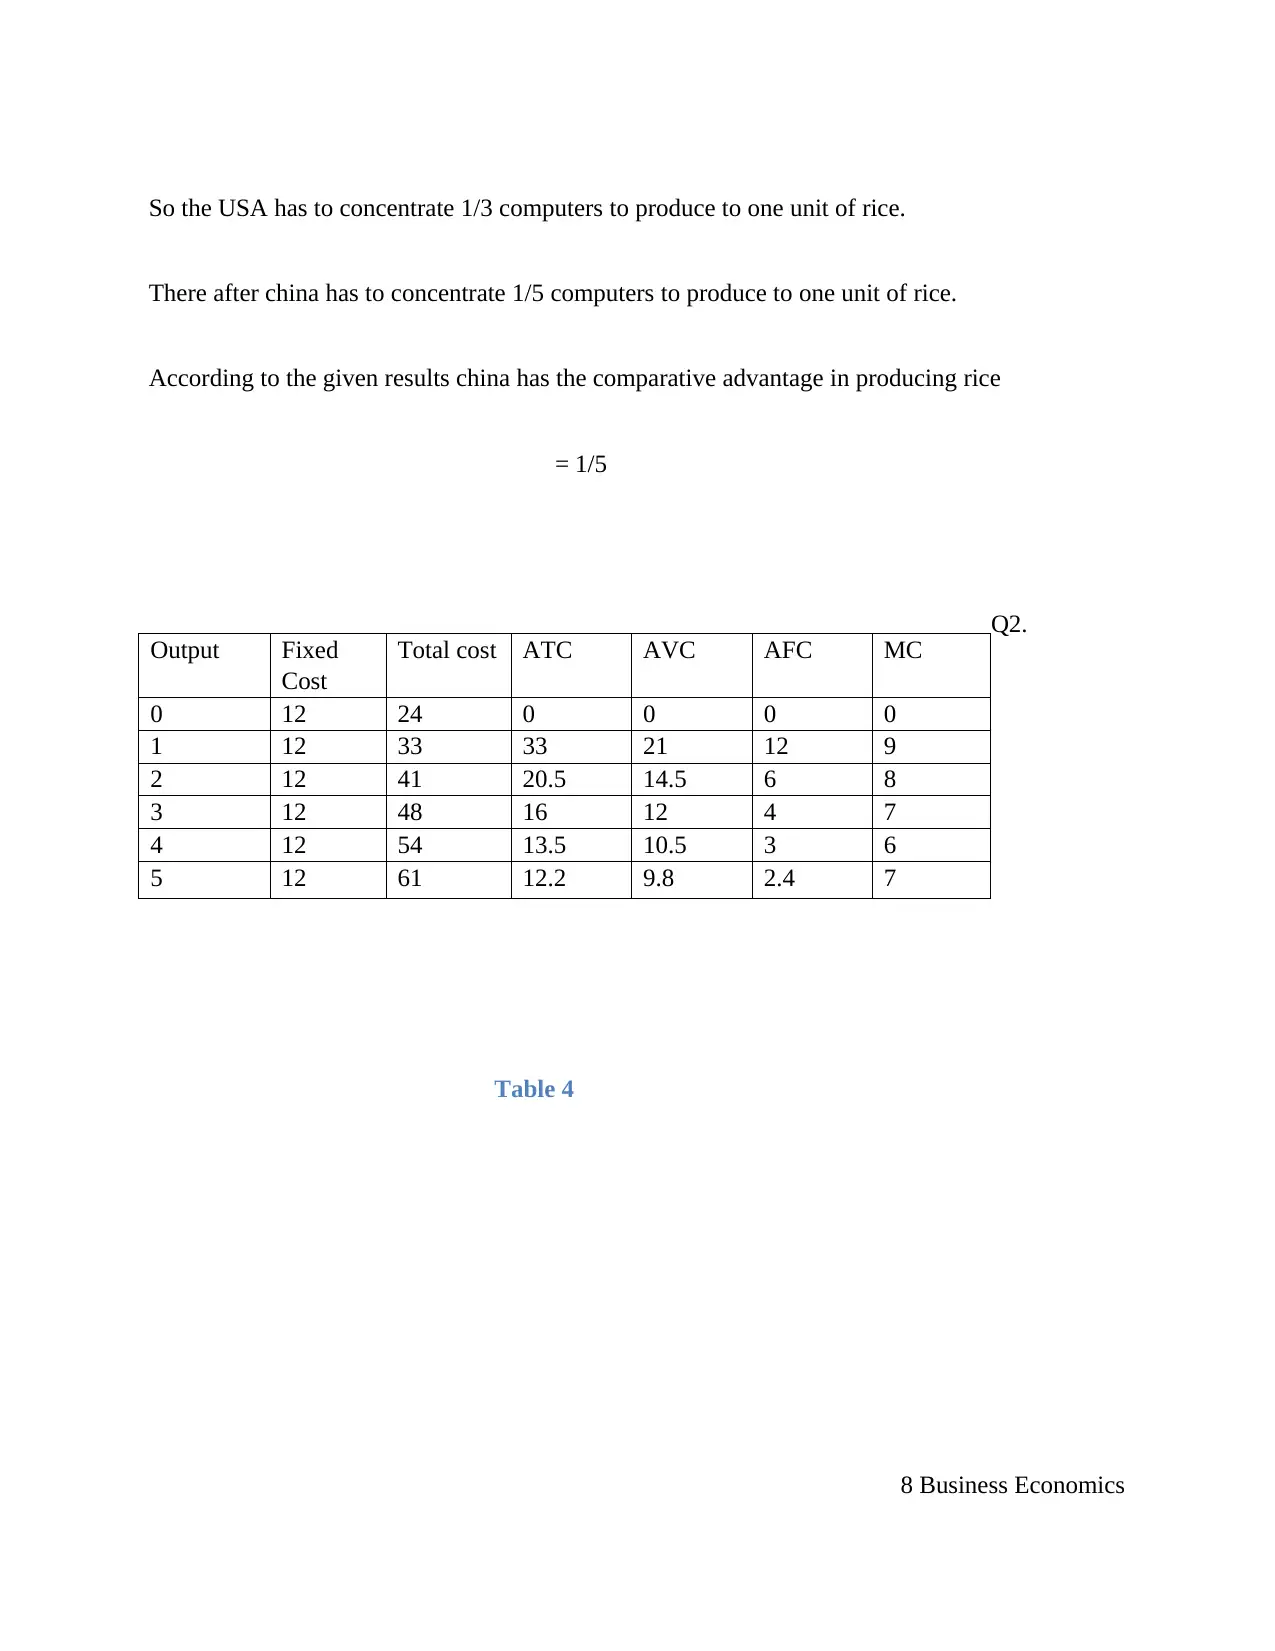
So the USA has to concentrate 1/3 computers to produce to one unit of rice.
There after china has to concentrate 1/5 computers to produce to one unit of rice.
According to the given results china has the comparative advantage in producing rice
= 1/5
Q2.
Table 4
8 Business Economics
Output Fixed
Cost
Total cost ATC AVC AFC MC
0 12 24 0 0 0 0
1 12 33 33 21 12 9
2 12 41 20.5 14.5 6 8
3 12 48 16 12 4 7
4 12 54 13.5 10.5 3 6
5 12 61 12.2 9.8 2.4 7
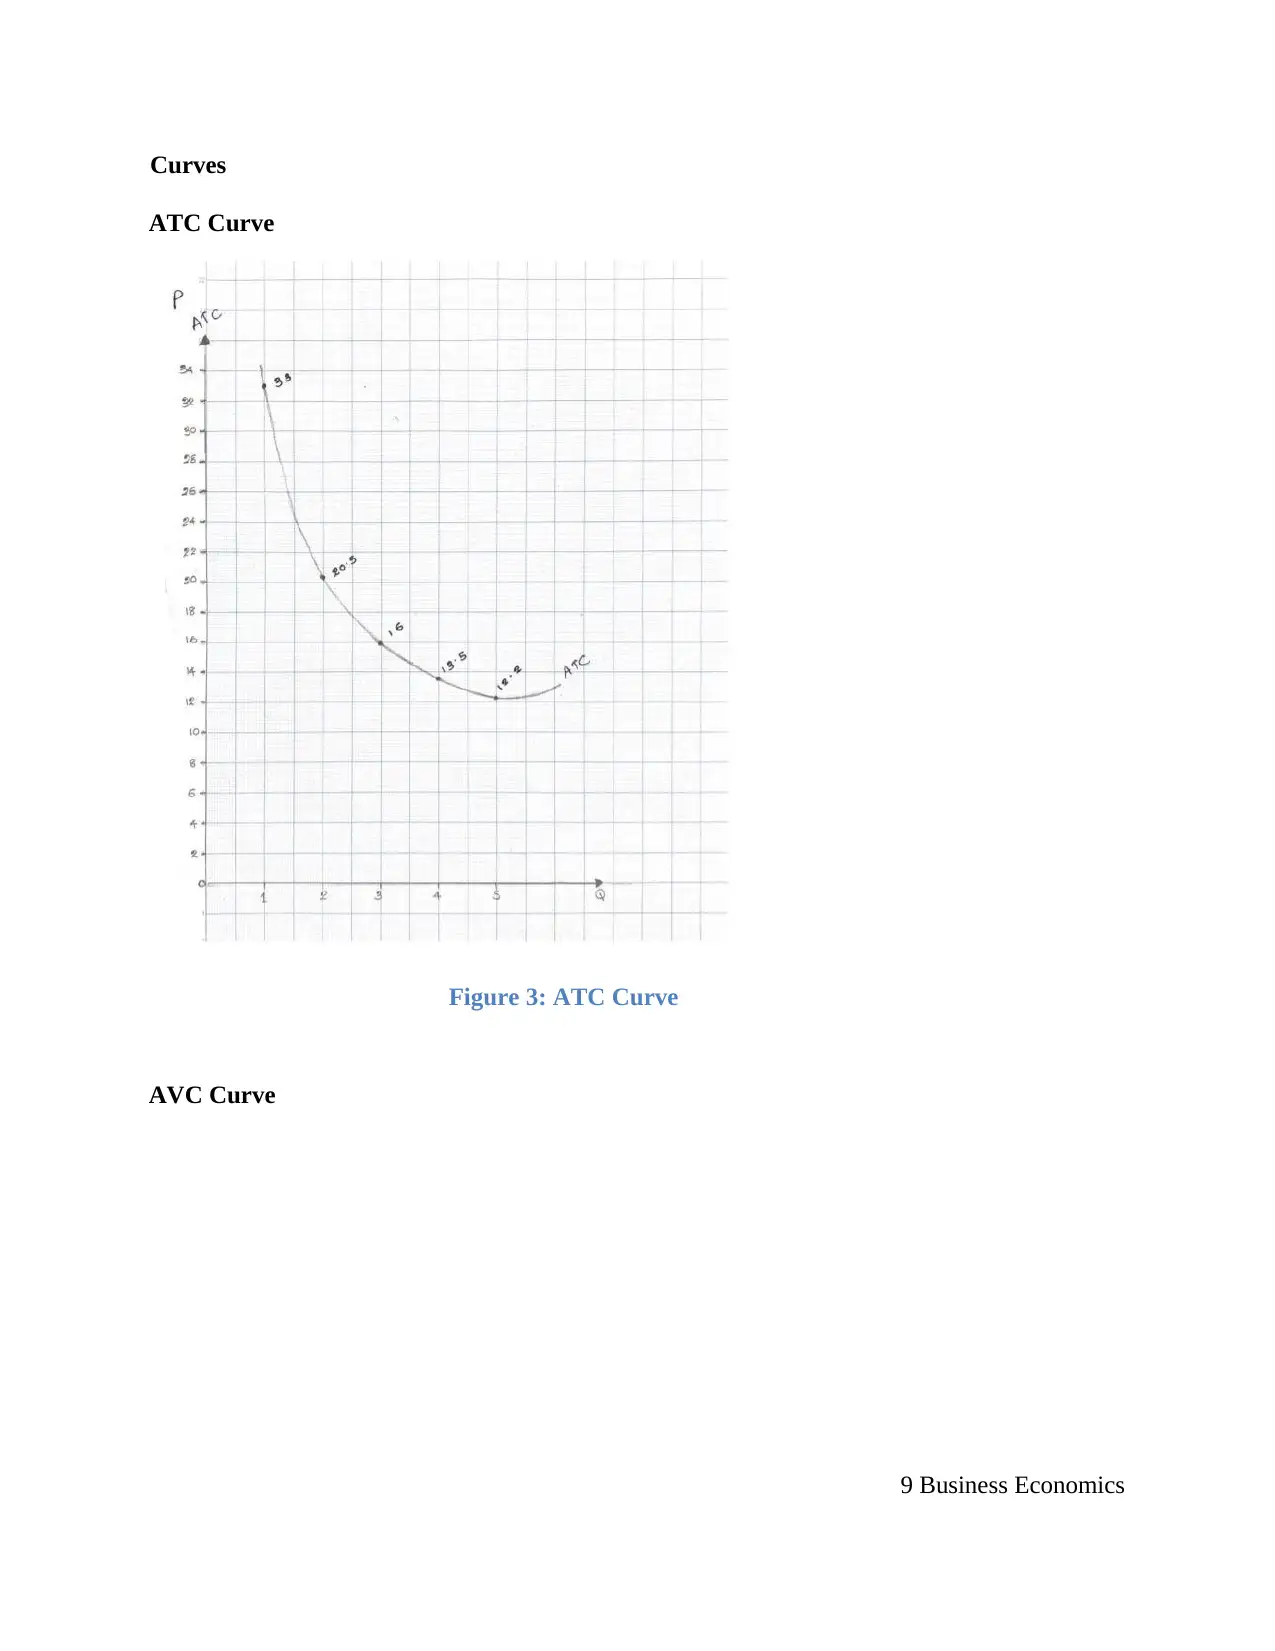
Curves
ATC Curve
Figure 3: ATC Curve
AVC Curve
9 Business Economics
ATC Curve
Figure 3: ATC Curve
AVC Curve
9 Business Economics
⊘ This is a preview!⊘
Do you want full access?
Subscribe today to unlock all pages.
Trusted by 1+ million students worldwide
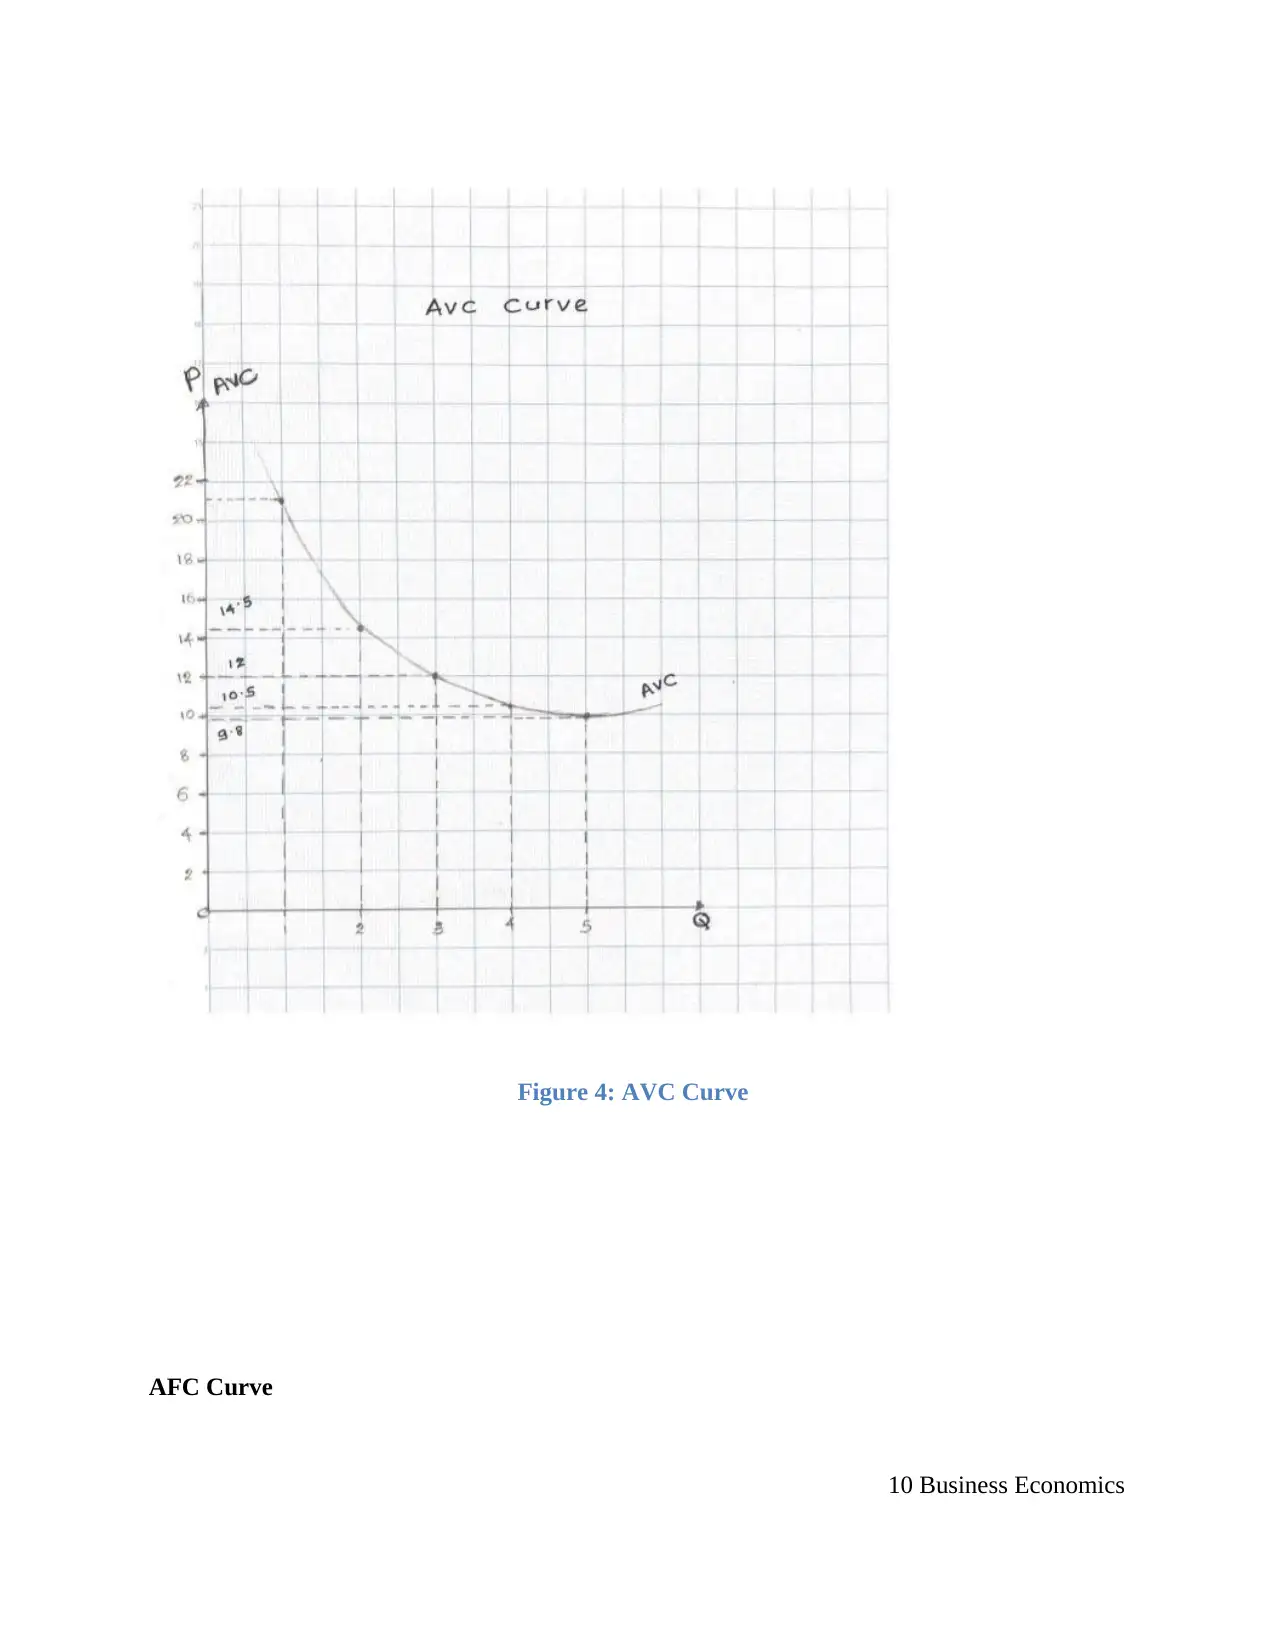
Figure 4: AVC Curve
AFC Curve
10 Business Economics
AFC Curve
10 Business Economics
Paraphrase This Document
Need a fresh take? Get an instant paraphrase of this document with our AI Paraphraser
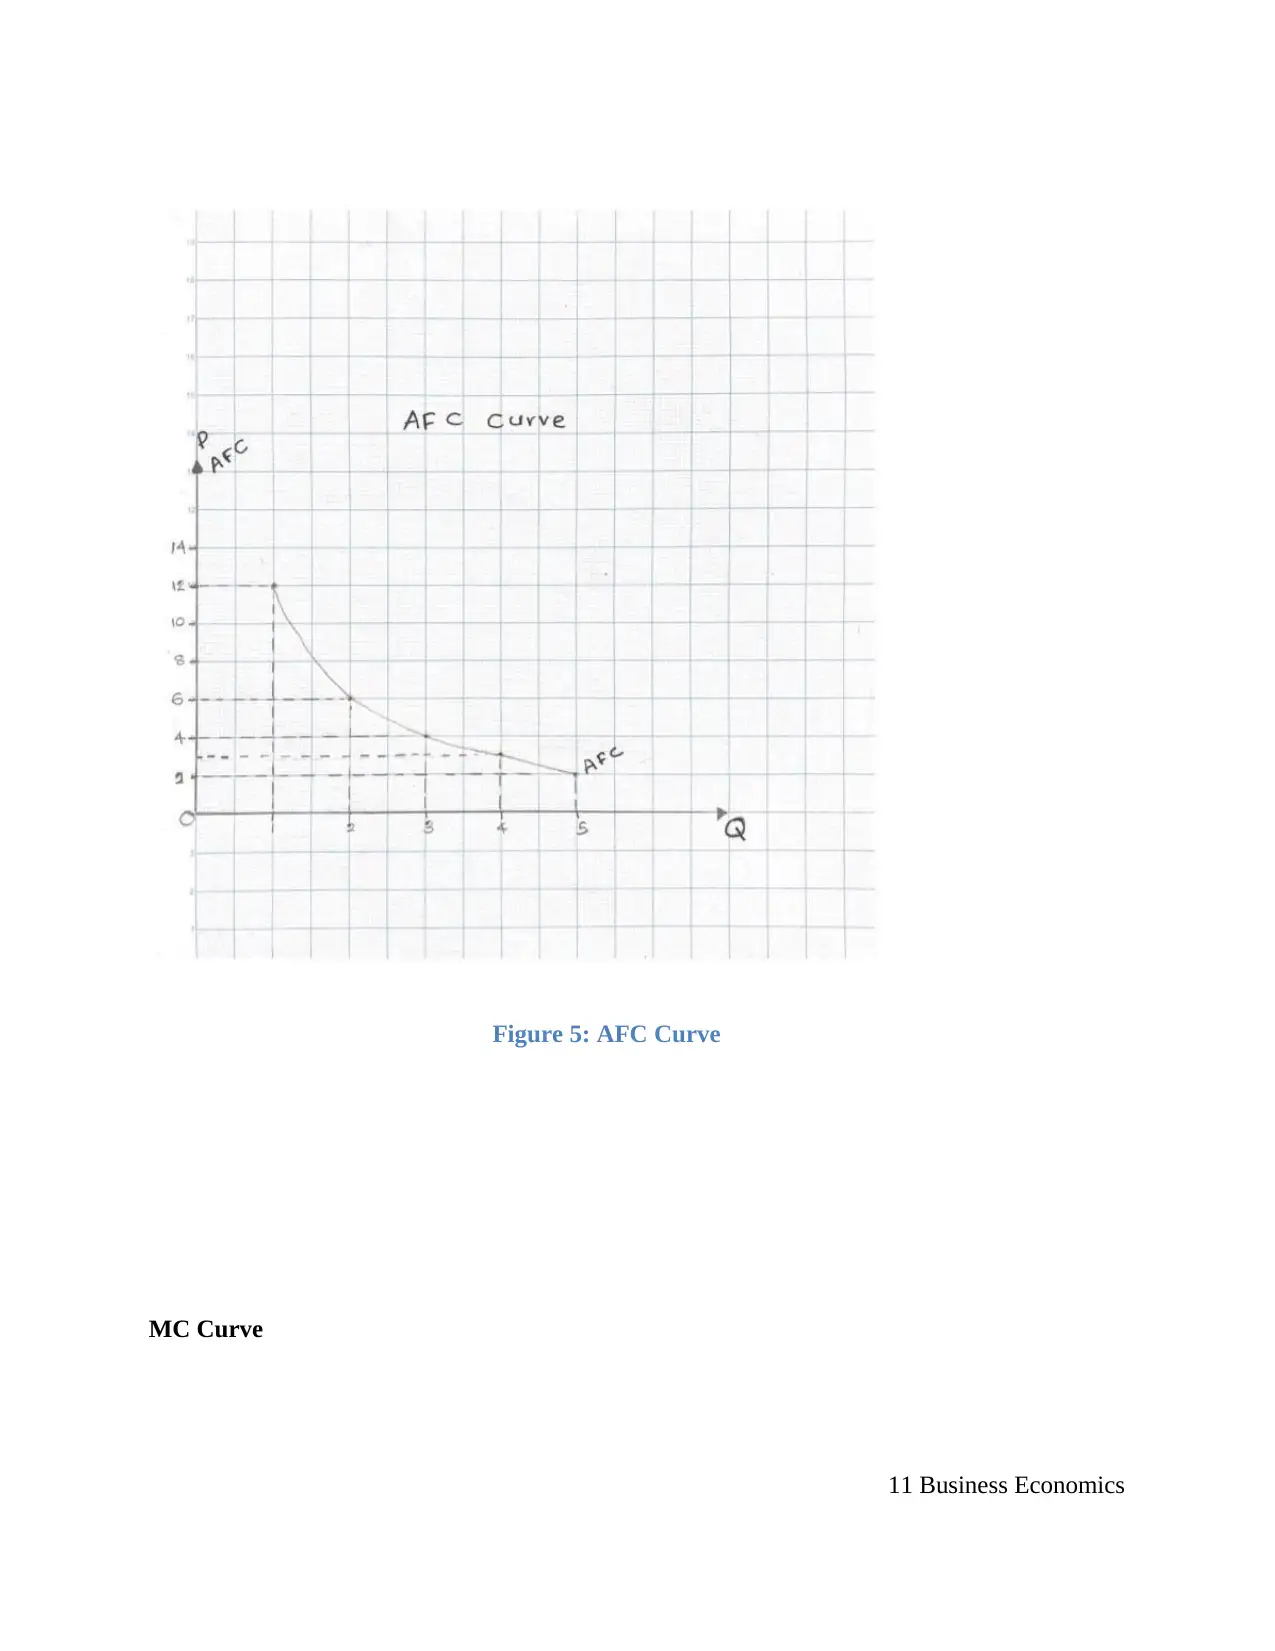
Figure 5: AFC Curve
MC Curve
11 Business Economics
MC Curve
11 Business Economics
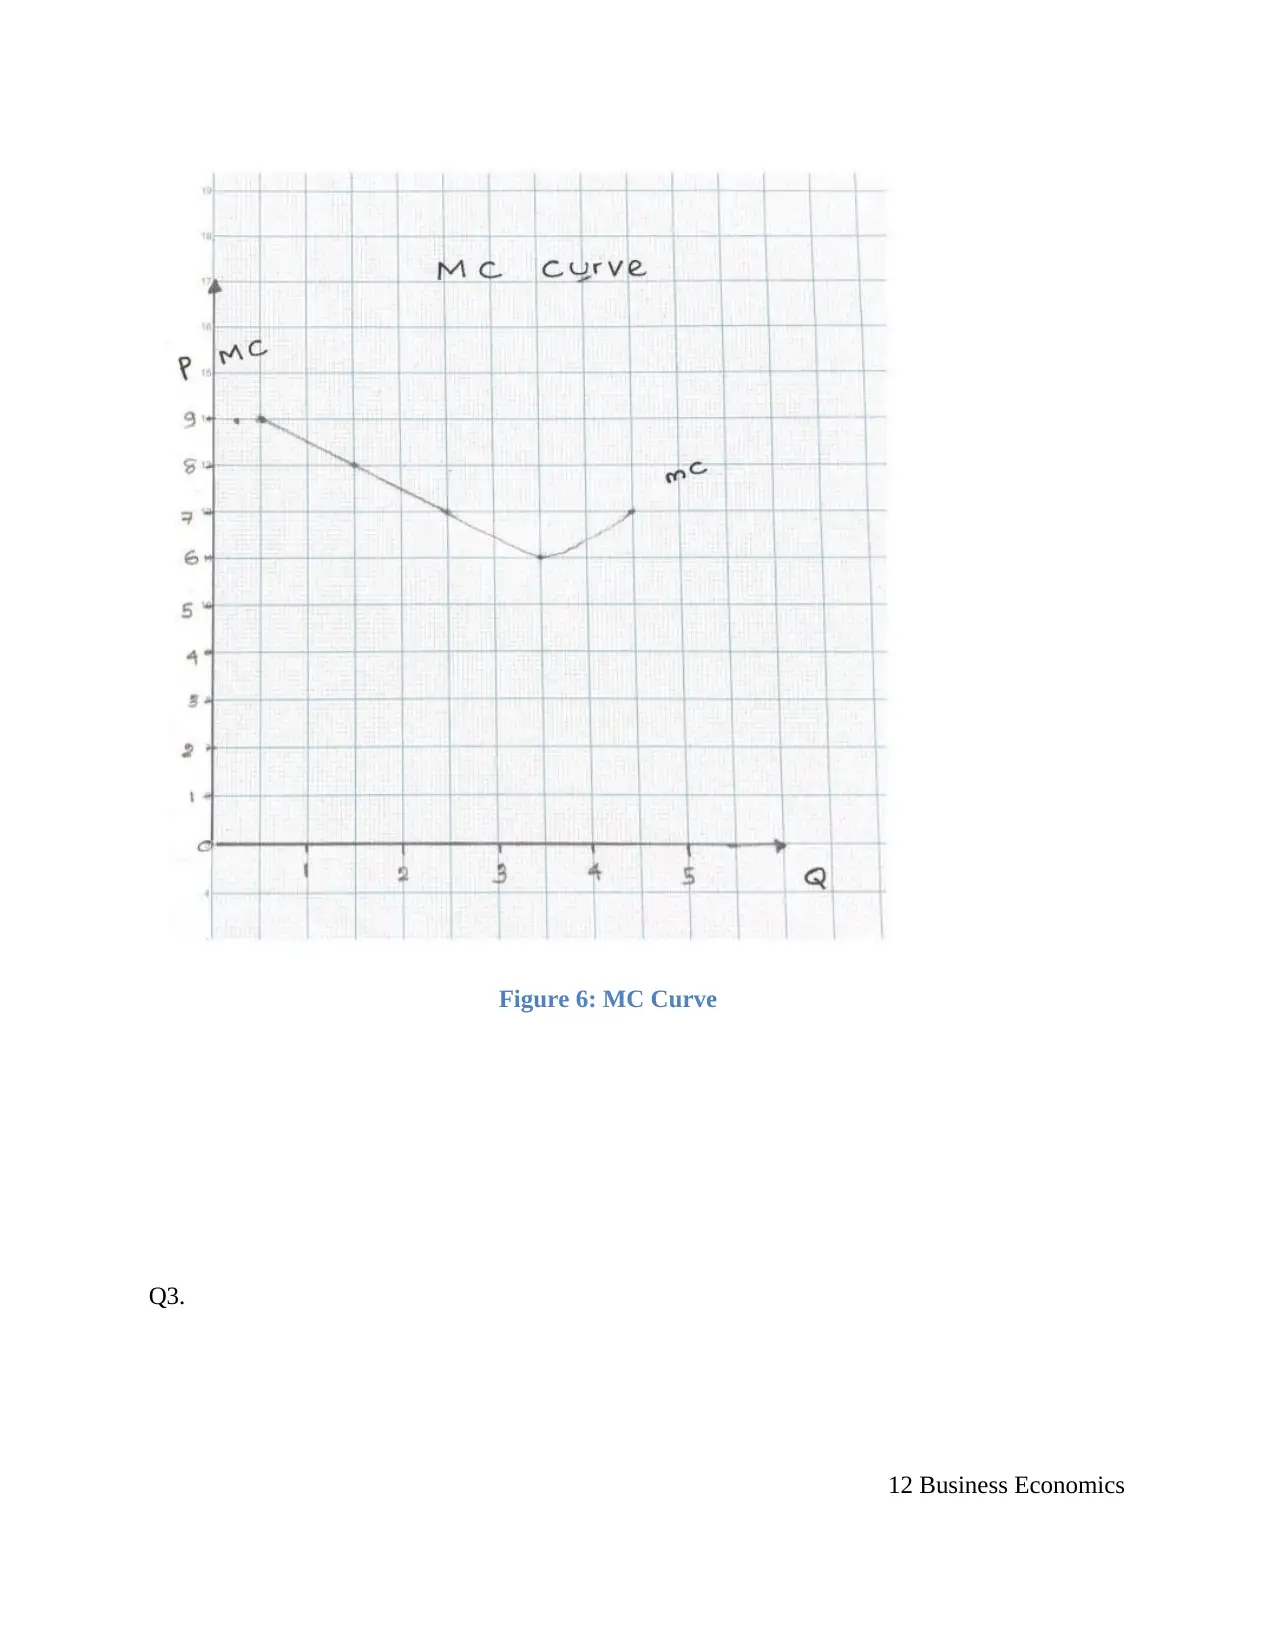
Figure 6: MC Curve
Q3.
12 Business Economics
Q3.
12 Business Economics
⊘ This is a preview!⊘
Do you want full access?
Subscribe today to unlock all pages.
Trusted by 1+ million students worldwide
1 out of 27

Your All-in-One AI-Powered Toolkit for Academic Success.
+13062052269
info@desklib.com
Available 24*7 on WhatsApp / Email
![[object Object]](/_next/static/media/star-bottom.7253800d.svg)
Unlock your academic potential
Copyright © 2020–2026 A2Z Services. All Rights Reserved. Developed and managed by ZUCOL.