Economics Report: Analysis of Micro and Macroeconomic Concepts
VerifiedAdded on 2020/05/16
|13
|2195
|254
Report
AI Summary
This comprehensive economics report is divided into two parts: Microeconomics and Macroeconomics. The microeconomics section explores economies of scale, particularly in the context of oligopoly markets, using the Australian airline industry as a case study. It examines how factors like high capital costs and price competition influence market dynamics, illustrating these concepts with diagrams. The macroeconomics section analyzes the current state of the economy, focusing on the business cycle, the AD-AS model, and the factors influencing economic growth. It examines aggregate demand and supply, discussing how government spending and investment in human capital and infrastructure can stimulate economic expansion, using the French economy as an example. The report incorporates figures and diagrams to illustrate key concepts and concludes with a bibliography of cited sources.

qwertyuiopasdfghjklzxcvbnmqwertyui
opasdfghjklzxcvbnmqwertyuiopasdfgh
jklzxcvbnmqwertyuiopasdfghjklzxcvb
nmqwertyuiopasdfghjklzxcvbnmqwer
tyuiopasdfghjklzxcvbnmqwertyuiopas
dfghjklzxcvbnmqwertyuiopasdfghjklzx
cvbnmqwertyuiopasdfghjklzxcvbnmq
wertyuiopasdfghjklzxcvbnmqwertyuio
pasdfghjklzxcvbnmqwertyuiopasdfghj
klzxcvbnmqwertyuiopasdfghjklzxcvbn
mqwertyuiopasdfghjklzxcvbnmqwerty
uiopasdfghjklzxcvbnmqwertyuiopasdf
ghjklzxcvbnmqwertyuiopasdfghjklzxc
vbnmqwertyuiopasdfghjklzxcvbnmrty
uiopasdfghjklzxcvbnmqwertyuiopasdf
ghjklzxcvbnmqwertyuiopasdfghjklzxc
Economics
[Type the document subtitle]
[Pick the date]
Com
Paraphrase This Document
Need a fresh take? Get an instant paraphrase of this document with our AI Paraphraser
Contents
Part A: Micro Economics............................................................................................................................2
Part B Macro Economics.............................................................................................................................5
Figure 1 Economies of Scale and Long Run Total Cost Curve....................................................................3
Figure 2 Determination of Revenue in Oligopoly........................................................................................5
Figure 3 Business Cycle: Informal Representation......................................................................................6
Figure 4 Short Run and Long Run Aggregate Supply Curves.....................................................................7
Figure 5 Components of Aggregate Demand...............................................................................................8
Figure 6 Aggregate demand and supply......................................................................................................9
Part A: Micro Economics
1) Economies of Scale refers to the advantages accrued by firms as the firms increase the
level of production.(Chauhan, 2009) For example, in the beginning, the per capita cost
for every seat of every airline is high. However, as the number of seats sold increases, the
cost per unit or the marginal costs decreases. This is simply due to the fact that the fixed
costs of running an air line are high. As the number of seats sold increases, the per fixed
costs get divided among a greater number of seats. The variable costs also, vary
according to the number of seats.
Economies of scale are also achieved due to the costs advantages gained from bulk buying.
As a greater number of units are sold, the firm is in position to take advantage of the bulk buying
costs. As a result, the costs of production can be minimized further. For example, the airline can
buy more number of planes and seek discounts. The flight can order more supplies and seek
discounted rates. (Chauhan, 2009)
Economies of scale , in some cases, are also achieved due to specialization. As there is a
greater degree of specialization, production become more efficient and losses are minimized.
There also, a greater utilization of the capital and labour capacity. For example, if an airline
employs a flight stewardess, the flight can employ here on three flights on three different routes
in one week instead of just one route twice in a week. This increases the efficiency of the
allocation of resources.(Chauhan, 2009)
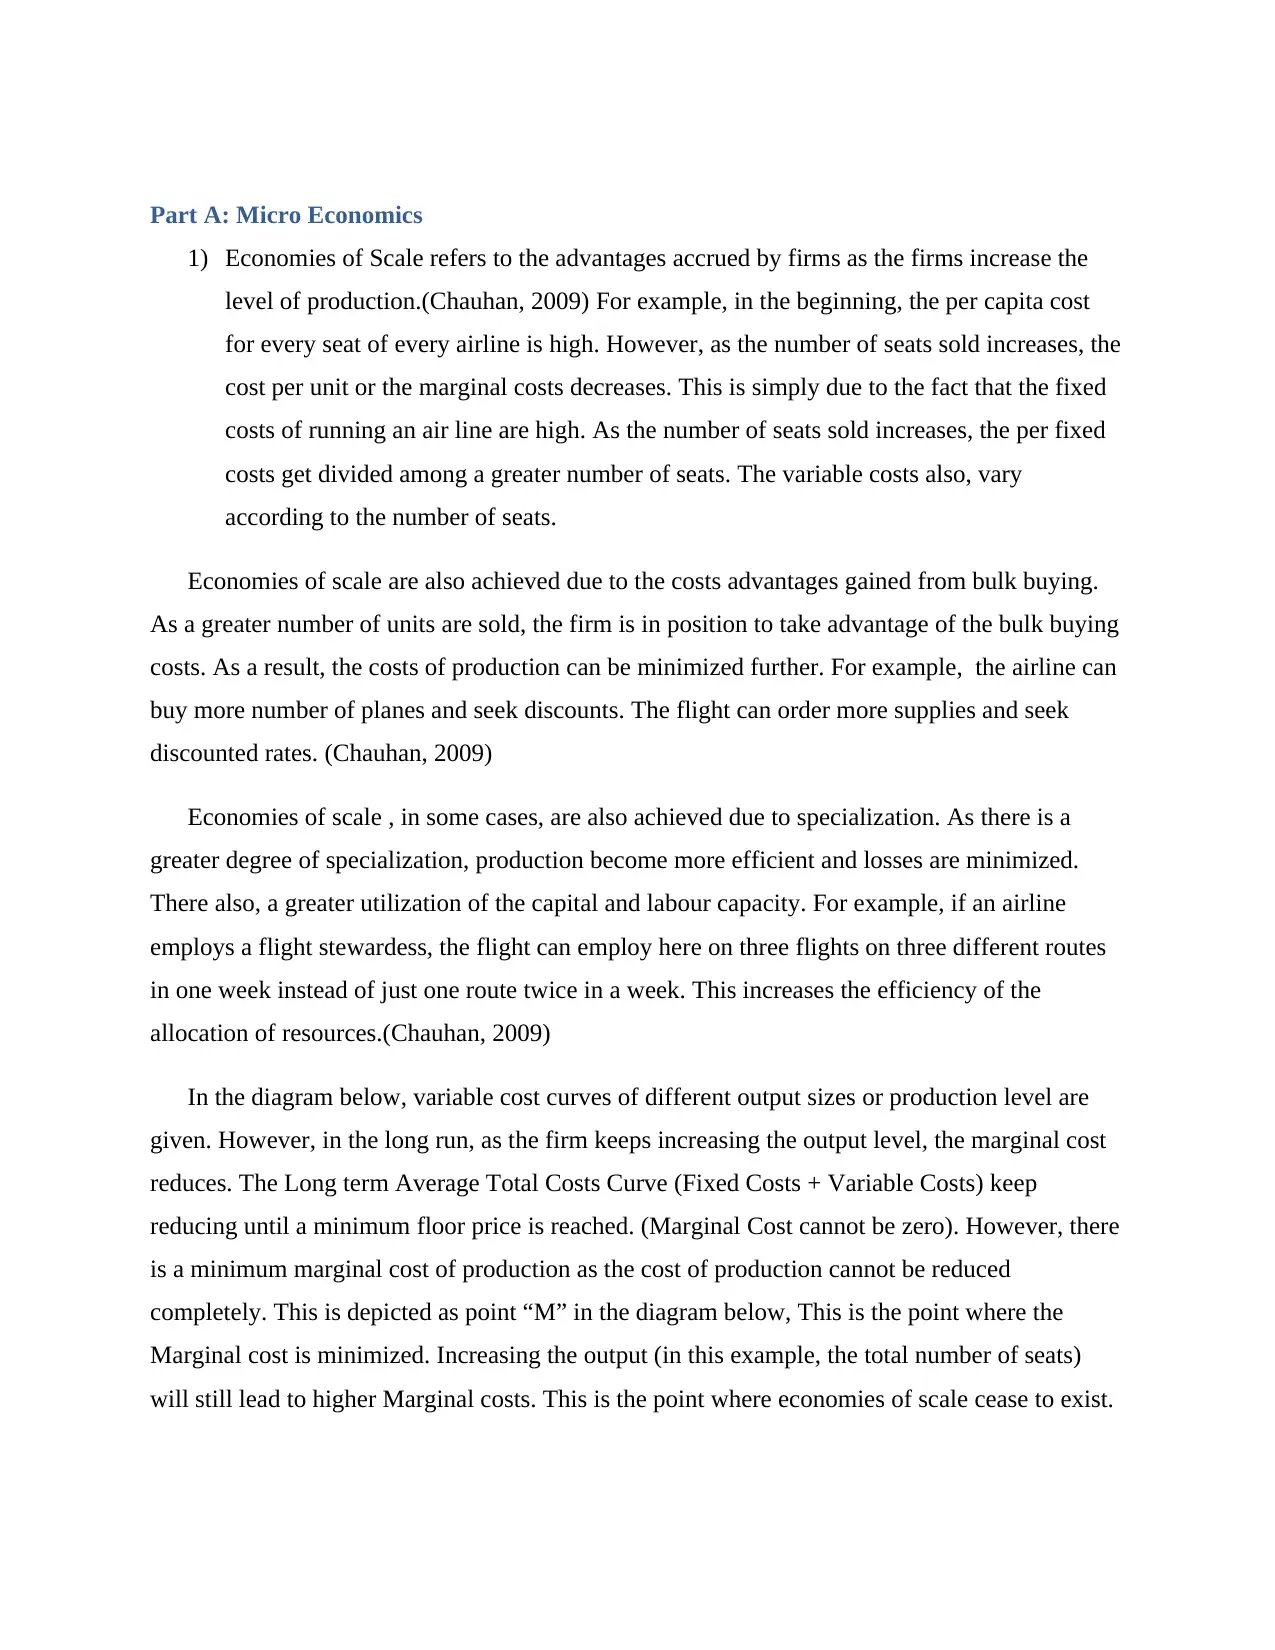
In the diagram below, variable cost curves of different output sizes or production level are
given. However, in the long run, as the firm keeps increasing the output level, the marginal cost
reduces. The Long term Average Total Costs Curve (Fixed Costs + Variable Costs) keep
reducing until a minimum floor price is reached. (Marginal Cost cannot be zero). However, there
is a minimum marginal cost of production as the cost of production cannot be reduced
completely. This is depicted as point “M” in the diagram below, This is the point where the
Marginal cost is minimized. Increasing the output (in this example, the total number of seats)
will still lead to higher Marginal costs. This is the point where economies of scale cease to exist.
1) Economies of Scale refers to the advantages accrued by firms as the firms increase the
level of production.(Chauhan, 2009) For example, in the beginning, the per capita cost
for every seat of every airline is high. However, as the number of seats sold increases, the
cost per unit or the marginal costs decreases. This is simply due to the fact that the fixed
costs of running an air line are high. As the number of seats sold increases, the per fixed
costs get divided among a greater number of seats. The variable costs also, vary
according to the number of seats.
Economies of scale are also achieved due to the costs advantages gained from bulk buying.
As a greater number of units are sold, the firm is in position to take advantage of the bulk buying
costs. As a result, the costs of production can be minimized further. For example, the airline can
buy more number of planes and seek discounts. The flight can order more supplies and seek
discounted rates. (Chauhan, 2009)
Economies of scale , in some cases, are also achieved due to specialization. As there is a
greater degree of specialization, production become more efficient and losses are minimized.
There also, a greater utilization of the capital and labour capacity. For example, if an airline
employs a flight stewardess, the flight can employ here on three flights on three different routes
in one week instead of just one route twice in a week. This increases the efficiency of the
allocation of resources.(Chauhan, 2009)
In the diagram below, variable cost curves of different output sizes or production level are
given. However, in the long run, as the firm keeps increasing the output level, the marginal cost
reduces. The Long term Average Total Costs Curve (Fixed Costs + Variable Costs) keep
reducing until a minimum floor price is reached. (Marginal Cost cannot be zero). However, there
is a minimum marginal cost of production as the cost of production cannot be reduced
completely. This is depicted as point “M” in the diagram below, This is the point where the
Marginal cost is minimized. Increasing the output (in this example, the total number of seats)
will still lead to higher Marginal costs. This is the point where economies of scale cease to exist.
⊘ This is a preview!⊘
Do you want full access?
Subscribe today to unlock all pages.
Trusted by 1+ million students worldwide
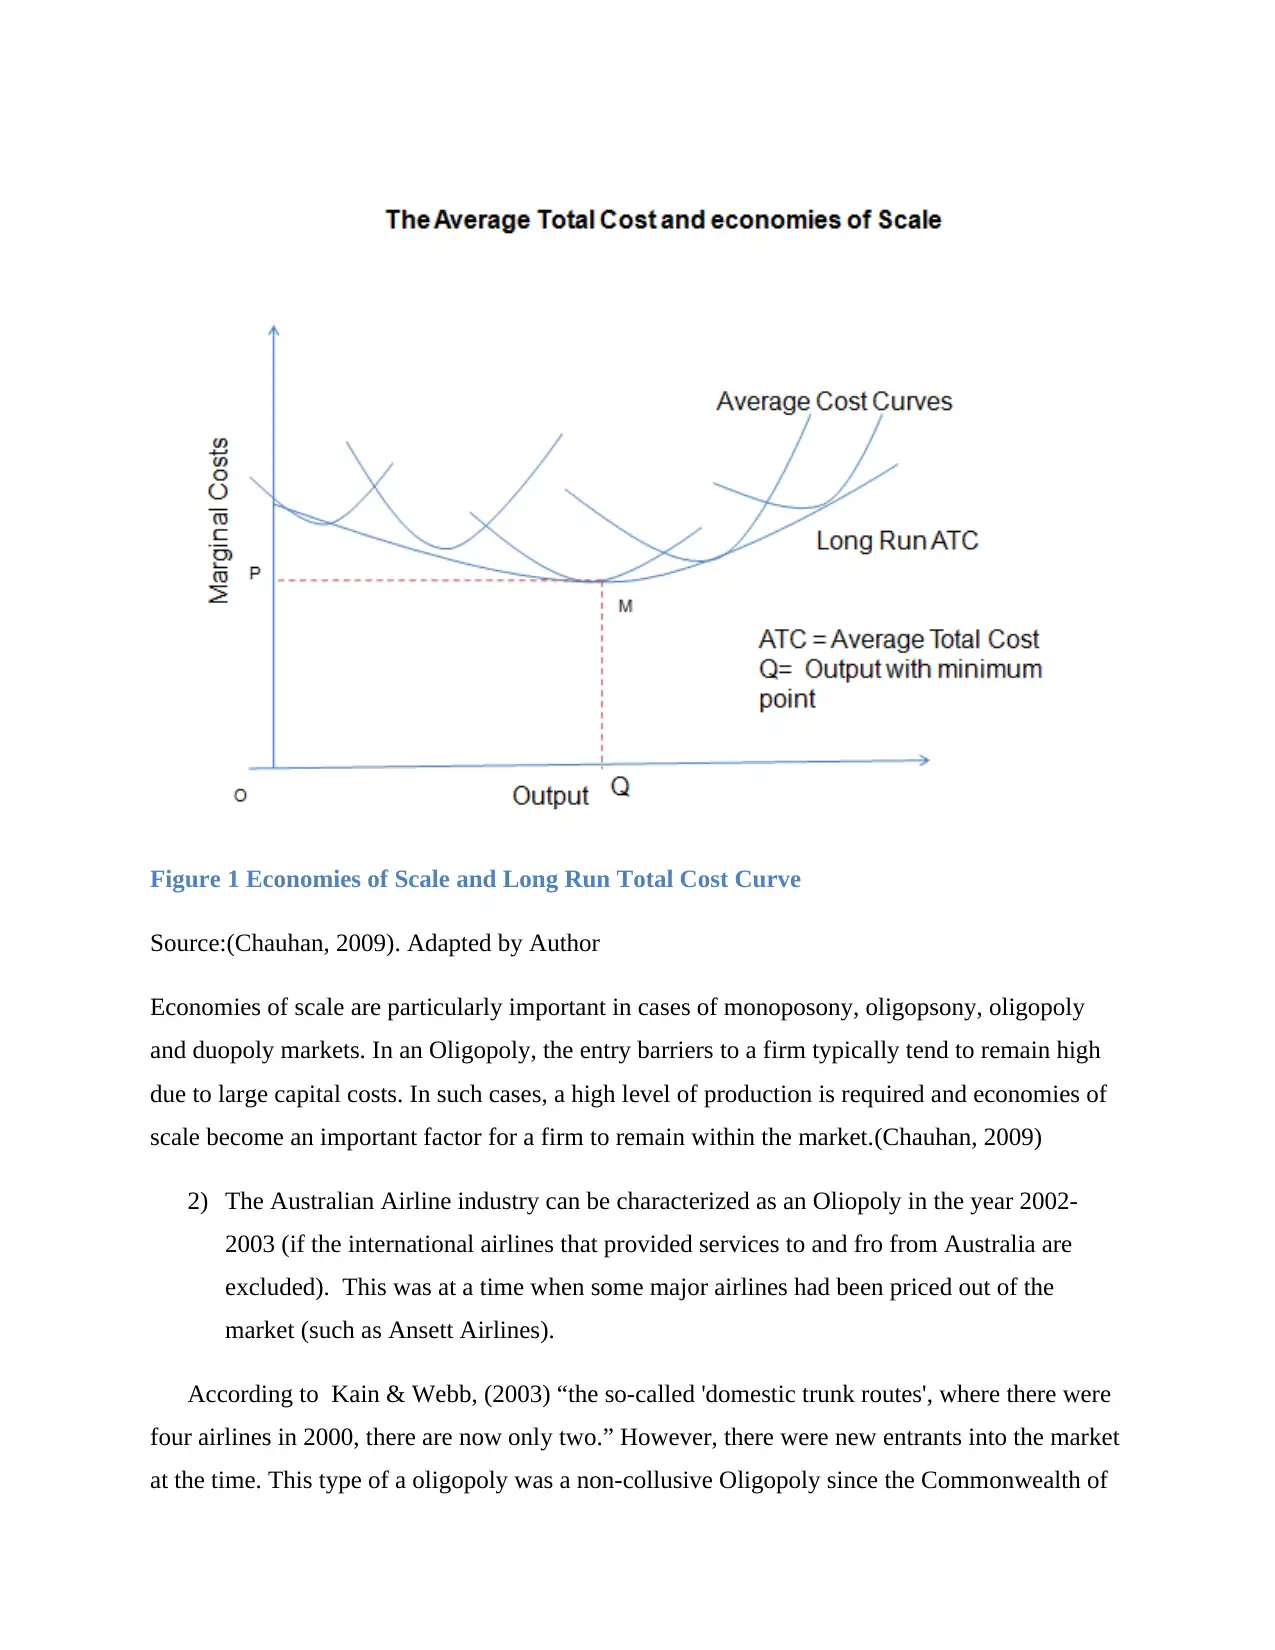
Figure 1 Economies of Scale and Long Run Total Cost Curve
Source:(Chauhan, 2009). Adapted by Author
Economies of scale are particularly important in cases of monoposony, oligopsony, oligopoly
and duopoly markets. In an Oligopoly, the entry barriers to a firm typically tend to remain high
due to large capital costs. In such cases, a high level of production is required and economies of
scale become an important factor for a firm to remain within the market.(Chauhan, 2009)
2) The Australian Airline industry can be characterized as an Oliopoly in the year 2002-
2003 (if the international airlines that provided services to and fro from Australia are
excluded). This was at a time when some major airlines had been priced out of the
market (such as Ansett Airlines).
According to Kain & Webb, (2003) “the so-called 'domestic trunk routes', where there were
four airlines in 2000, there are now only two.” However, there were new entrants into the market
at the time. This type of a oligopoly was a non-collusive Oligopoly since the Commonwealth of
Paraphrase This Document
Need a fresh take? Get an instant paraphrase of this document with our AI Paraphraser
Australia placed restrictions on the output of the flights. Ansett was priced out of the market as it
was not competitive enough. When output is fixed (such as in this case), profits are determined
by price competition and technological innovation both.(Chauhan, 2009) The nature of the
demand would depend on whether the competitors match the price changes. The demand (DD)
and price (Marginal Revenue MR) are at D2 D2 and MR2 MR2. Generally, rivals will ignore a
price increase but follow a price cut. This is depicted in diagram below.
Figure 2 Determination of Revenue in Oligopoly
This causes the demand curve of the airlines to be kinked i.e D2 P D1 and a broken Marginal
Revenue curve (MR2 MR1 ). This explain the price inflexibility that characterizes Oligopolistic
markets like airlines.
Source:(Chauhan, 2009). Adapted by Author
Oligopolies have entry barriers in the form of high investment costs and therefore, must keep
MR high, in order to be competitive. If prices are inflexible, marginal costs are high and firms do
not innovate, then some airlines were priced out of the market, because they cannot achieve the
economies of scale that some other firms may have.
Part B Macro Economics
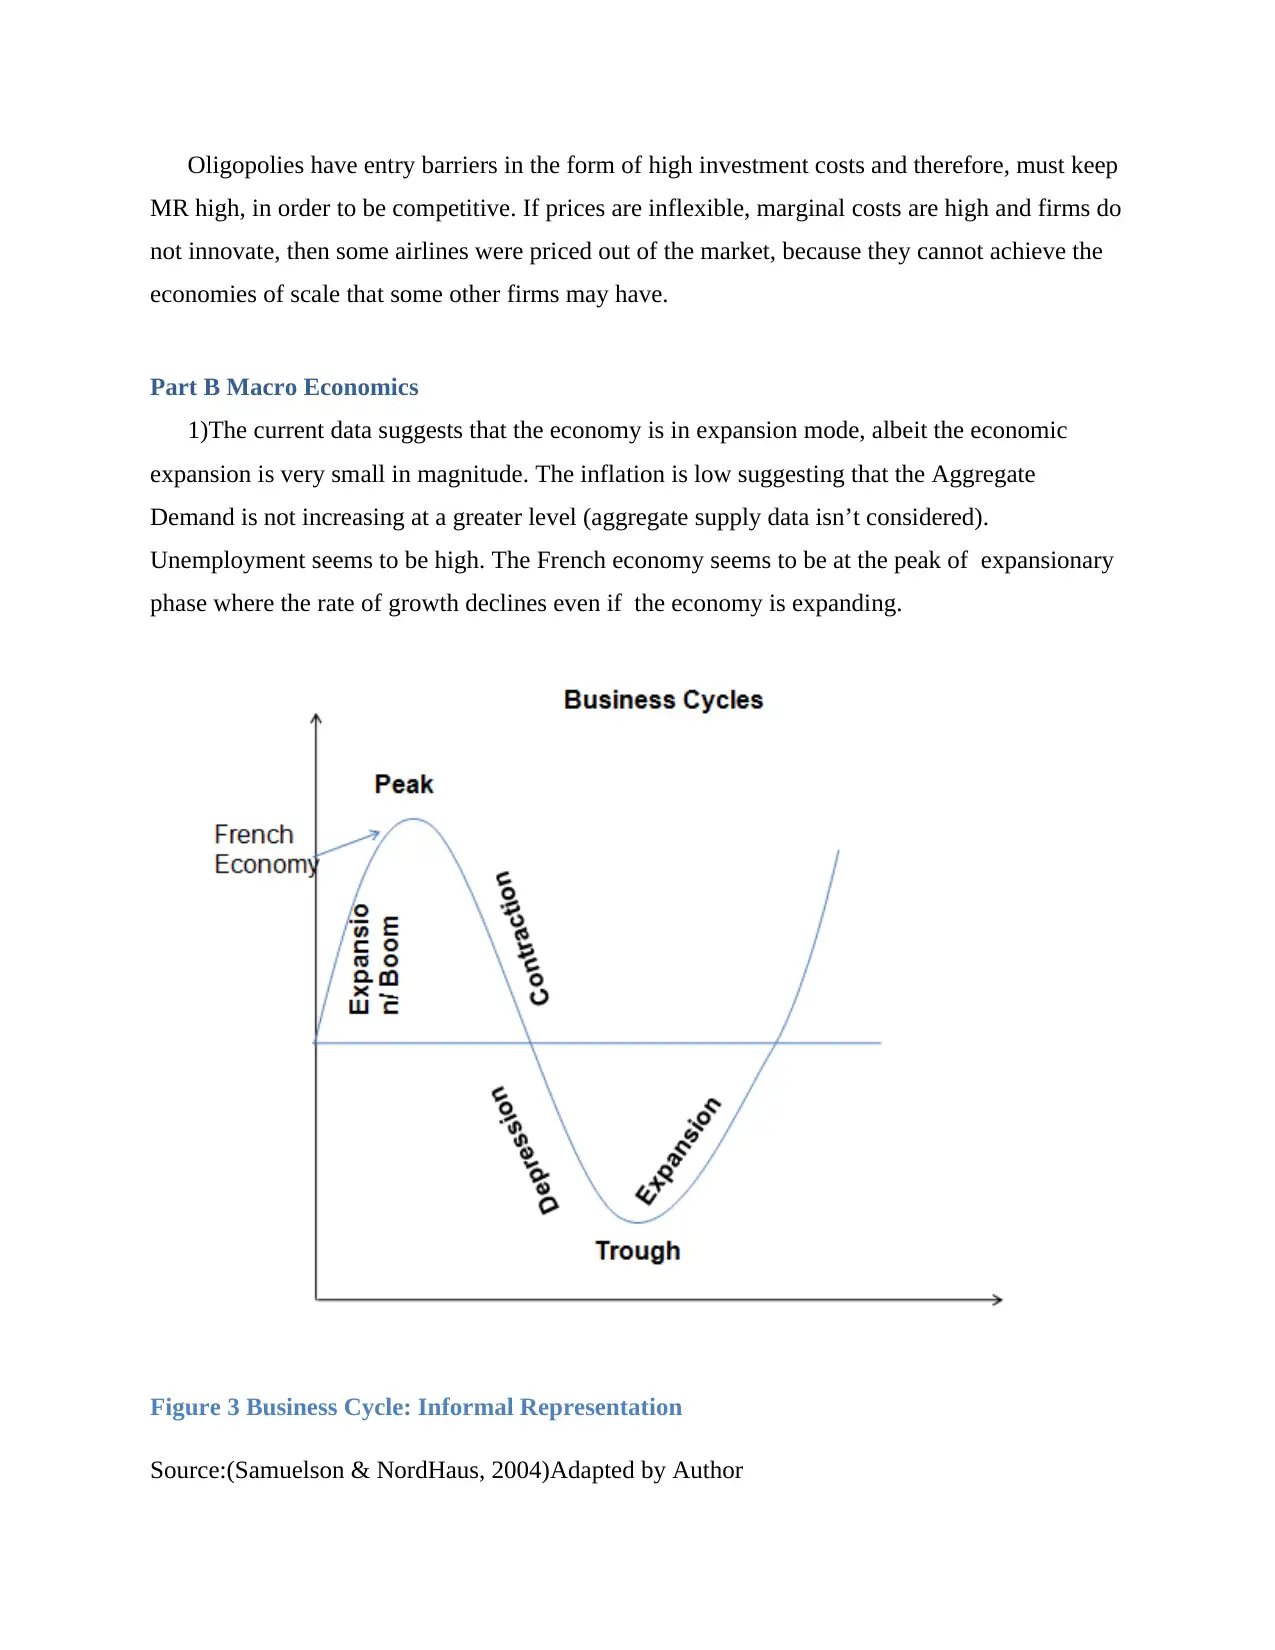
1)The current data suggests that the economy is in expansion mode, albeit the economic
expansion is very small in magnitude. The inflation is low suggesting that the Aggregate
Demand is not increasing at a greater level (aggregate supply data isn’t considered).
Unemployment seems to be high. The French economy seems to be at the peak of expansionary
phase where the rate of growth declines even if the economy is expanding.
Figure 3 Business Cycle: Informal Representation
Source:(Samuelson & NordHaus, 2004)Adapted by Author
MR high, in order to be competitive. If prices are inflexible, marginal costs are high and firms do
not innovate, then some airlines were priced out of the market, because they cannot achieve the
economies of scale that some other firms may have.
Part B Macro Economics
1)The current data suggests that the economy is in expansion mode, albeit the economic
expansion is very small in magnitude. The inflation is low suggesting that the Aggregate
Demand is not increasing at a greater level (aggregate supply data isn’t considered).
Unemployment seems to be high. The French economy seems to be at the peak of expansionary
phase where the rate of growth declines even if the economy is expanding.
Figure 3 Business Cycle: Informal Representation
Source:(Samuelson & NordHaus, 2004)Adapted by Author
⊘ This is a preview!⊘
Do you want full access?
Subscribe today to unlock all pages.
Trusted by 1+ million students worldwide
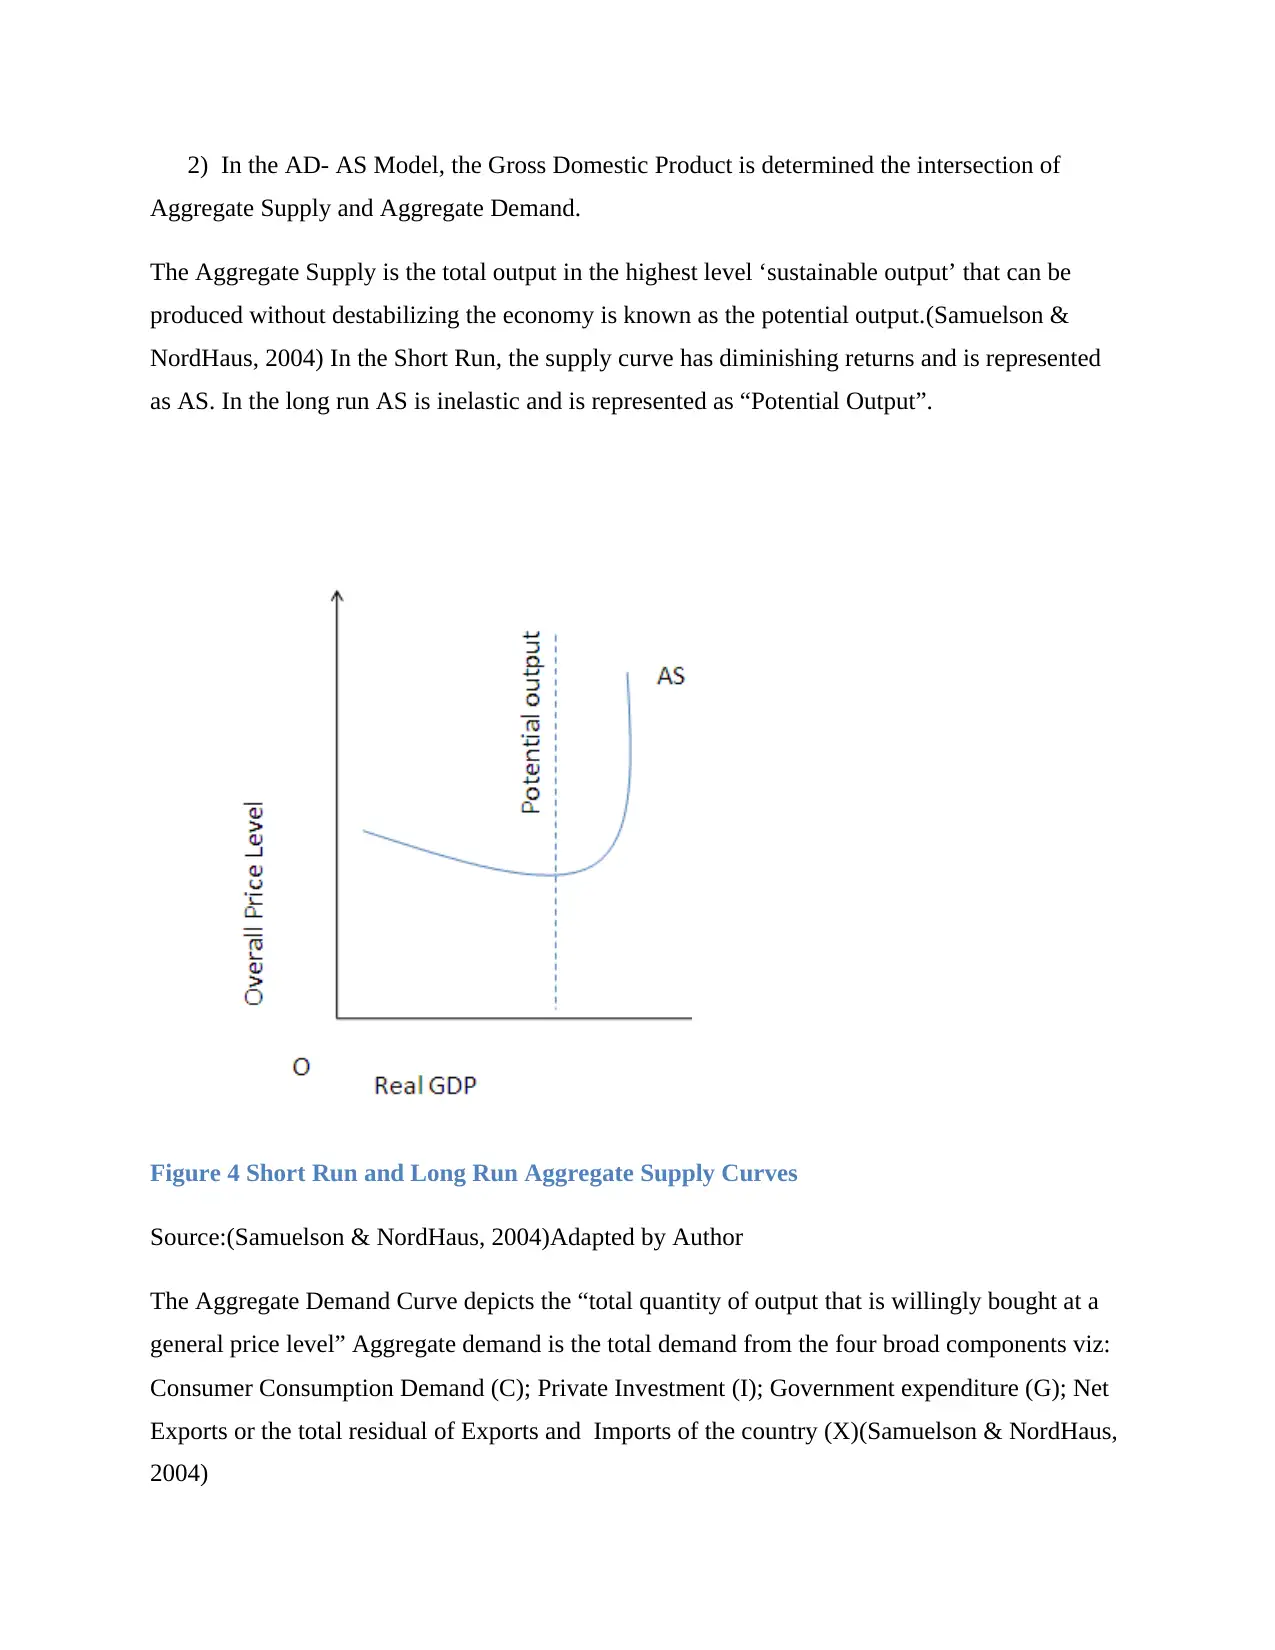
2) In the AD- AS Model, the Gross Domestic Product is determined the intersection of
Aggregate Supply and Aggregate Demand.
The Aggregate Supply is the total output in the highest level ‘sustainable output’ that can be
produced without destabilizing the economy is known as the potential output.(Samuelson &
NordHaus, 2004) In the Short Run, the supply curve has diminishing returns and is represented
as AS. In the long run AS is inelastic and is represented as “Potential Output”.
Figure 4 Short Run and Long Run Aggregate Supply Curves
Source:(Samuelson & NordHaus, 2004)Adapted by Author
The Aggregate Demand Curve depicts the “total quantity of output that is willingly bought at a
general price level” Aggregate demand is the total demand from the four broad components viz:
Consumer Consumption Demand (C); Private Investment (I); Government expenditure (G); Net
Exports or the total residual of Exports and Imports of the country (X)(Samuelson & NordHaus,
2004)
Paraphrase This Document
Need a fresh take? Get an instant paraphrase of this document with our AI Paraphraser
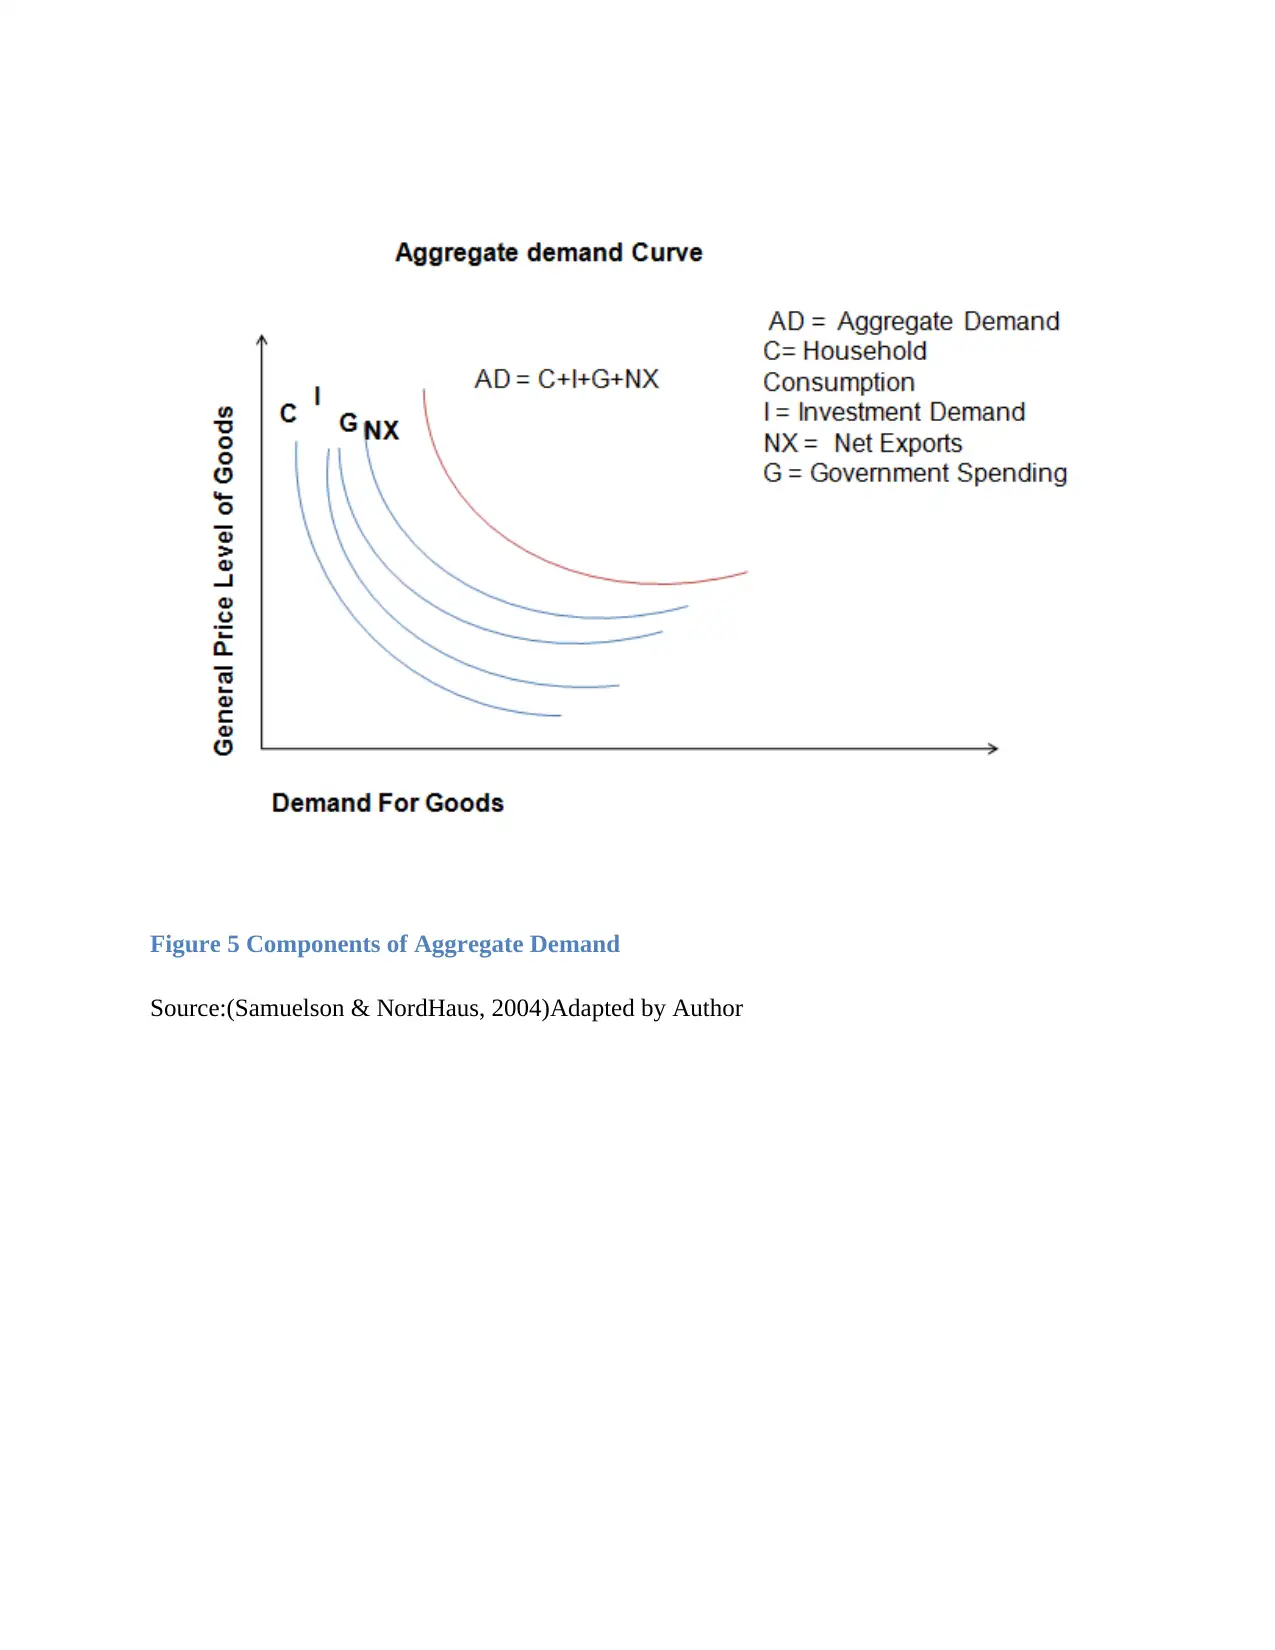
Figure 5 Components of Aggregate Demand
Source:(Samuelson & NordHaus, 2004)Adapted by Author
Source:(Samuelson & NordHaus, 2004)Adapted by Author
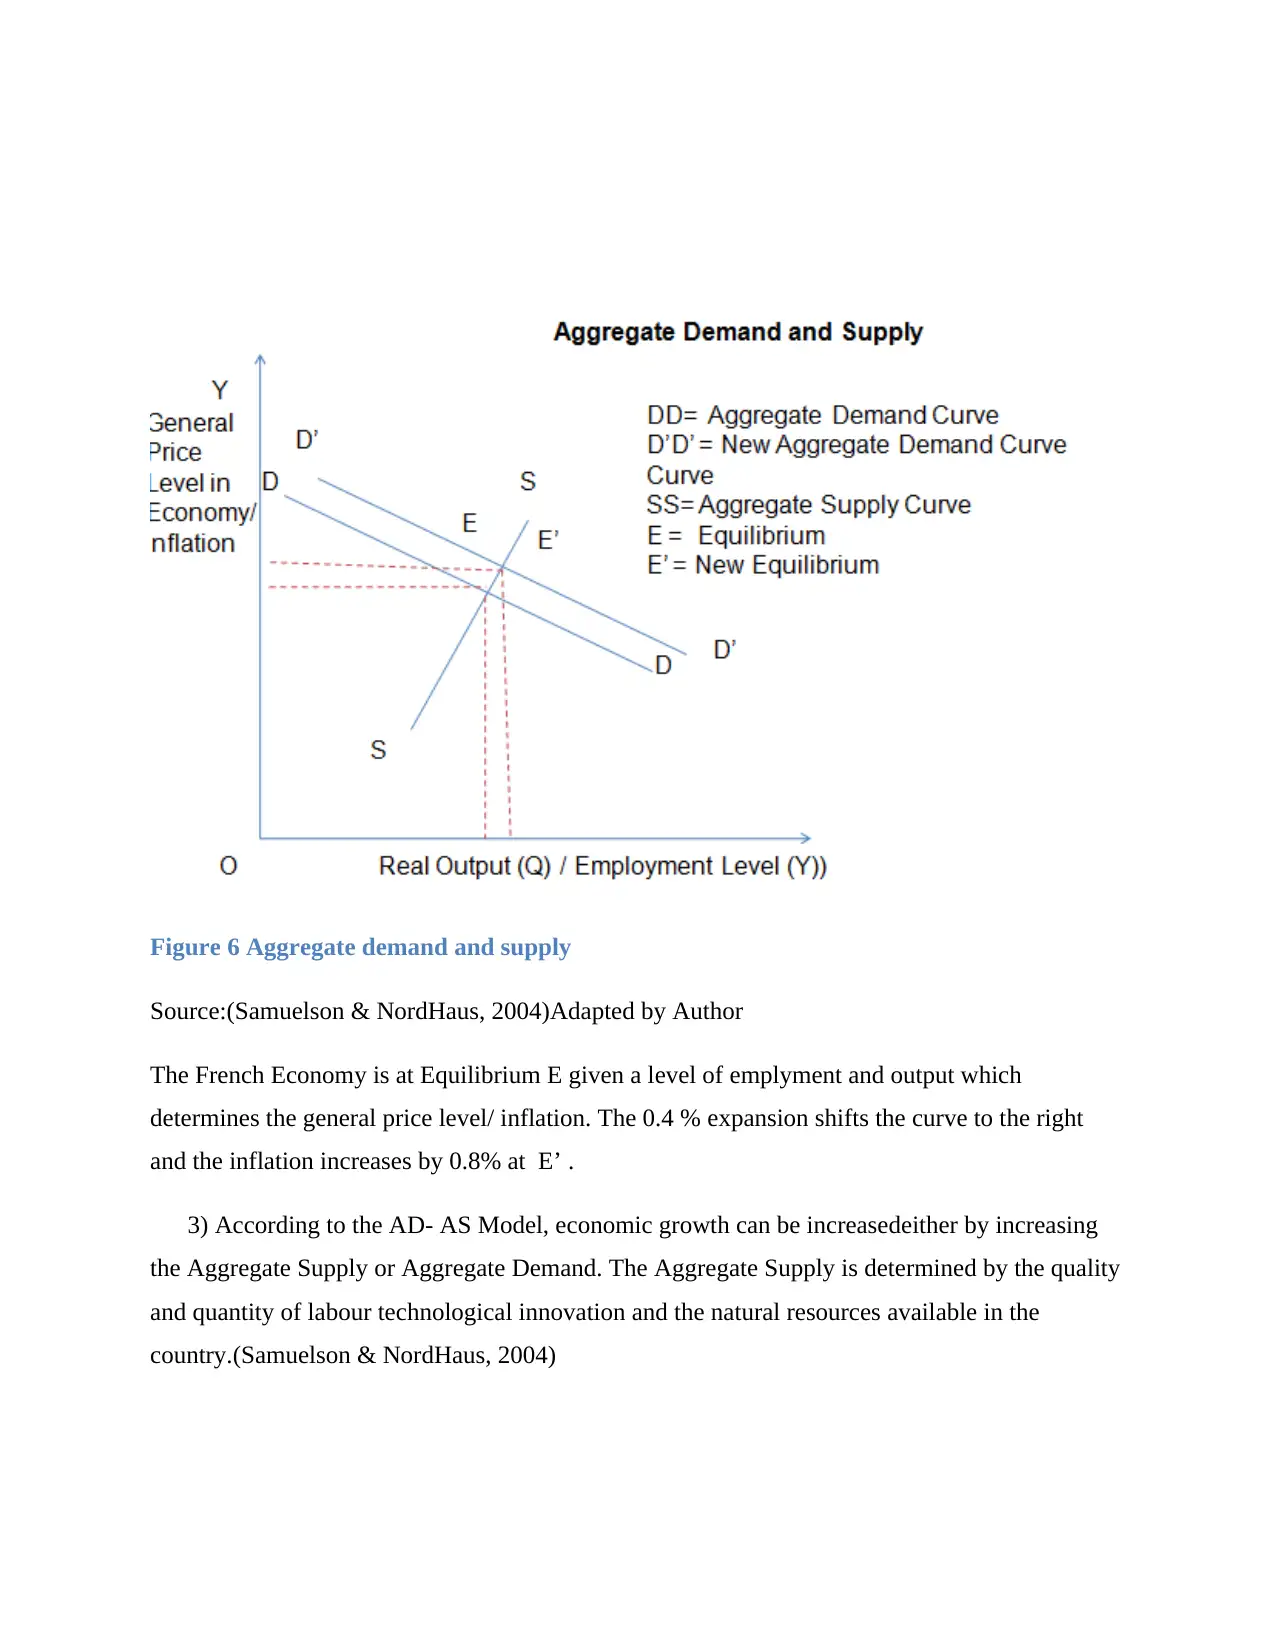
Figure 6 Aggregate demand and supply
Source:(Samuelson & NordHaus, 2004)Adapted by Author
The French Economy is at Equilibrium E given a level of emplyment and output which
determines the general price level/ inflation. The 0.4 % expansion shifts the curve to the right
and the inflation increases by 0.8% at E’ .
3) According to the AD- AS Model, economic growth can be increasedeither by increasing
the Aggregate Supply or Aggregate Demand. The Aggregate Supply is determined by the quality
and quantity of labour technological innovation and the natural resources available in the
country.(Samuelson & NordHaus, 2004)
⊘ This is a preview!⊘
Do you want full access?
Subscribe today to unlock all pages.
Trusted by 1+ million students worldwide
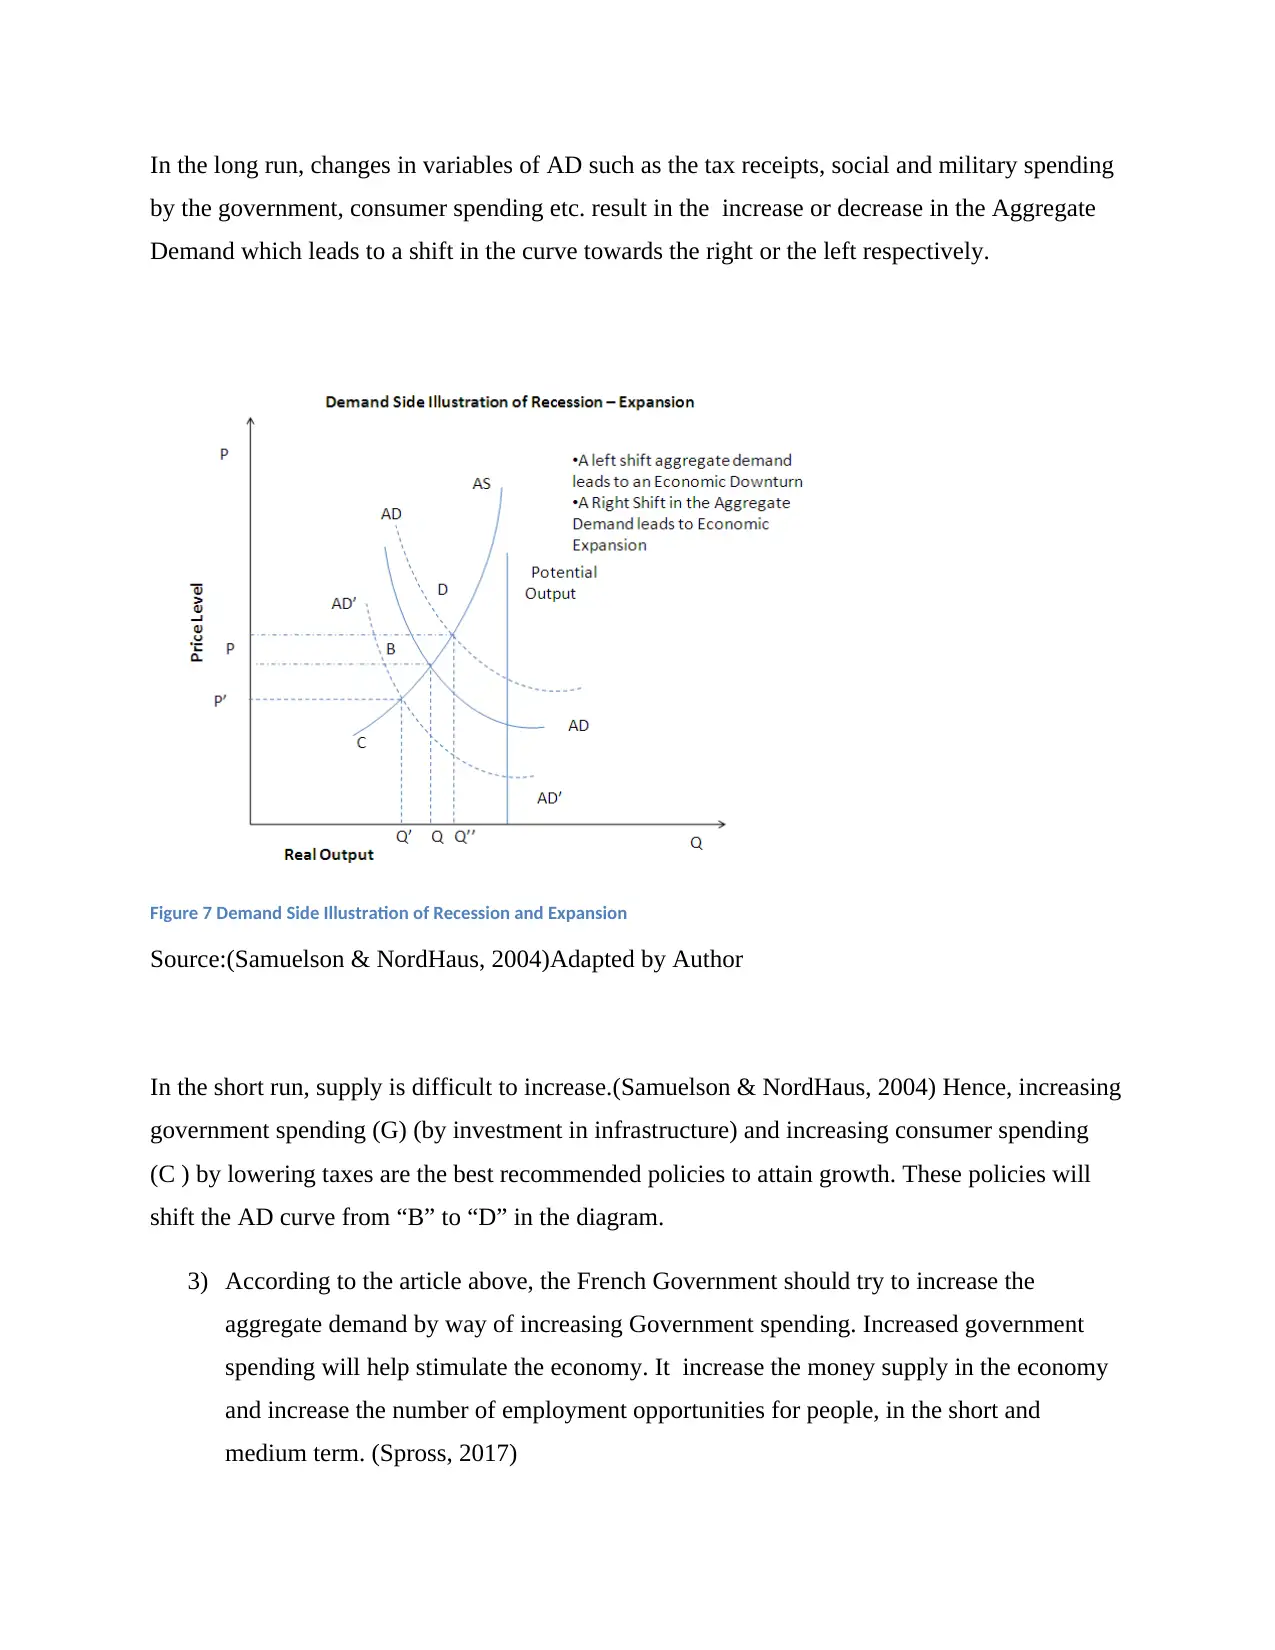
In the long run, changes in variables of AD such as the tax receipts, social and military spending
by the government, consumer spending etc. result in the increase or decrease in the Aggregate
Demand which leads to a shift in the curve towards the right or the left respectively.
Figure 7 Demand Side Illustration of Recession and Expansion
Source:(Samuelson & NordHaus, 2004)Adapted by Author
In the short run, supply is difficult to increase.(Samuelson & NordHaus, 2004) Hence, increasing
government spending (G) (by investment in infrastructure) and increasing consumer spending
(C ) by lowering taxes are the best recommended policies to attain growth. These policies will
shift the AD curve from “B” to “D” in the diagram.
3) According to the article above, the French Government should try to increase the
aggregate demand by way of increasing Government spending. Increased government
spending will help stimulate the economy. It increase the money supply in the economy
and increase the number of employment opportunities for people, in the short and
medium term. (Spross, 2017)
Paraphrase This Document
Need a fresh take? Get an instant paraphrase of this document with our AI Paraphraser

In the long term, the effects will however, be amplified since the article recommends social
spending in “productive sectors” of the economy i.e public infrastructure and public education.
These activities would increase the social capital of the economy.(Samuelson & NordHaus,
2004)
The article advocates improvement in “human capital”. France need to look at its work force as
human capital and less like labour and seek to increase its productivity. The OECD has
expressed concerns over “weakening productivity trends” . Investment in human capital, in the
short run and long run can help increase the productivity of the workers which gives the
employers a cause to increase wages. (Organization for Economic Co-operation and
Development, 2017)
The need for skills is especially dire among the poor who do not live in urban areas as there is
lack to basic public services such as education. Workers with low skills do not have adequate
access to jobs or to skill development programs. Access is especially restricted to poor people
who are not from urban areas as lack of public infrastructure such as public transport, public
education etc. is relatively greater among these demographics. Investment in infrastructure will
help solve this problem.(Organization for Economic Co-operation and Development, 2017)
Investment in skill development will improve the quality of human capital in the long run as
firms will tend to be attracted to increase production in France, if there is an availability of
skilled workers.(Wilson & Briscoe, 2004)
The increase in wages will increase the consumption in the economy and thereby increase the
Aggregate Demand. In the diagram below, if the Aggregate demand shifts closer to the potential
supply, the total output or Gross Domestic Product will tend to increase while if the aggregate
demand decreases, the Total Output or GDP will tend to decrease. Investment in education and
infrastructure will shift the curve to the right.(Samuelson & Nordhaus, 2004)
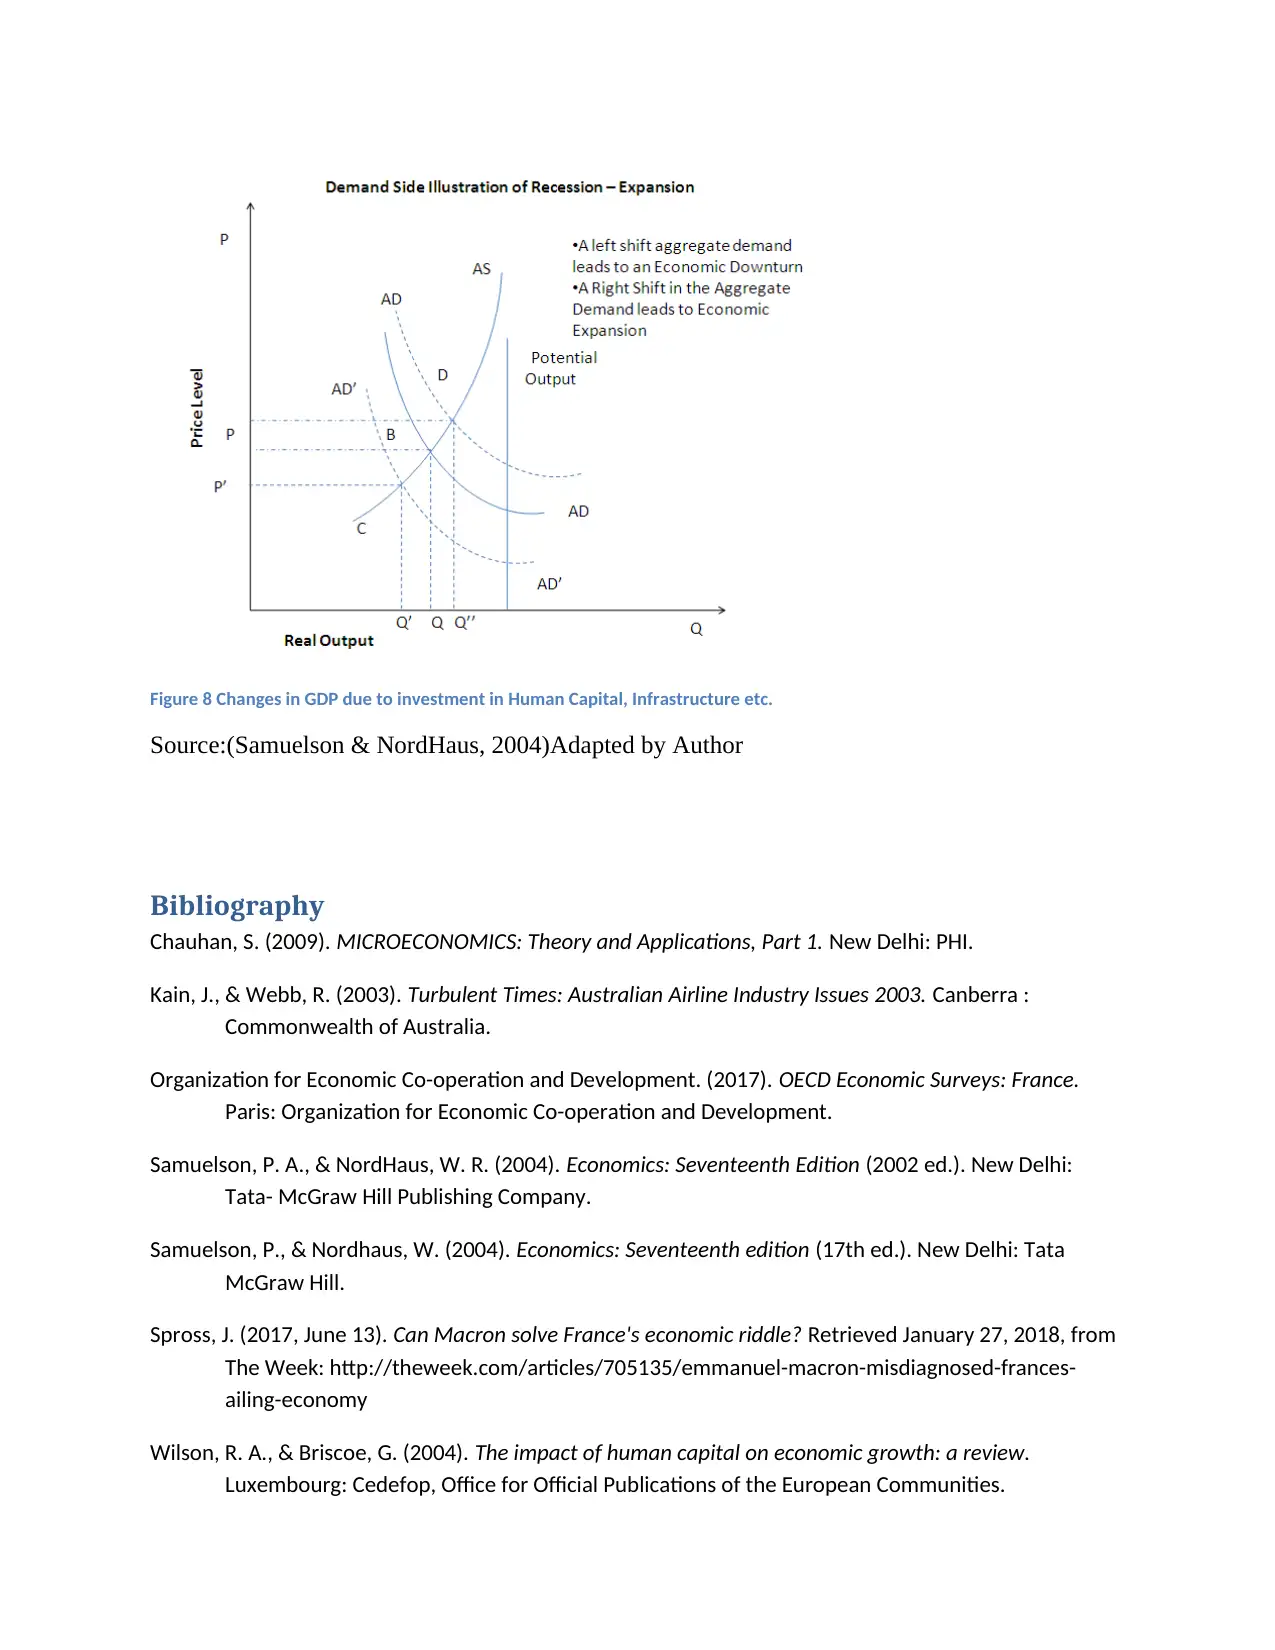
Figure 8 Changes in GDP due to investment in Human Capital, Infrastructure etc.
Source:(Samuelson & NordHaus, 2004)Adapted by Author
Bibliography
Chauhan, S. (2009). MICROECONOMICS: Theory and Applications, Part 1. New Delhi: PHI.
Kain, J., & Webb, R. (2003). Turbulent Times: Australian Airline Industry Issues 2003. Canberra :
Commonwealth of Australia.
Organization for Economic Co-operation and Development. (2017). OECD Economic Surveys: France.
Paris: Organization for Economic Co-operation and Development.
Samuelson, P. A., & NordHaus, W. R. (2004). Economics: Seventeenth Edition (2002 ed.). New Delhi:
Tata- McGraw Hill Publishing Company.
Samuelson, P., & Nordhaus, W. (2004). Economics: Seventeenth edition (17th ed.). New Delhi: Tata
McGraw Hill.
Spross, J. (2017, June 13). Can Macron solve France's economic riddle? Retrieved January 27, 2018, from
The Week: http://theweek.com/articles/705135/emmanuel-macron-misdiagnosed-frances-
ailing-economy
Wilson, R. A., & Briscoe, G. (2004). The impact of human capital on economic growth: a review.
Luxembourg: Cedefop, Office for Official Publications of the European Communities.
⊘ This is a preview!⊘
Do you want full access?
Subscribe today to unlock all pages.
Trusted by 1+ million students worldwide
1 out of 13
Related Documents


Your All-in-One AI-Powered Toolkit for Academic Success.
+13062052269
info@desklib.com
Available 24*7 on WhatsApp / Email
![[object Object]](/_next/static/media/star-bottom.7253800d.svg)
Unlock your academic potential
Copyright © 2020–2026 A2Z Services. All Rights Reserved. Developed and managed by ZUCOL.