Economic Analysis: Beer Consumption, Wage Growth in Australia & USA
VerifiedAdded on 2022/11/09
|14
|3014
|224
Report
AI Summary
This economics report provides a comparative analysis of beer consumption patterns in Australia and Germany, exploring factors such as cultural influences, pricing, and market dynamics. It examines the reasons for differences in consumption levels, the price elasticity of demand for beer in Australia, and the impact of excise taxes on the beer market. The report also delves into the cost-benefit analysis of alcohol consumption, the role of government in reducing consumption, and policies implemented by the Australian government. Furthermore, it discusses real wage growth trends in Australia and the United States, analyzing the effects of minimum wage laws on employment and unemployment. The report uses economic principles to explain these phenomena and provides a comprehensive overview of the beer market and labor market dynamics in both countries.
Running head: ECONOMICS
ECONOMICS
Name of the Student:
Name of the University:
Author note:
ECONOMICS
Name of the Student:
Name of the University:
Author note:
Paraphrase This Document
Need a fresh take? Get an instant paraphrase of this document with our AI Paraphraser
1ECONOMICS
Market for beer
1. Comparison of rate of beer consumption between Australia and Germany
and best measure for making effective comparisons
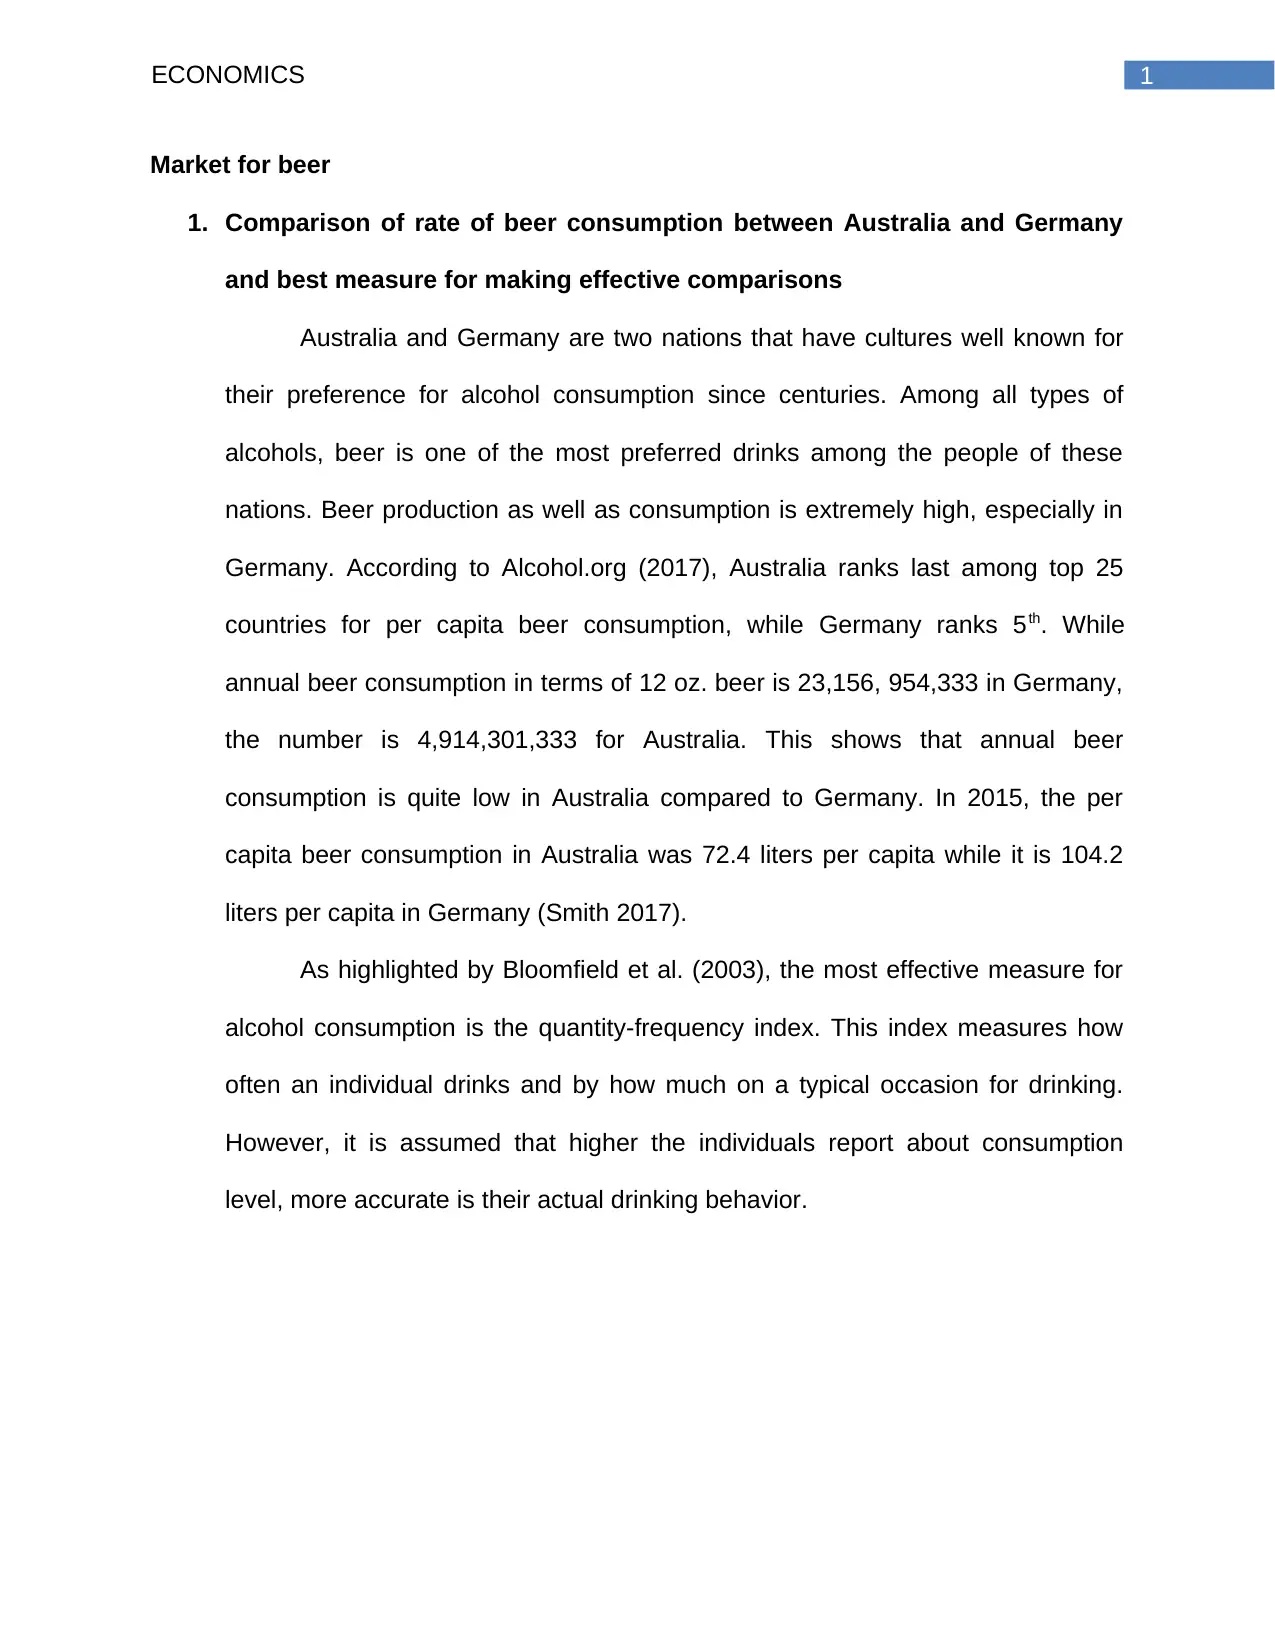
Australia and Germany are two nations that have cultures well known for
their preference for alcohol consumption since centuries. Among all types of
alcohols, beer is one of the most preferred drinks among the people of these
nations. Beer production as well as consumption is extremely high, especially in
Germany. According to Alcohol.org (2017), Australia ranks last among top 25
countries for per capita beer consumption, while Germany ranks 5th. While
annual beer consumption in terms of 12 oz. beer is 23,156, 954,333 in Germany,
the number is 4,914,301,333 for Australia. This shows that annual beer
consumption is quite low in Australia compared to Germany. In 2015, the per
capita beer consumption in Australia was 72.4 liters per capita while it is 104.2
liters per capita in Germany (Smith 2017).
As highlighted by Bloomfield et al. (2003), the most effective measure for
alcohol consumption is the quantity-frequency index. This index measures how
often an individual drinks and by how much on a typical occasion for drinking.
However, it is assumed that higher the individuals report about consumption
level, more accurate is their actual drinking behavior.
Market for beer
1. Comparison of rate of beer consumption between Australia and Germany
and best measure for making effective comparisons
Australia and Germany are two nations that have cultures well known for
their preference for alcohol consumption since centuries. Among all types of
alcohols, beer is one of the most preferred drinks among the people of these
nations. Beer production as well as consumption is extremely high, especially in
Germany. According to Alcohol.org (2017), Australia ranks last among top 25
countries for per capita beer consumption, while Germany ranks 5th. While
annual beer consumption in terms of 12 oz. beer is 23,156, 954,333 in Germany,
the number is 4,914,301,333 for Australia. This shows that annual beer
consumption is quite low in Australia compared to Germany. In 2015, the per
capita beer consumption in Australia was 72.4 liters per capita while it is 104.2
liters per capita in Germany (Smith 2017).
As highlighted by Bloomfield et al. (2003), the most effective measure for
alcohol consumption is the quantity-frequency index. This index measures how
often an individual drinks and by how much on a typical occasion for drinking.
However, it is assumed that higher the individuals report about consumption
level, more accurate is their actual drinking behavior.
2ECONOMICS
2. Reasons for difference in beer consumption between Australia and
Germany
Numerous different drinking attitudes and cultures exist across the world.
In case of Australia and Germany, both the countries have popular drinking
cultural history for more than 500 years. April 23, 2019 marked the 503rd German
Beer Day (Statistisches Bundesamt 2018) and the Germans enjoy their beer with
beer festivals, beer gardens etc. Germany is the first European nation to
introduce beer standards and quality control. The Bavarian minority, known as
the most beer loving people with yearly per capita consumption of 170 liters, also
contribute in creating the beer culture of Germany. They also celebrate
Oktoberfest beer festival (Convictcreations.com 2019). Australia is also known
for its beer culture but the Aussies prefer other types of alcohol also such as
wine. The wine market of Australia is larger than the beer market, while Germany
is the major producer of beer. Around 6000 beers are produced in more than
1350 breweries in Germany, where half of these exist in Bavaria (Germany.travel
2019) and hence, the local breweries supply a large amount of local beers at a
low price. Thus, another major reason for difference in beer comparison between
Australia and Germany is the price of beer. Beer in Germany is extremely cheap.
The price of a case of beer is around €12 or USD 17 while the beer price in
Australia is one of the highest in the world (Kaplan 2017) and a 500ml bottle of
beer in Melbourne is USD 6.70 or AUD 8 and in Sydney, it comes for USD 5.40
or AUD 8.
⊘ This is a preview!⊘
Do you want full access?
Subscribe today to unlock all pages.
Trusted by 1+ million students worldwide
3ECONOMICS
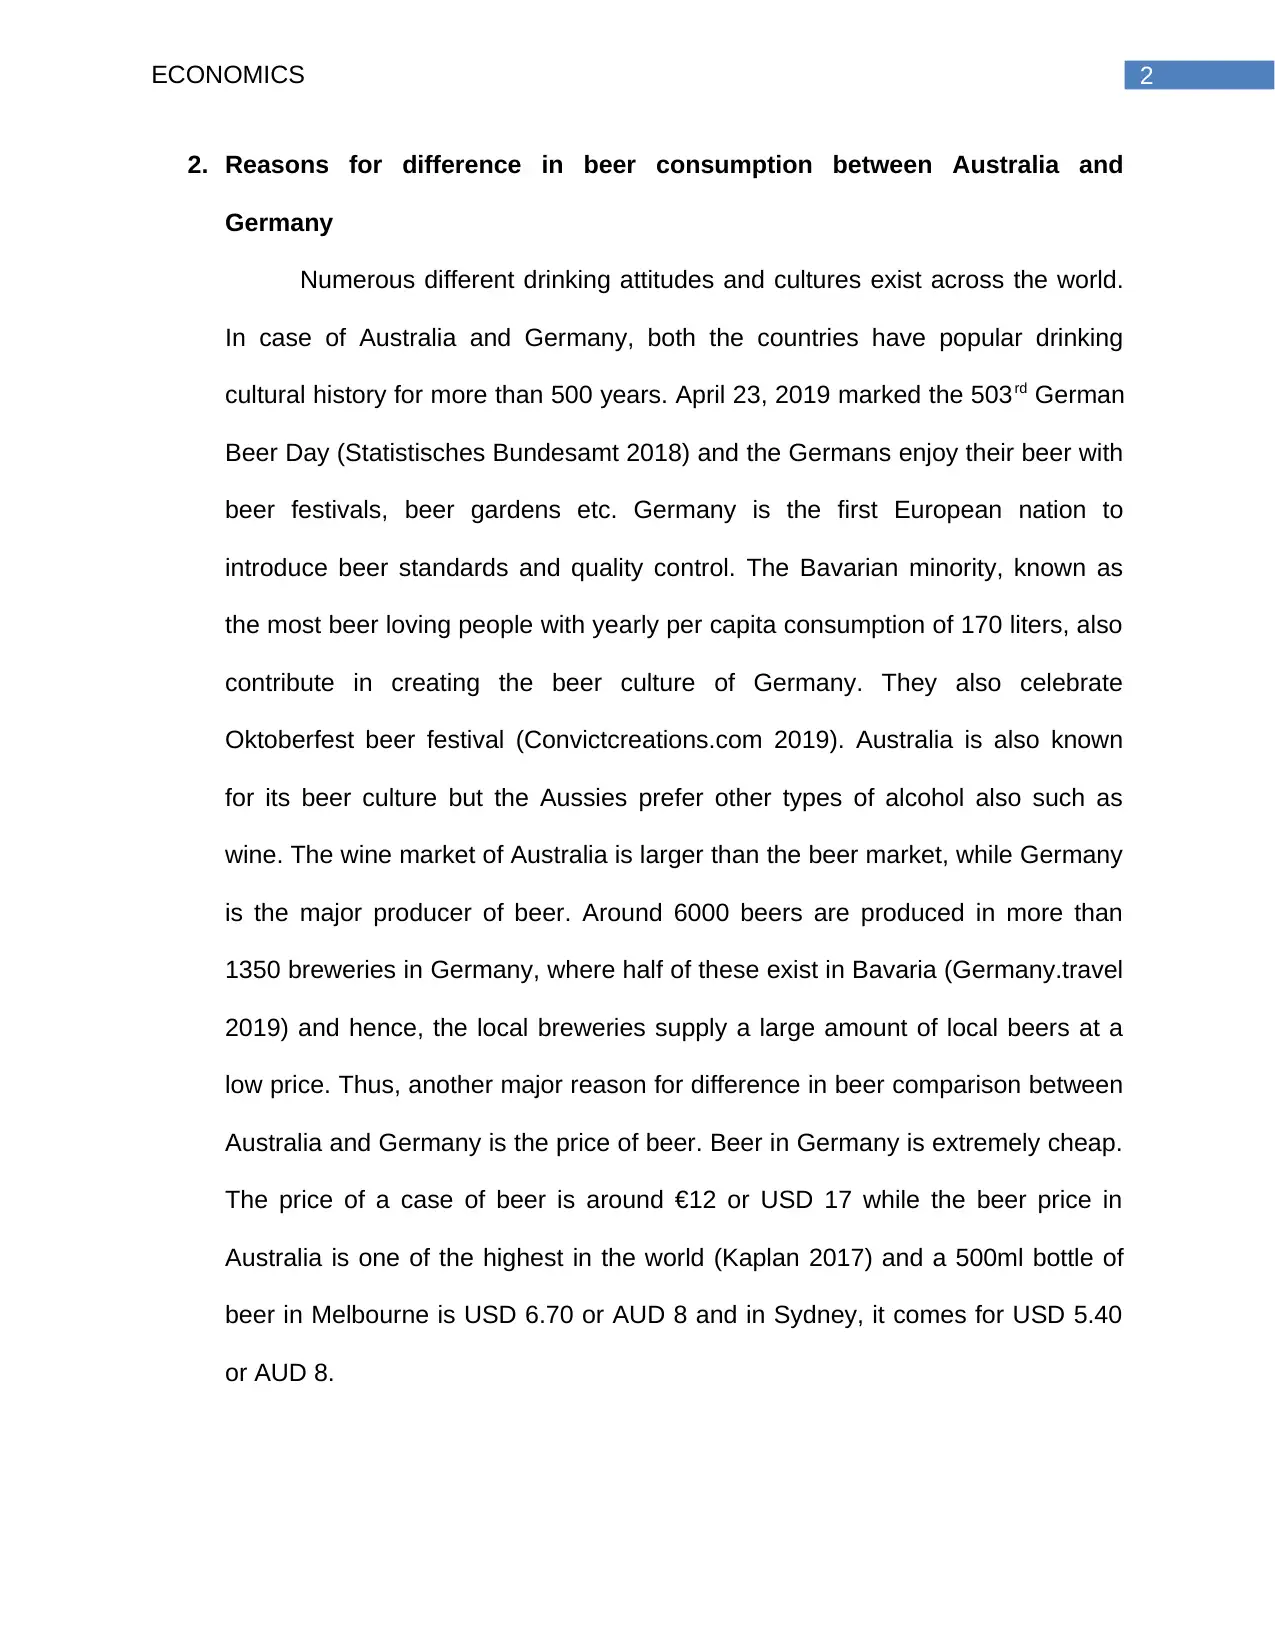
3. Price elasticity of beer demand in Australia and factors affecting the
elasticity of demand of beer
Price elasticity of demand for a product refers to the percentage change in
the quantity demanded due to one percentage change in the price of the product
(Jawad et al. 2018). As per the Australian culture, beer is considered to be a
normal good, for which, changes in price do not affect its quantity demanded
significantly. Factors that affect the elasticity of beer demand are its price,
varieties, substitute alcohol varieties, such as, wine, whiskey, and other types of
spirits, income of consumers, tastes and preferences, culture, brand name etc.
However, type of good and price are the prime factors that affect the price
elasticity of demand of beer (De Loecker and Scott 2016).
Beer market is not homogenous as numerous varieties are available at
different price levels, and hence, during price rise for a particular variety,
consumers usually switch to low priced varieties. Thus, elasticity for beer is
treated as relatively inelastic (De Loecker and Scott 2016).
Paraphrase This Document
Need a fresh take? Get an instant paraphrase of this document with our AI Paraphraser
4ECONOMICS
S1
S2 = S1 + T
D
E1
E2
P1
P2
P2’
T
Q1Q2
E3
Quantity of beer
Price
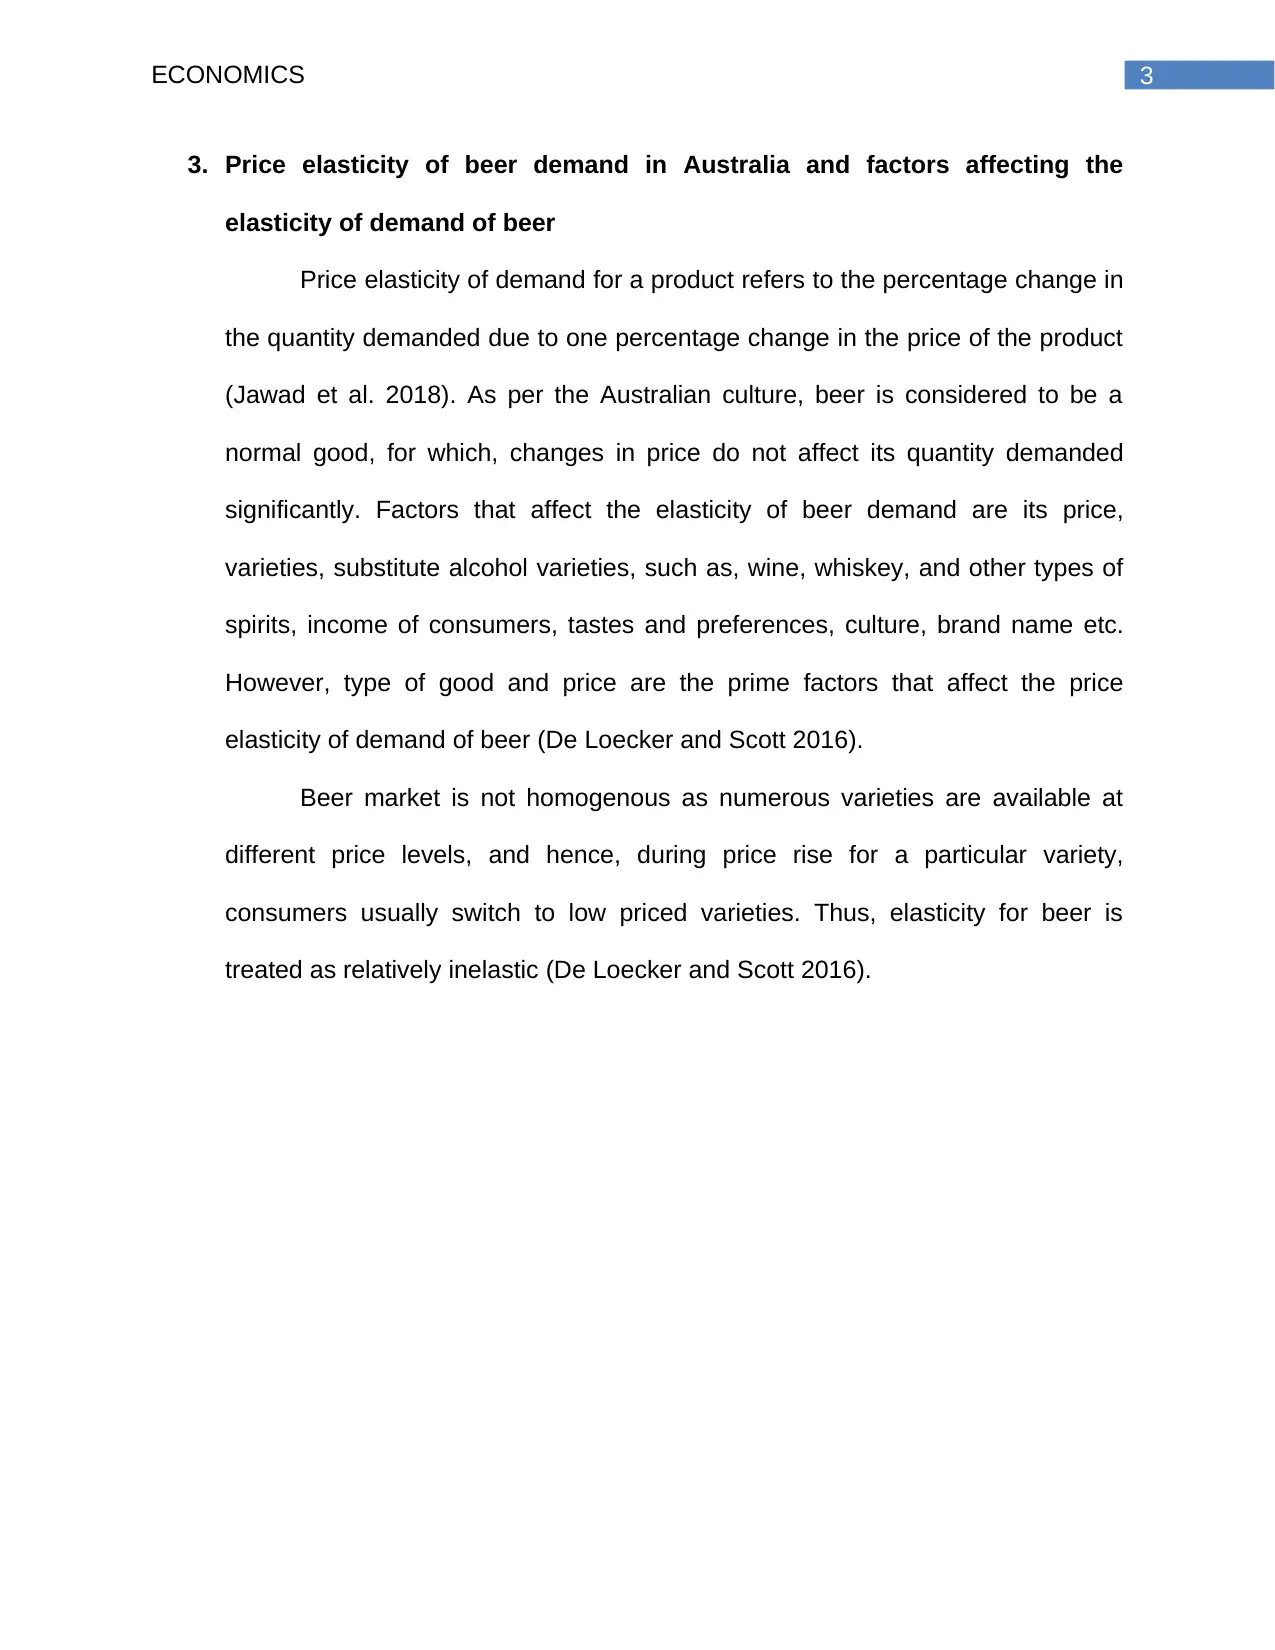
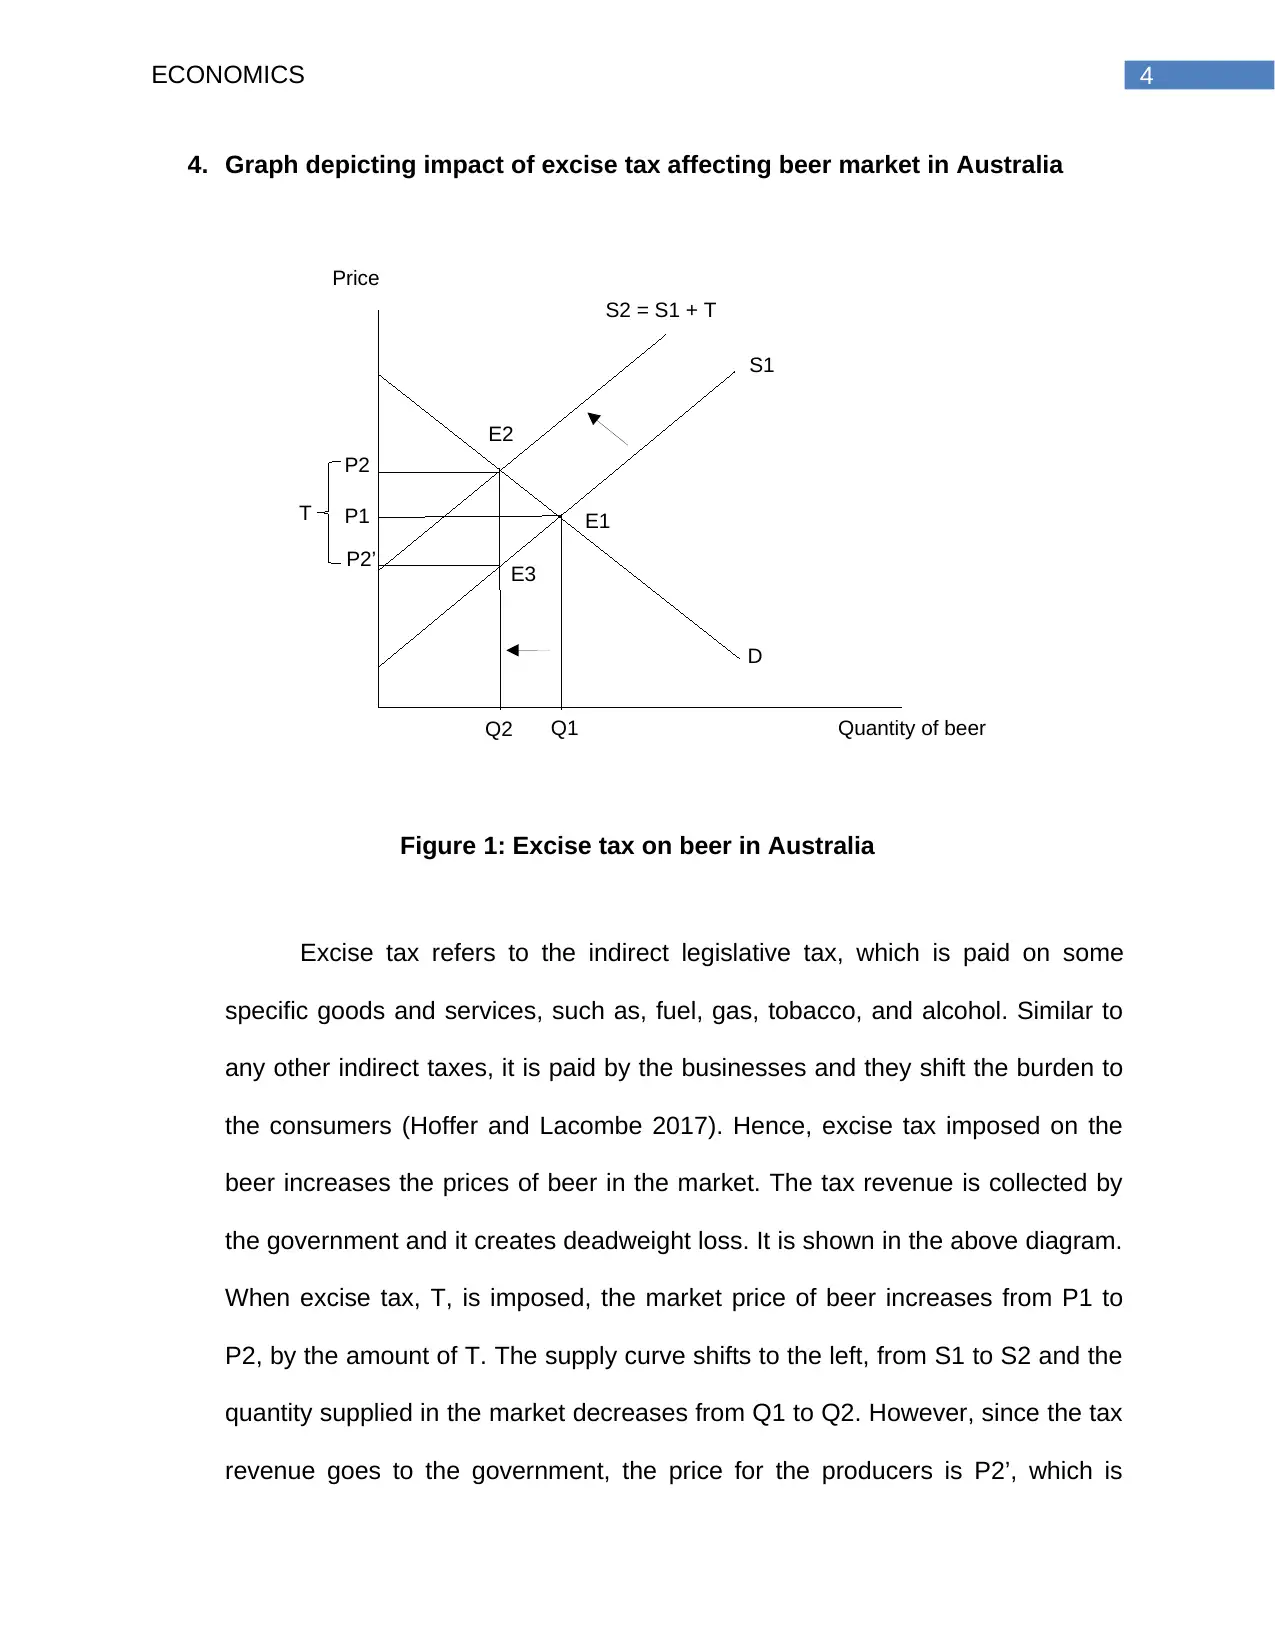
4. Graph depicting impact of excise tax affecting beer market in Australia
Figure 1: Excise tax on beer in Australia
Excise tax refers to the indirect legislative tax, which is paid on some
specific goods and services, such as, fuel, gas, tobacco, and alcohol. Similar to
any other indirect taxes, it is paid by the businesses and they shift the burden to
the consumers (Hoffer and Lacombe 2017). Hence, excise tax imposed on the
beer increases the prices of beer in the market. The tax revenue is collected by
the government and it creates deadweight loss. It is shown in the above diagram.
When excise tax, T, is imposed, the market price of beer increases from P1 to
P2, by the amount of T. The supply curve shifts to the left, from S1 to S2 and the
quantity supplied in the market decreases from Q1 to Q2. However, since the tax
revenue goes to the government, the price for the producers is P2’, which is
S1
S2 = S1 + T
D
E1
E2
P1
P2
P2’
T
Q1Q2
E3
Quantity of beer
Price
4. Graph depicting impact of excise tax affecting beer market in Australia
Figure 1: Excise tax on beer in Australia
Excise tax refers to the indirect legislative tax, which is paid on some
specific goods and services, such as, fuel, gas, tobacco, and alcohol. Similar to
any other indirect taxes, it is paid by the businesses and they shift the burden to
the consumers (Hoffer and Lacombe 2017). Hence, excise tax imposed on the
beer increases the prices of beer in the market. The tax revenue is collected by
the government and it creates deadweight loss. It is shown in the above diagram.
When excise tax, T, is imposed, the market price of beer increases from P1 to
P2, by the amount of T. The supply curve shifts to the left, from S1 to S2 and the
quantity supplied in the market decreases from Q1 to Q2. However, since the tax
revenue goes to the government, the price for the producers is P2’, which is
5ECONOMICS
lower than the initial market price, P1. Hence, they reduce the market supply. On
the other hand, the consumers pay a higher price P2 and the area E1E2E3
shows the deadweight loss.
5. Cost-benefit analysis on private and social consumption decision and
reasons for government to reduce beer consumption
Drinking excessive amount of alcohol would have significant impact on an
individual’s health as well as social consequences. For example, too much of
alcohol can have damaging impact on the lifestyle of the individuals, can yield
liver diseases, such as, cirrhosis, obesity, and can even lead to accidental death
in case of drinking and driving (Parry et al. 2019). These issues result in not only
private costs but also social costs. On one hand, if too many people of the
society are having mental and physical health issues due to excessive alcohol
consumption, then productivity of the society reduces and expenditure on
healthcare increases. On the other hand, revenue of the alcohol manufacturing
industry depends on social consumption. This industry contributes a significant
amount in a nation’s GDP and when the government imposes tax, it also earns
substantial revenue from the alcohol industry (Colen and Swinnen 2016).
However, the government should take measures to establish a habit for
controlled consumption of beer among the people. The government should
reduce beer consumption in a manner so that both the producers and consumers
enjoy the benefits of the industry. They should enjoy the beer, which would help
the beer industry running, and earn significant revenue. At the same time, the
⊘ This is a preview!⊘
Do you want full access?
Subscribe today to unlock all pages.
Trusted by 1+ million students worldwide
6ECONOMICS
price of beer would be set in a manner so that people do not indulge in
irresponsible behavior resulting in social damage (Bartram, Eliott and Crabb
2017).
6. Description and evaluation of Australian government to reduce alcohol
consumption (other than tax)
The Australian government has taken quite a few policies to reduce
alcohol consumption, for example, restriction on availability, advertising, legal
policies, and other than pricing and tax. There are changes in the days and hours
of alcoholic beverages sales, which have resulted in reduction in alcohol
availability. The reduction in the number of outlets in a particular region also
reduces alcohol availability and hence, reduces consumption (Karriker-Jaffe et al.
2018).
The government of Australia spends a substantial amount of money for
launching campaigns and advertisements to reduce alcohol consumption. The
National Campaign Against Drug Abuse is single source of funding for the
advertisements for responsible use of alcohol and has the budget of less than $5
million for all types of campaigns for drugs and alcohol abuse. On the other hand,
the liquor industry spent millions of dollars for their campaigns. Thus, the
government must increase their campaign funding to reduce alcohol
consumption (Aic.gov.au 2017).
The legal policies are designed in a manner to reduce alcohol related
problems in the Australian society. In the legal policies, measures taken for
Paraphrase This Document
Need a fresh take? Get an instant paraphrase of this document with our AI Paraphraser
7ECONOMICS
controlling the alcohol level in blood for the drivers, prohibiting of under-age
drinking and strict penalties if found guilty, introducing adequate provision of
treatment and healthcare for people in corrective situation, and some positive
identification for establishing a legal age for drinking, and mechanisms to
address conflicts of people with law in case of alcohol related problems.
Labor market
1. Meaning of real wage growth
Real wage refers to the value of the wages that are adjusted for inflation.
The real wage of a nation reflects the changes in the standard of living over the
years. As stated by Bishop and Cassidy (2017), real wage represents the amount
of products and services that can be purchased. Thus, real wage growth
indicates the inflation adjusted value of wages in the economy and the
improvement or increase in the standard of living.
2. Comparison of real wage growth in Australia and United States. Summary
of trend in last 10 years
The real wage growth in Australia and USA has been falling in the past
decade due to increasing inflation in both the countries. There have been
increase in the nominal wages in Australia and USA. Both the countries
experienced an increase in their GDP and consequently in the nominal wages.
However, at the same time, the inflation rates have also increased rapidly, which
8ECONOMICS
kept the inflation adjusted wage growth at a lower level. According to
Treasury.gov.au (2017), the regional mining areas of Australia witnessed faster
growth in wages but the wage growth slowed in both mining and non-mining
areas and the growth in wages was almost similar in the capital cities and the
regional areas, however, the wage level is higher in the cities. It has been
observed that businesses with higher productivity paid higher wages to the
employees and they experienced higher wage growth, and the money flow in the
economy had increased resulting inflation and affecting real wage growth across
the economy.
Similar phenomenon has been observed in the US economy. Since 2009,
the nominal wages have been increased along the GDP of the economy, and the
inflation rate has increased too. Thus, cost of living has increased at least 2.7%
on an average. In such a situation, 2.8% real wage growth is negligible (Watson
2018). Thus, in the past 10 years in the US economy, the real wage growth was
highest in 2015 and since then it is trending down (Long 2018). Stagnation in pay
was observed affecting the real wage growth.
3. Current minimum wage laws in Australia and graph depicting the effects of
minimum wage
The current minimum wage laws in Australia mention the minimum base
rate of payment for the hours worked for employees, who is not under any
modern award or agreement. Fair Work Commission (FWC) Australia sets the
minimum wage and as per July 1, 2019, the minimum wage is $740.80 per week.
⊘ This is a preview!⊘
Do you want full access?
Subscribe today to unlock all pages.
Trusted by 1+ million students worldwide
9ECONOMICS
S
D
W1
Wmin
E1E2 E3 Employment
Hourly wage
Unemployment
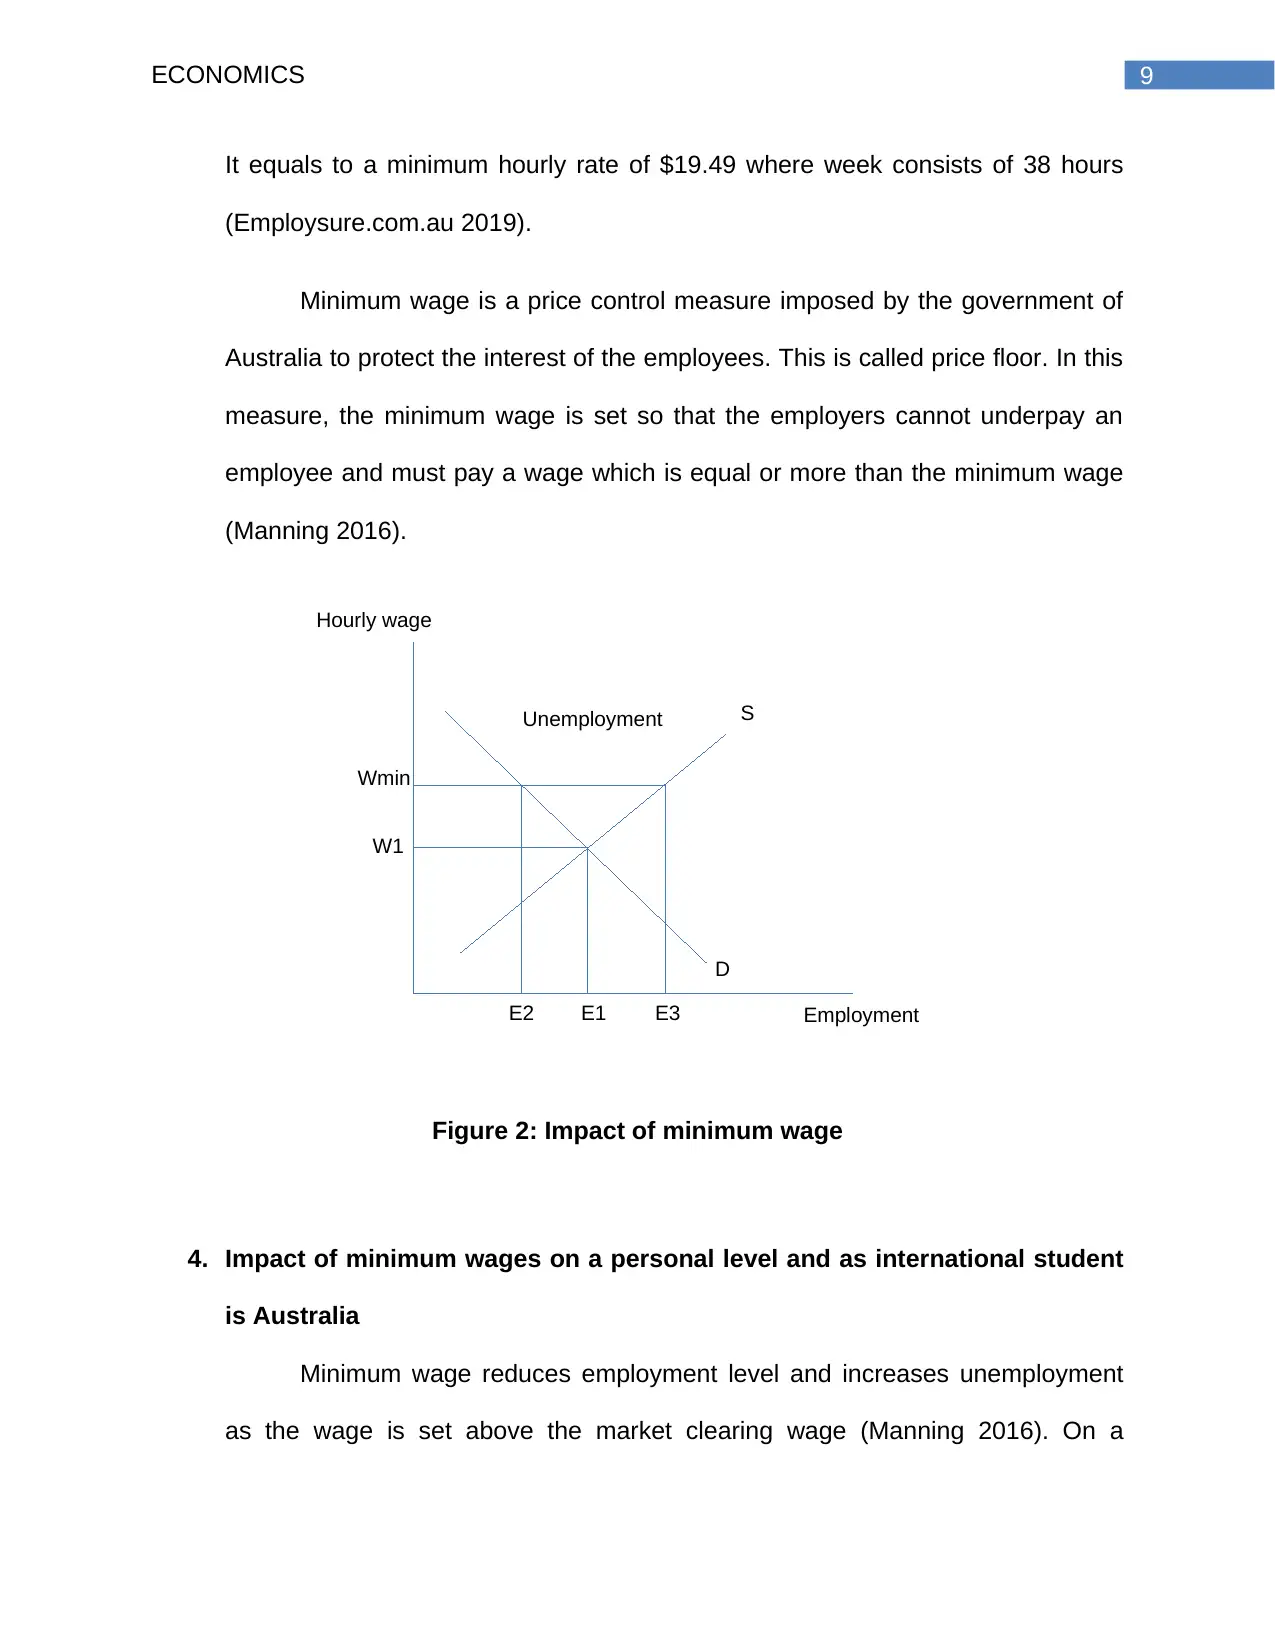
It equals to a minimum hourly rate of $19.49 where week consists of 38 hours
(Employsure.com.au 2019).
Minimum wage is a price control measure imposed by the government of
Australia to protect the interest of the employees. This is called price floor. In this
measure, the minimum wage is set so that the employers cannot underpay an
employee and must pay a wage which is equal or more than the minimum wage
(Manning 2016).
Figure 2: Impact of minimum wage
4. Impact of minimum wages on a personal level and as international student
is Australia
Minimum wage reduces employment level and increases unemployment
as the wage is set above the market clearing wage (Manning 2016). On a
S
D
W1
Wmin
E1E2 E3 Employment
Hourly wage
Unemployment
It equals to a minimum hourly rate of $19.49 where week consists of 38 hours
(Employsure.com.au 2019).
Minimum wage is a price control measure imposed by the government of
Australia to protect the interest of the employees. This is called price floor. In this
measure, the minimum wage is set so that the employers cannot underpay an
employee and must pay a wage which is equal or more than the minimum wage
(Manning 2016).
Figure 2: Impact of minimum wage
4. Impact of minimum wages on a personal level and as international student
is Australia
Minimum wage reduces employment level and increases unemployment
as the wage is set above the market clearing wage (Manning 2016). On a
Paraphrase This Document
Need a fresh take? Get an instant paraphrase of this document with our AI Paraphraser
10ECONOMICS
personal level, it is a concern as the level of minimum wage is revised by the
FWC from July 1, 2019 and it’s a 3% increase from previous years, and that will
create excess supply of workers in the market. Thus, the level of unemployment
will increase after the new minimum wage is applied.
personal level, it is a concern as the level of minimum wage is revised by the
FWC from July 1, 2019 and it’s a 3% increase from previous years, and that will
create excess supply of workers in the market. Thus, the level of unemployment
will increase after the new minimum wage is applied.
11ECONOMICS
References
Aic.gov.au, 2017. An Overview: the Issues and the National Alcohol Policy. [online]
Aic.gov.au. Available at:
https://aic.gov.au/sites/default/files/publications/proceedings/downloads/01-elvy.pdf
[Accessed 16 Sep. 2019].
Alcohol.org, 2017. Beer & Wine Production and Consumption Rates. [online]
Alcohol.org. Available at: https://www.alcohol.org/guides/beer-wine-production-
consumption-worldwide/ [Accessed 16 Sep. 2019].
Bartram, A., Eliott, J. and Crabb, S., 2017. ‘Why can't I just not drink?’A qualitative study
of adults' social experiences of stopping or reducing alcohol consumption. Drug and
alcohol review, 36(4), pp.449-455.
Bishop, J. and Cassidy, N., 2017. Insights into low wage growth in Australia. RBA
Bulletin, March, pp.13-20.
Bloomfield, K., Stockwell, T., Gmel, G. and Rehn, N., 2003. International comparisons
of alcohol consumption. Alcohol research and health, 27(1), pp.95-109.
Colen, L. and Swinnen, J., 2016. Economic growth, globalisation and beer
consumption. Journal of Agricultural Economics, 67(1), pp.186-207.
Convictcreations.com, 2019. Cultural Differences between Australia and Germany.
[online] Convictcreations.com. Available at:
http://www.convictcreations.com/culture/germany.html [Accessed 16 Sep. 2019].
⊘ This is a preview!⊘
Do you want full access?
Subscribe today to unlock all pages.
Trusted by 1+ million students worldwide
1 out of 14
Related Documents


Your All-in-One AI-Powered Toolkit for Academic Success.
+13062052269
info@desklib.com
Available 24*7 on WhatsApp / Email
![[object Object]](/_next/static/media/star-bottom.7253800d.svg)
Unlock your academic potential
Copyright © 2020–2026 A2Z Services. All Rights Reserved. Developed and managed by ZUCOL.