USQ ECO5000 Assignment 2: Short Answer Questions/Problems Analysis
VerifiedAdded on 2022/10/10
|14
|2555
|415
Homework Assignment
AI Summary
This economics assignment solution addresses seven short-answer questions and problems related to ECO5000, covering modules 2-5 and chapters 7-12. The first question calculates marginal, total, and average costs, determining the break-even price. The second analyzes supply and demand schedules. The third examines the economics of Valentine's Day rose prices. The fourth contrasts competitive and monopoly markets. The fifth explores mining strategies and government roles. The sixth analyzes the impact of Australian dollar appreciation on exports, imports, and tourism, and the revenue of subsidiaries in Japan. The seventh discusses reference prices. Each answer is thoroughly explained with relevant examples and graphs to enhance understanding.
Running Head: ECONOMICS 0
Economics
(Student Name)
Economics
(Student Name)
Paraphrase This Document
Need a fresh take? Get an instant paraphrase of this document with our AI Paraphraser
ECONOMICS 1
Table of Contents
Answer1.....................................................................................................................................2
Answer 2....................................................................................................................................2
Answer 3....................................................................................................................................4
Answer 4....................................................................................................................................5
Answer 5....................................................................................................................................6
Answer 6....................................................................................................................................7
Part A......................................................................................................................................7
Part B......................................................................................................................................7
Answer 7....................................................................................................................................8
References..................................................................................................................................9
ECONOMICS 2
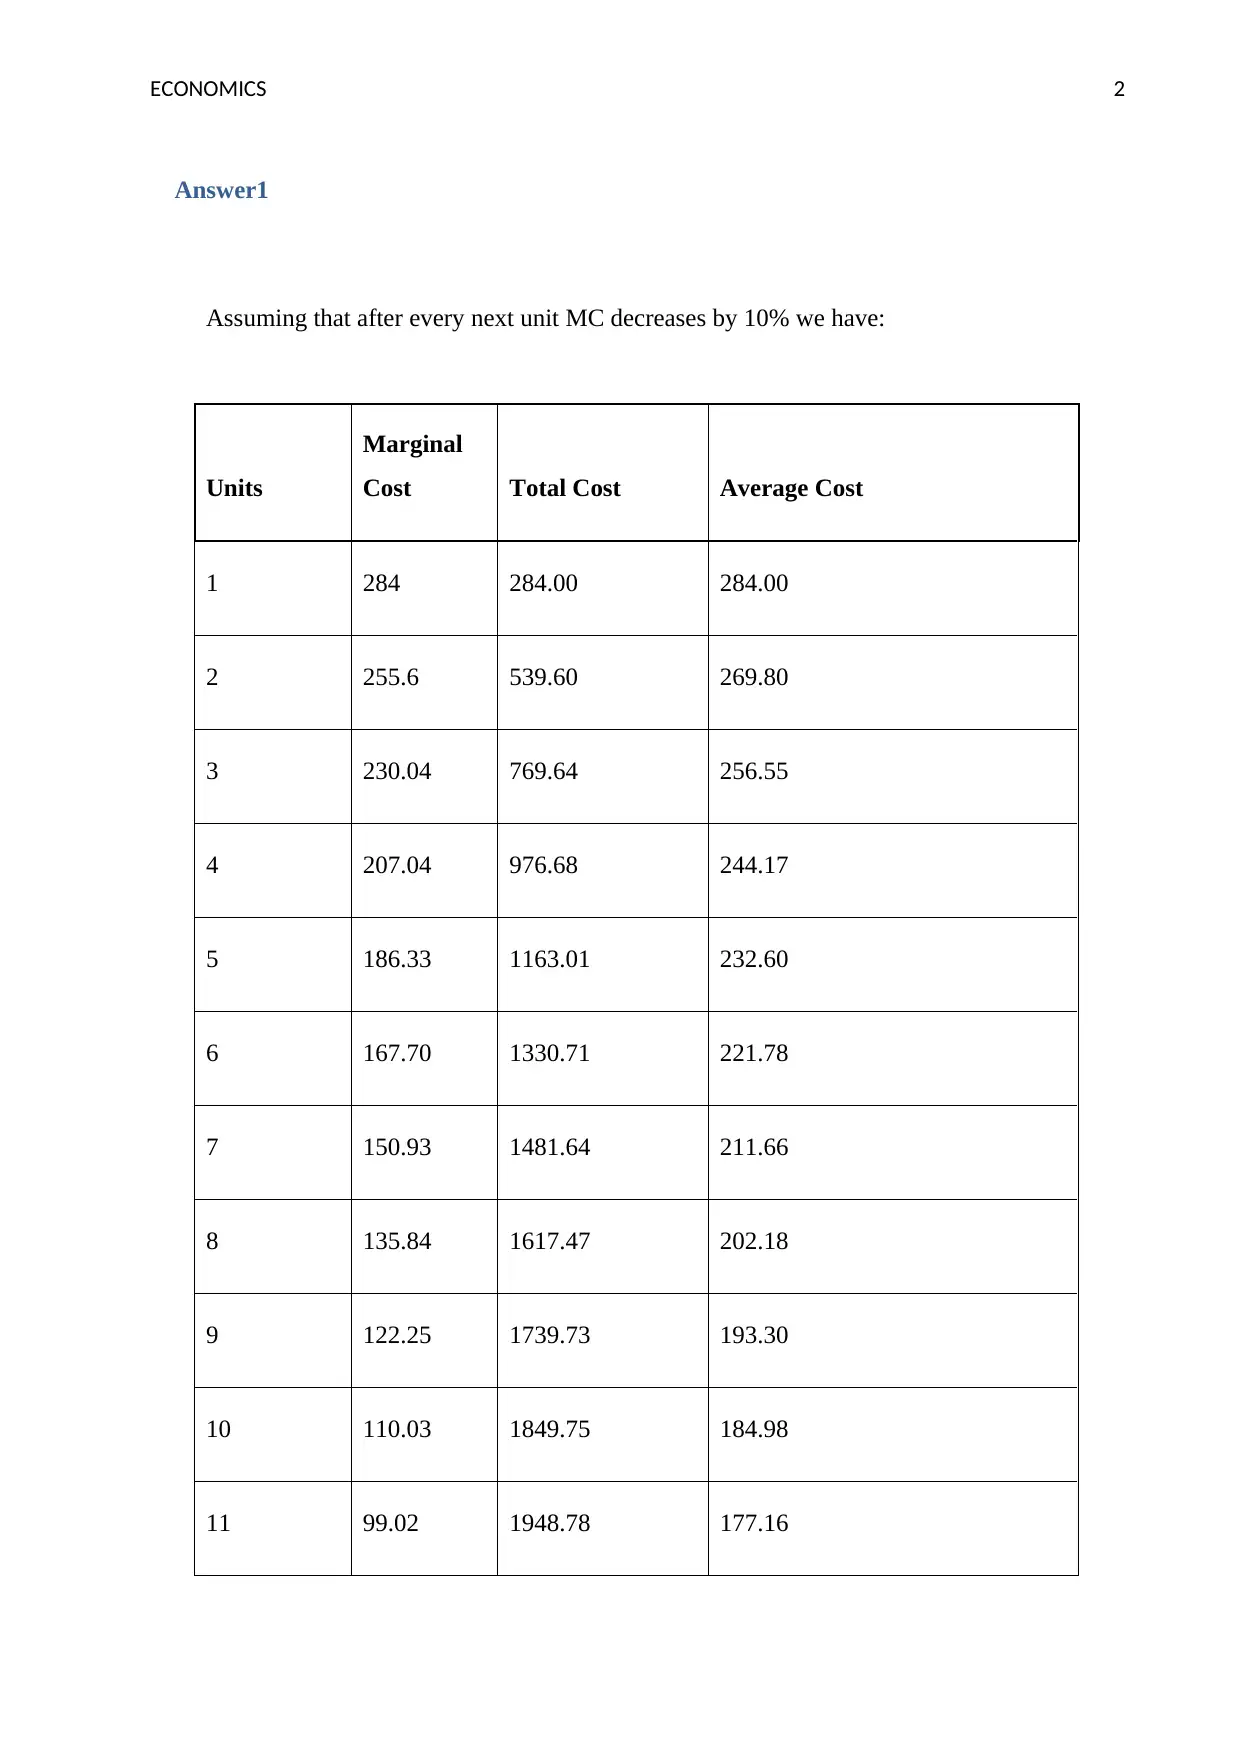
Answer1
Assuming that after every next unit MC decreases by 10% we have:
Units
Marginal
Cost Total Cost Average Cost
1 284 284.00 284.00
2 255.6 539.60 269.80
3 230.04 769.64 256.55
4 207.04 976.68 244.17
5 186.33 1163.01 232.60
6 167.70 1330.71 221.78
7 150.93 1481.64 211.66
8 135.84 1617.47 202.18
9 122.25 1739.73 193.30
10 110.03 1849.75 184.98
11 99.02 1948.78 177.16
⊘ This is a preview!⊘
Do you want full access?
Subscribe today to unlock all pages.
Trusted by 1+ million students worldwide
ECONOMICS 3
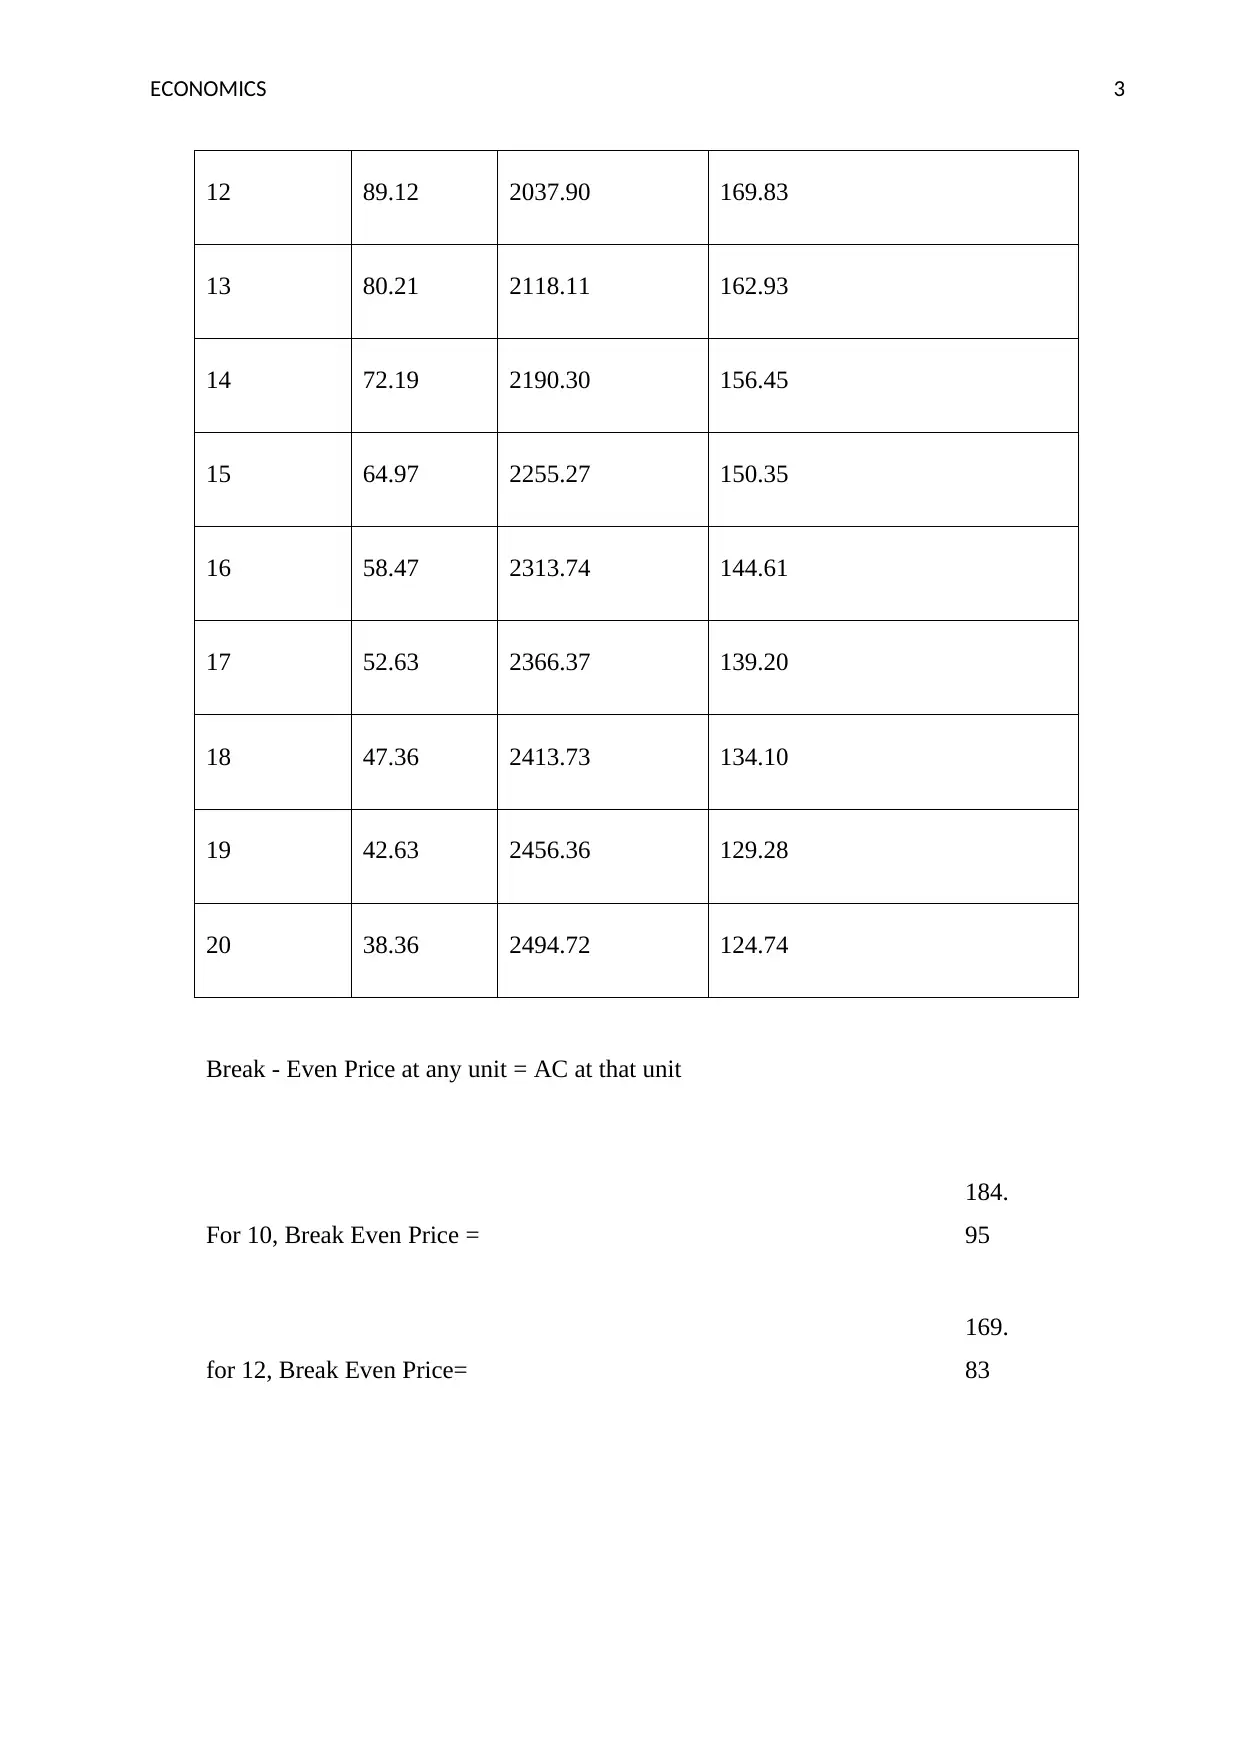
12 89.12 2037.90 169.83
13 80.21 2118.11 162.93
14 72.19 2190.30 156.45
15 64.97 2255.27 150.35
16 58.47 2313.74 144.61
17 52.63 2366.37 139.20
18 47.36 2413.73 134.10
19 42.63 2456.36 129.28
20 38.36 2494.72 124.74
Break - Even Price at any unit = AC at that unit
For 10, Break Even Price =
184.
95
for 12, Break Even Price=
169.
83
Paraphrase This Document
Need a fresh take? Get an instant paraphrase of this document with our AI Paraphraser
ECONOMICS 4
Answer 2
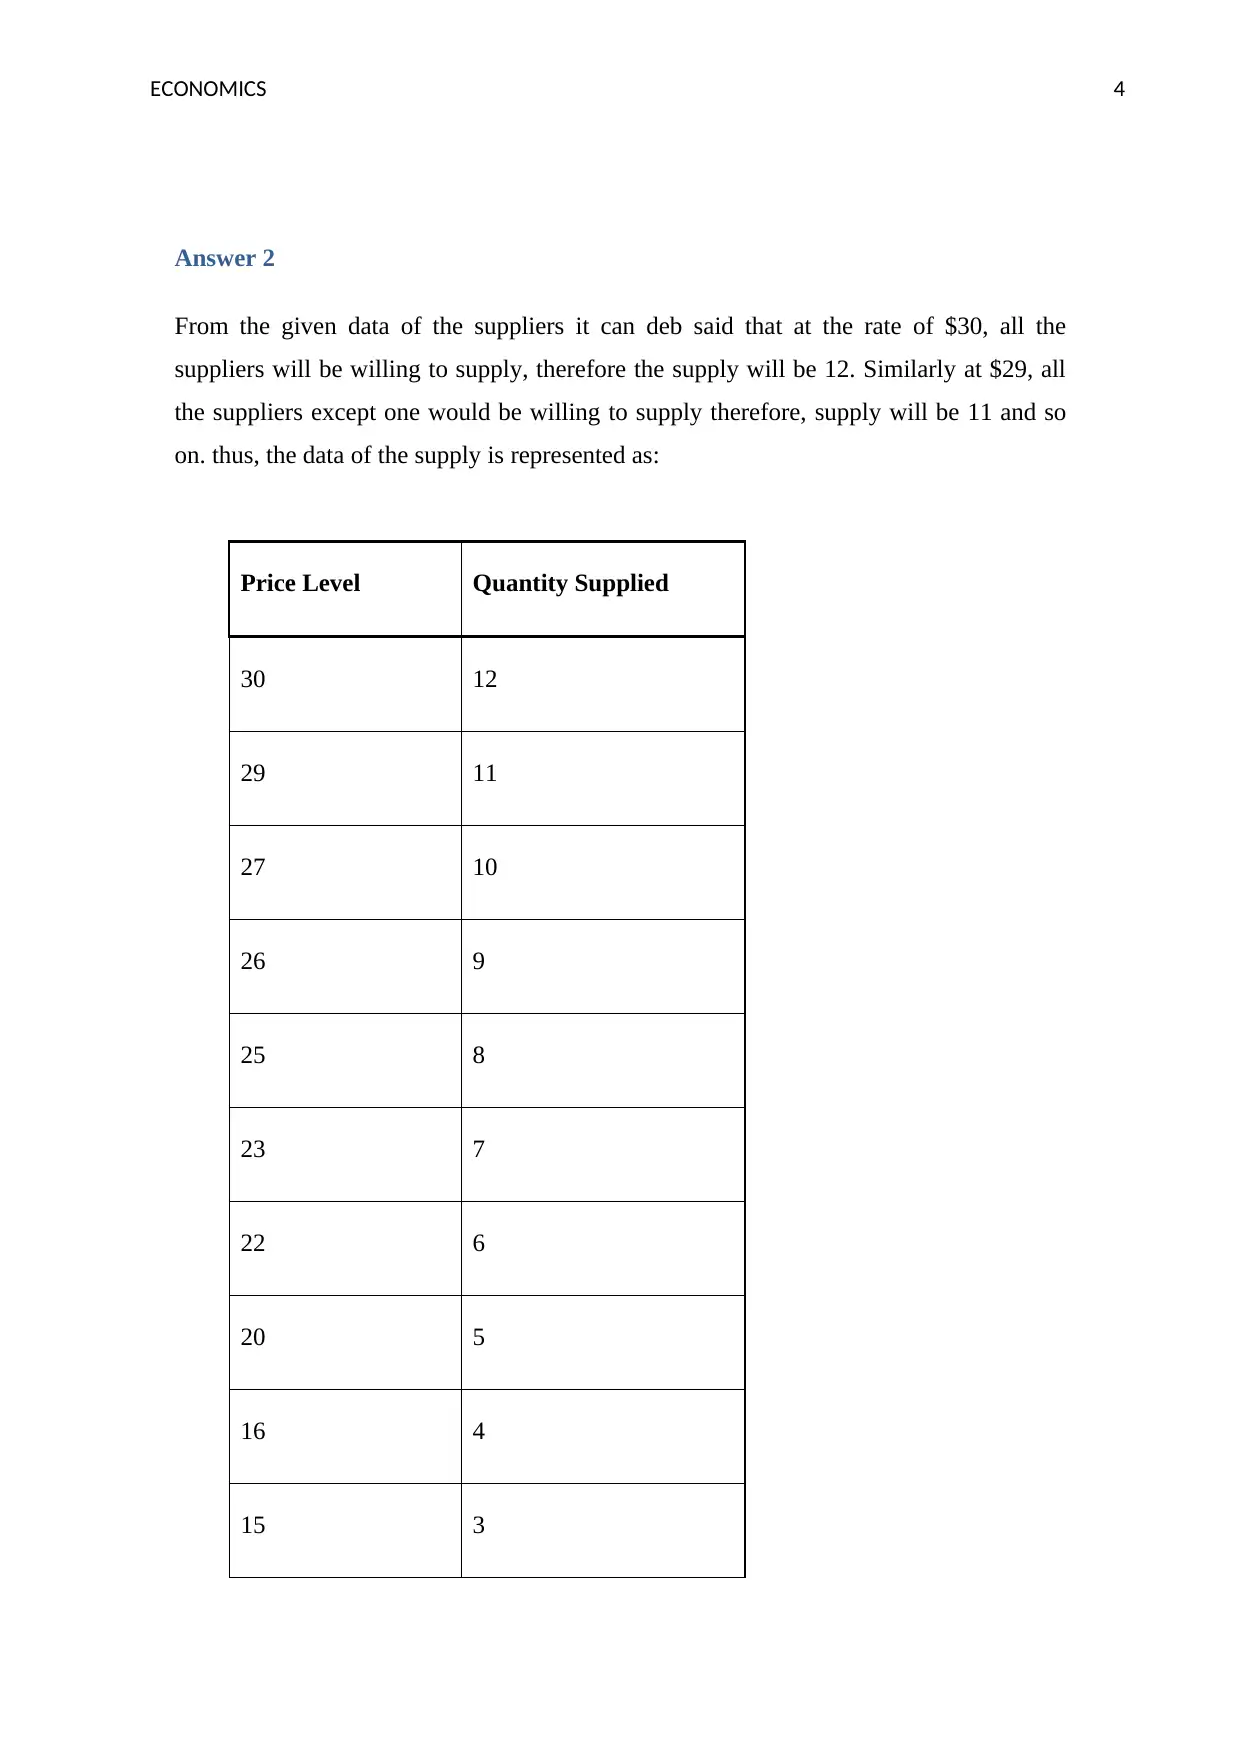
From the given data of the suppliers it can deb said that at the rate of $30, all the
suppliers will be willing to supply, therefore the supply will be 12. Similarly at $29, all
the suppliers except one would be willing to supply therefore, supply will be 11 and so
on. thus, the data of the supply is represented as:
Price Level Quantity Supplied
30 12
29 11
27 10
26 9
25 8
23 7
22 6
20 5
16 4
15 3
Answer 2
From the given data of the suppliers it can deb said that at the rate of $30, all the
suppliers will be willing to supply, therefore the supply will be 12. Similarly at $29, all
the suppliers except one would be willing to supply therefore, supply will be 11 and so
on. thus, the data of the supply is represented as:
Price Level Quantity Supplied
30 12
29 11
27 10
26 9
25 8
23 7
22 6
20 5
16 4
15 3
ECONOMICS 5
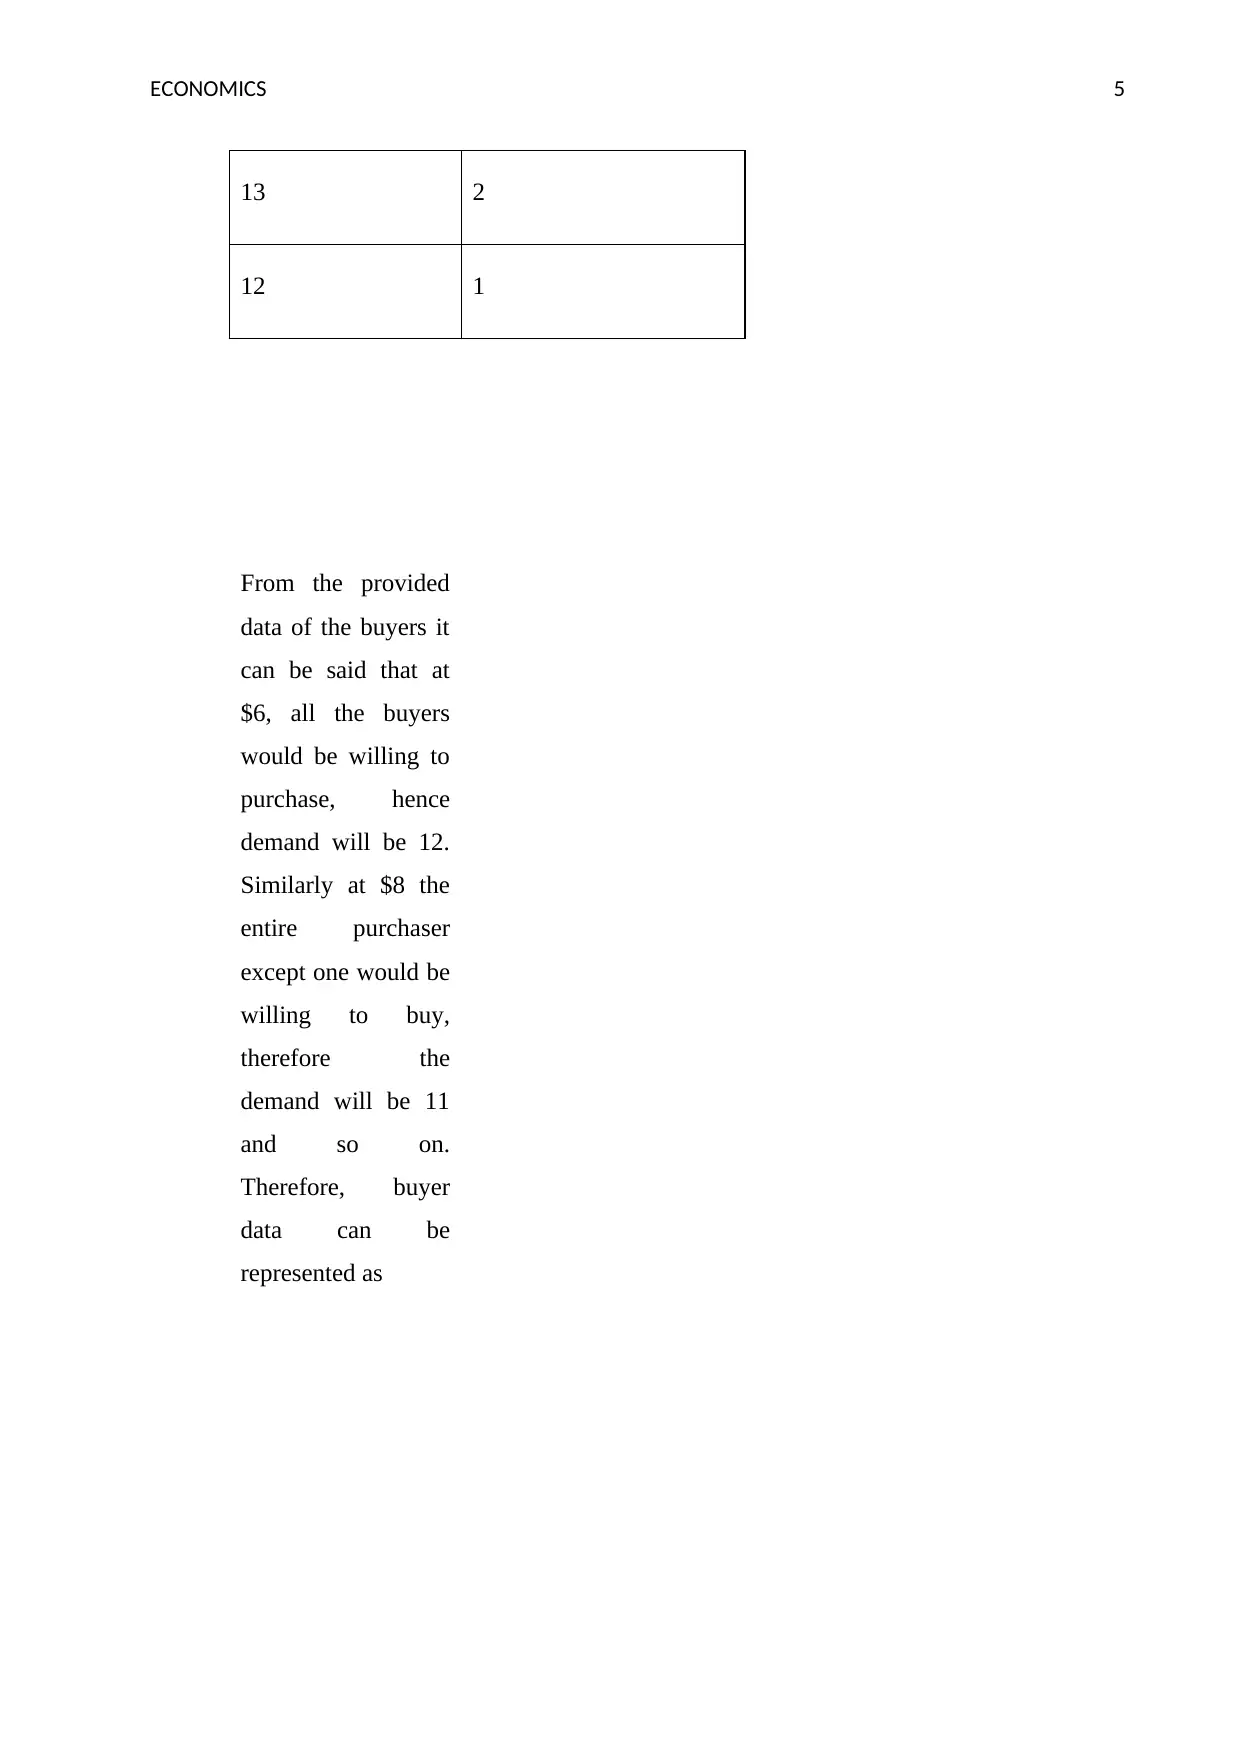
13 2
12 1
From the provided
data of the buyers it
can be said that at
$6, all the buyers
would be willing to
purchase, hence
demand will be 12.
Similarly at $8 the
entire purchaser
except one would be
willing to buy,
therefore the
demand will be 11
and so on.
Therefore, buyer
data can be
represented as
⊘ This is a preview!⊘
Do you want full access?
Subscribe today to unlock all pages.
Trusted by 1+ million students worldwide
ECONOMICS 6
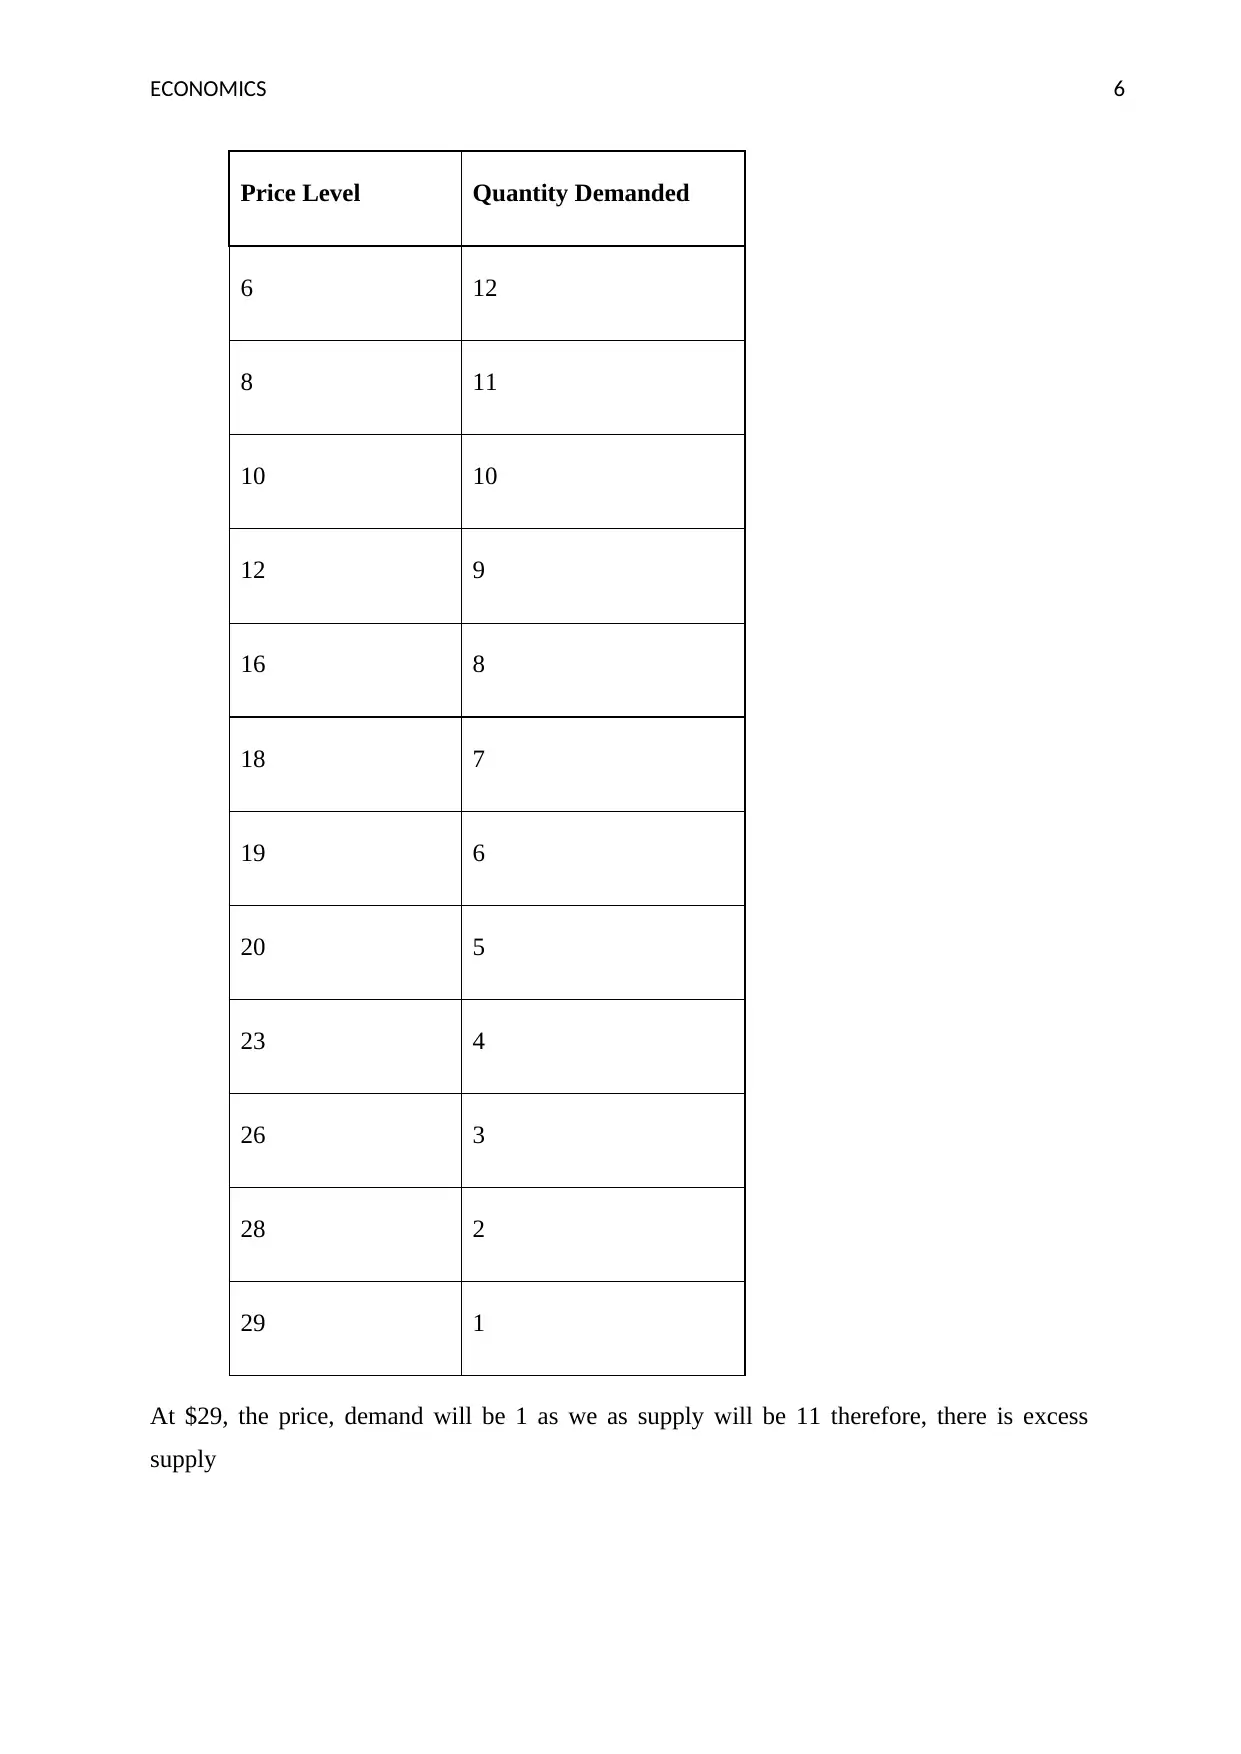
Price Level Quantity Demanded
6 12
8 11
10 10
12 9
16 8
18 7
19 6
20 5
23 4
26 3
28 2
29 1
At $29, the price, demand will be 1 as we as supply will be 11 therefore, there is excess
supply
Price Level Quantity Demanded
6 12
8 11
10 10
12 9
16 8
18 7
19 6
20 5
23 4
26 3
28 2
29 1
At $29, the price, demand will be 1 as we as supply will be 11 therefore, there is excess
supply
Paraphrase This Document
Need a fresh take? Get an instant paraphrase of this document with our AI Paraphraser
ECONOMICS 7
Answer 3
Valentine’s Day is day associated with celebration of love and romance. Valentine’s Day
witness boom in sale of chocolate, teddy bears, greeting cards and roses. The price of roses
increases like anything on Valentine’s Day and crosses the price of greeting cards which are
considered more costly than roses on general days. The prominent reason behind this is the
supply of roses. As roses is a natural product which is generally limited in supply as it is
extracted from trees. Unlike roses, greeting cards are made up from paper which is
manufactured from wood. Paper is artificial product and demand of paper meets supply.
Therefore the prices of greeting cards remain stable at any given point in time. But talking
about roses all depends on supply and demand chain. Whenever there is huge demand of
roses generally during wedding season and the month of February i.e. around Valentine’s
Day on February 14 the prices go up and down. On general days the price of rose stays
around 4$ or 5$, but during the boom it goes to 15$ or 20$ a rose. On the other side,
generally during off-peak season the prices stay very low as the demand is very less as
compared to supply and roses are easily available with the florist in any quantity. Price is
determined by demand and supply. Demand for roses increases which results in reduction of
demand for greeting cards. Therefore the price of greeting cards dips. It is a game of demand
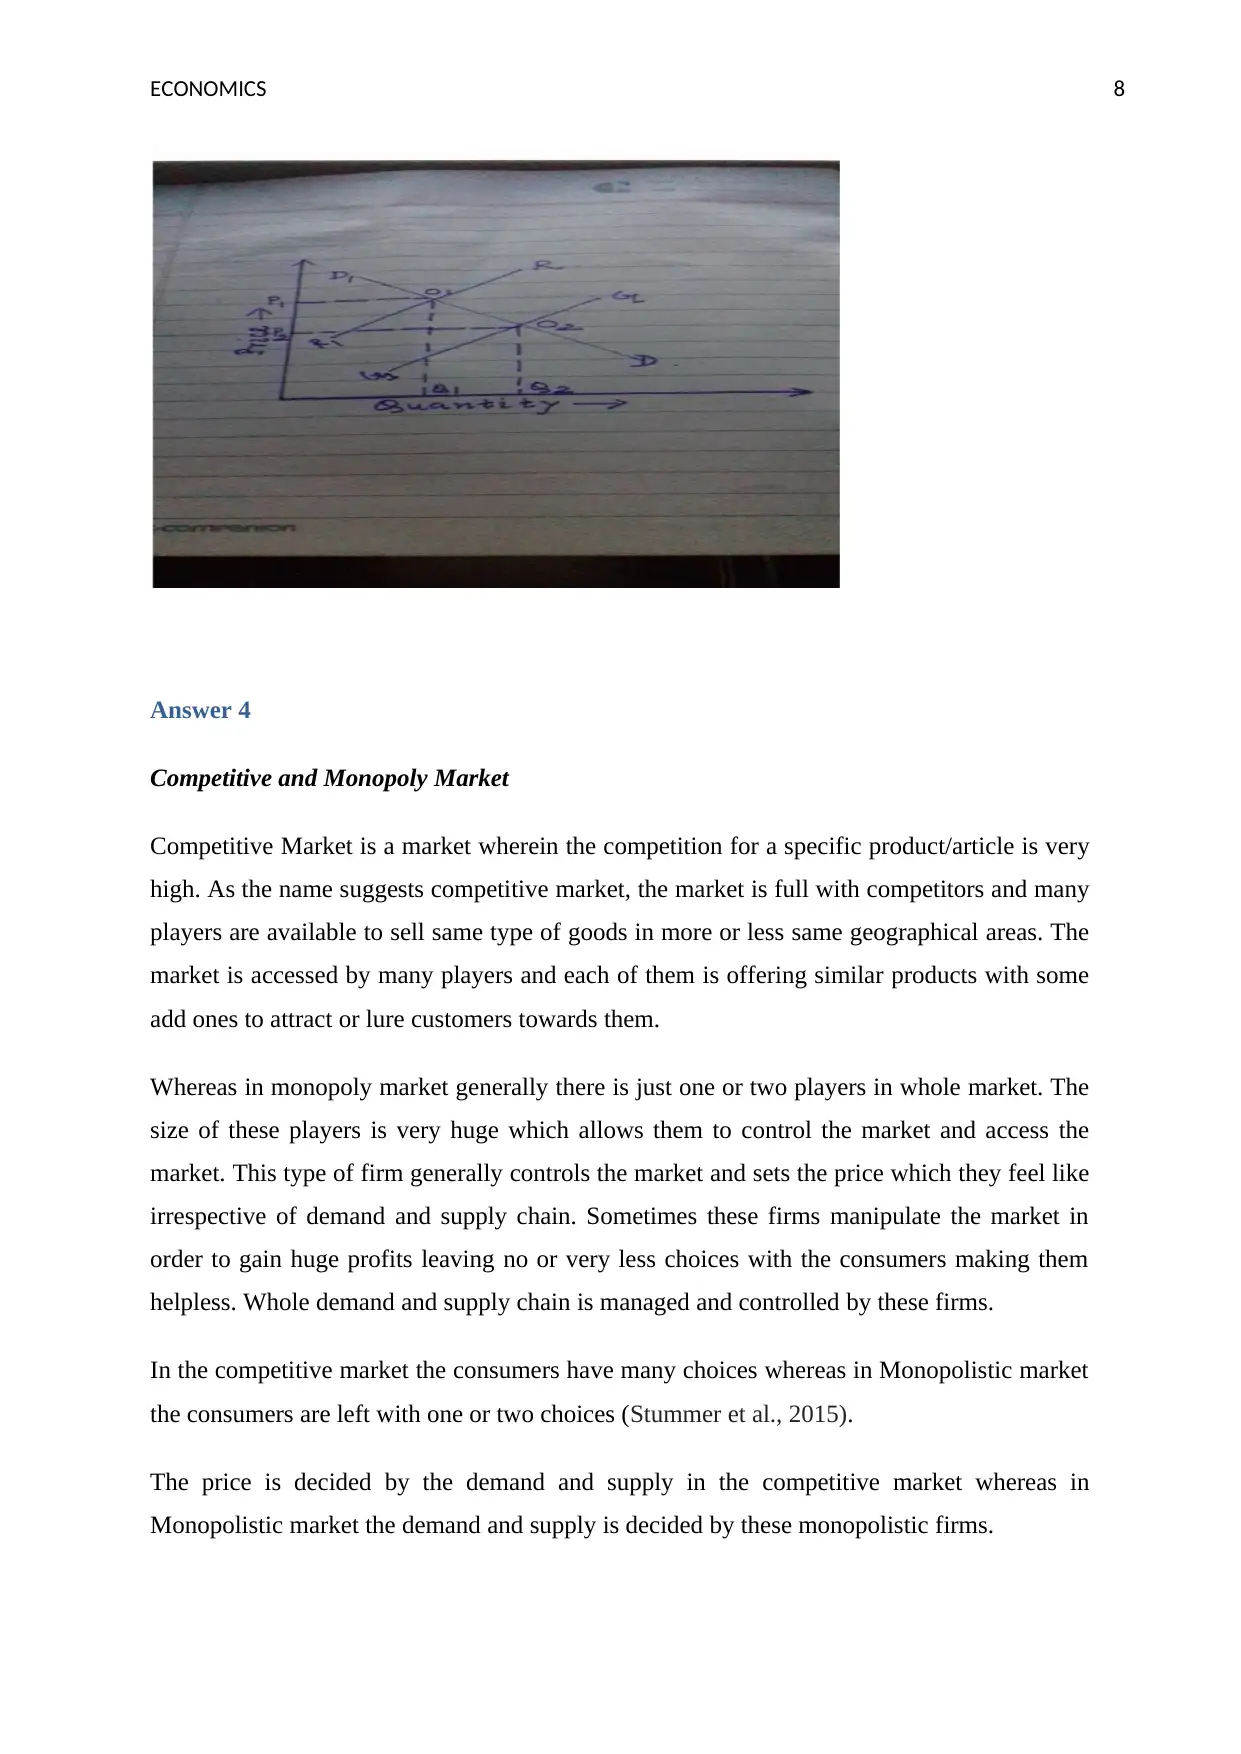
and supply. It is also represented by following graph.
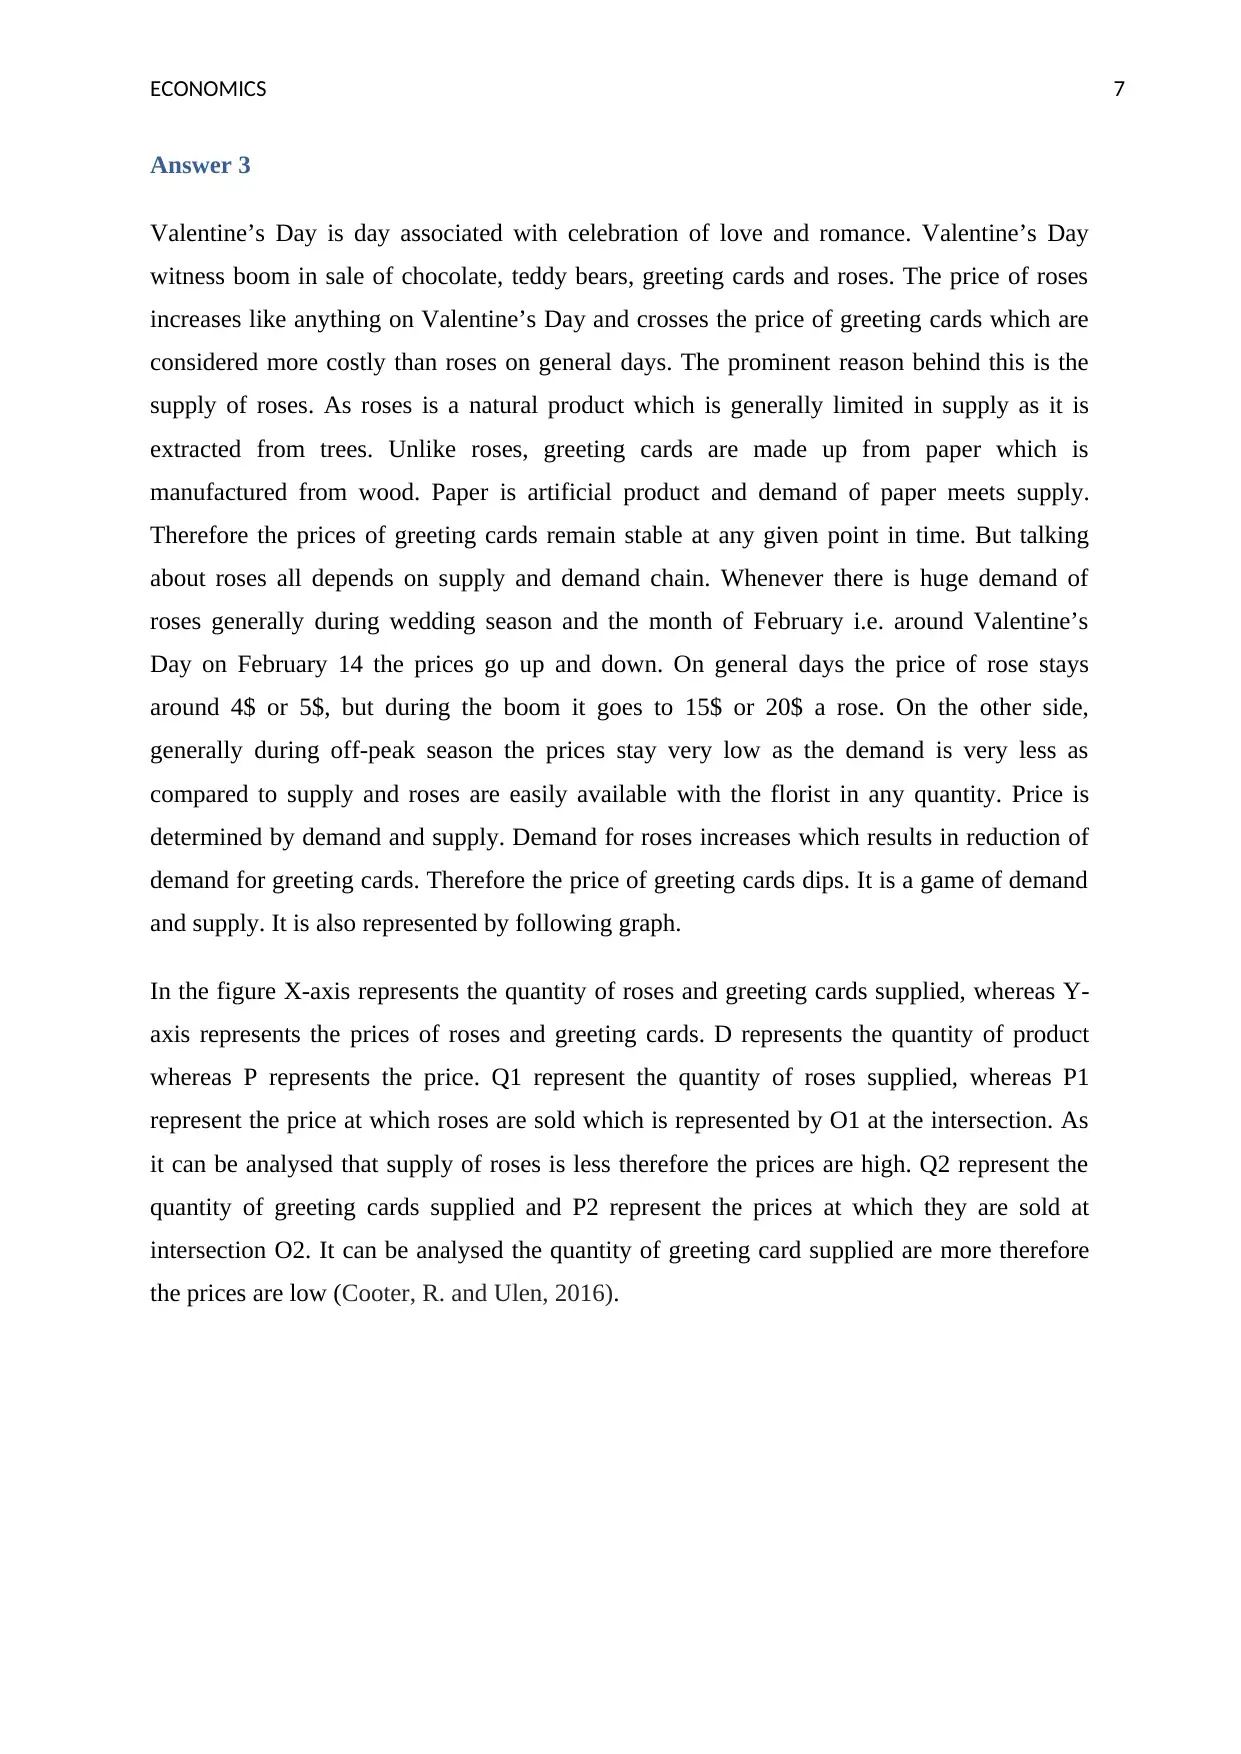
In the figure X-axis represents the quantity of roses and greeting cards supplied, whereas Y-
axis represents the prices of roses and greeting cards. D represents the quantity of product
whereas P represents the price. Q1 represent the quantity of roses supplied, whereas P1
represent the price at which roses are sold which is represented by O1 at the intersection. As
it can be analysed that supply of roses is less therefore the prices are high. Q2 represent the
quantity of greeting cards supplied and P2 represent the prices at which they are sold at
intersection O2. It can be analysed the quantity of greeting card supplied are more therefore
the prices are low (Cooter, R. and Ulen, 2016).
Answer 3
Valentine’s Day is day associated with celebration of love and romance. Valentine’s Day
witness boom in sale of chocolate, teddy bears, greeting cards and roses. The price of roses
increases like anything on Valentine’s Day and crosses the price of greeting cards which are
considered more costly than roses on general days. The prominent reason behind this is the
supply of roses. As roses is a natural product which is generally limited in supply as it is
extracted from trees. Unlike roses, greeting cards are made up from paper which is
manufactured from wood. Paper is artificial product and demand of paper meets supply.
Therefore the prices of greeting cards remain stable at any given point in time. But talking
about roses all depends on supply and demand chain. Whenever there is huge demand of
roses generally during wedding season and the month of February i.e. around Valentine’s
Day on February 14 the prices go up and down. On general days the price of rose stays
around 4$ or 5$, but during the boom it goes to 15$ or 20$ a rose. On the other side,
generally during off-peak season the prices stay very low as the demand is very less as
compared to supply and roses are easily available with the florist in any quantity. Price is
determined by demand and supply. Demand for roses increases which results in reduction of
demand for greeting cards. Therefore the price of greeting cards dips. It is a game of demand
and supply. It is also represented by following graph.
In the figure X-axis represents the quantity of roses and greeting cards supplied, whereas Y-
axis represents the prices of roses and greeting cards. D represents the quantity of product
whereas P represents the price. Q1 represent the quantity of roses supplied, whereas P1
represent the price at which roses are sold which is represented by O1 at the intersection. As
it can be analysed that supply of roses is less therefore the prices are high. Q2 represent the
quantity of greeting cards supplied and P2 represent the prices at which they are sold at
intersection O2. It can be analysed the quantity of greeting card supplied are more therefore
the prices are low (Cooter, R. and Ulen, 2016).
ECONOMICS 8
Answer 4
Competitive and Monopoly Market
Competitive Market is a market wherein the competition for a specific product/article is very
high. As the name suggests competitive market, the market is full with competitors and many
players are available to sell same type of goods in more or less same geographical areas. The
market is accessed by many players and each of them is offering similar products with some
add ones to attract or lure customers towards them.
Whereas in monopoly market generally there is just one or two players in whole market. The
size of these players is very huge which allows them to control the market and access the
market. This type of firm generally controls the market and sets the price which they feel like
irrespective of demand and supply chain. Sometimes these firms manipulate the market in
order to gain huge profits leaving no or very less choices with the consumers making them
helpless. Whole demand and supply chain is managed and controlled by these firms.
In the competitive market the consumers have many choices whereas in Monopolistic market
the consumers are left with one or two choices (Stummer et al., 2015).
The price is decided by the demand and supply in the competitive market whereas in
Monopolistic market the demand and supply is decided by these monopolistic firms.
⊘ This is a preview!⊘
Do you want full access?
Subscribe today to unlock all pages.
Trusted by 1+ million students worldwide
ECONOMICS 9
The market control is more or less equally distributed in the competitive market, whereas in
the Monopolistic market the distribution is very less.
Sometimes in monopolistic market the quality of goods and articles are intentionally kept
very low as the consumers have no or very less choice, therefore no option left with them
other than to purchase the product. Whereas in competitive market the quality is generally
kept good as if one supplier doesn’t provide them with good quality the consumer will
naturally shift to next supplier.
Competitive market is essential for any market as prices are kept stable as per requirement
whereas in monopolistic market it sometimes leads to harassment of general public.
Also the entry barriers are generally high in monopolistic market and only few players can
enter and set up his/her business against a well settled monopolistic business. But in the
competitive market the entry barriers are low or none as anyone can set up business in order
to gain profit.
Talking about market share, in monopolistic market the market share of the firm is generally
100% or 50% approx. whereas in competitive market the market share ranges around 5-10%
and so on.
Talking about elasticity in the market, the competitive market has more elasticity as
compared to monopolistic market. The main reason behind it is that all goods/services in the
market are substitutable to each other and the demand curve is perfectly elastic but in a
monopoly market the demand curve is downward slopping (Parenti, Ushchev and Thisse,
2017).
Answer 5
The Mining Strategy
Mining is very important for any economy. Mining involves extraction of coal, gold, silver
and many other metals from the ground. Coal is needed for producing or manufacturing of
electricity. Counties which are coal rich have the facility of producing as much as electricity
to meet the demands of public. Arab Countries like Saudi Arabia, Venezuela, Qatar, and
United Arab of Emirates are oil rich countries. They have lakhs and lakhs tonnes of oil stored
Paraphrase This Document
Need a fresh take? Get an instant paraphrase of this document with our AI Paraphraser
ECONOMICS 10
with them which they export across the world. The main sources of earning for these
countries are selling oil.
It’s the duty of the Government to promote the exploration of mines and promote mining
activity at big level. The government boost is much needed for the companies to come up and
take the activity like mining. Prima facie the mining activity looks unprofitable therefore
companies are reluctant to come up.
Government shall appropriately fund these private or governmental companies at different-
different stages. They should open mining sector for private companies if not opened so far.
Private sector comes up with more energy to start a new venture and in turn they bring in
more and more efficiency and effectiveness.
Also the time taken to begin such activity shall be reduced. As government department takes
lot of time to grant approval even for petty work which discourages the private sector to take
part. Bureaucratic delays shall be turned into invitation with open hands so that people start
thinking about business in mining sector.
The taxes rates shall also need to be brought down and more and more tax subsidies shall be
given to encourage. Focus of government shall be on how they can motivate companies or
firms to produce maximum at low cost (Eyal, and Sirer, 2018).
Answer 6
Impact of appreciation of Australian Dollar on:
Part A
1. Export of Australian Goods
If it is required to be summed up in one word then it can be analysed that the export
will naturally reduce. The prominent reason for this is the price. As the Australian
dollar appreciates the export will get expensive for the traders and businesses.
Resultant traders or businesses in Australia will start importing those products from
outside. They would prefer those countries which have lower exchange rate with
Australia in turn it will reduce the exports.
2. Price level of imported Goods
ECONOMICS 11
The price level of imported goods will naturally reduce because when the currency of
any country appreciates or improves as against the fellow markets imports will
naturally get cheaper. The true essence of this is that the currency of Australia can buy
more and more of foreign currency which will ultimately lead to reduction in prices of
imported goods which increases the imported goods in home market.
3. Tourism in Australia
As already discussed above, this will also follow the footstep of them. The tourism
will go down. The appreciation in the value of Australian dollar means that lowering
down the value of foreign currency. The people coming from other countries will
have to shell out more in order to buy more and more for example products like
clothes, watches etc. This will lead to discouragement amongst the people to go
Australia and which ultimately leads to slow growth of tourism sector (Manalo,
Perera, and Rees, 2015).
Part B
Revenues of subsidiaries in Japan earning profit in Yen
The main effect of appreciation in Australian Dollar have here is that the revenues of
subsidiaries will decline. It can be better understand by the help of example which is
illustrated below:
Assuming Current currency rate as
1 AUS = 72 Japanese Yen
Post appreciation of Australian Dollar, current rate is 1 AUS = 75 Japanese Yen.
Firm earned profit of 1,000 Japanese yen per annum. Before appreciation of Australian dollar
the profit was 1,000/72 = 13.88 AUS. Whereas post appreciation it comes to 1,000/75 =
13.33 AUS. Hence we can see drop in profit level and margin post appreciation of Australian
dollar. As the home currency appreciates the profit level will come down in the same
proportion (Fujiwara and Ogawa, 2016).
⊘ This is a preview!⊘
Do you want full access?
Subscribe today to unlock all pages.
Trusted by 1+ million students worldwide
1 out of 14
Related Documents


Your All-in-One AI-Powered Toolkit for Academic Success.
+13062052269
info@desklib.com
Available 24*7 on WhatsApp / Email
![[object Object]](/_next/static/media/star-bottom.7253800d.svg)
Unlock your academic potential
Copyright © 2020–2026 A2Z Services. All Rights Reserved. Developed and managed by ZUCOL.