BUS502 Principles of Economics for Accountants: Soda Tax Analysis
VerifiedAdded on 2023/03/20
|4
|779
|93
Homework Assignment
AI Summary
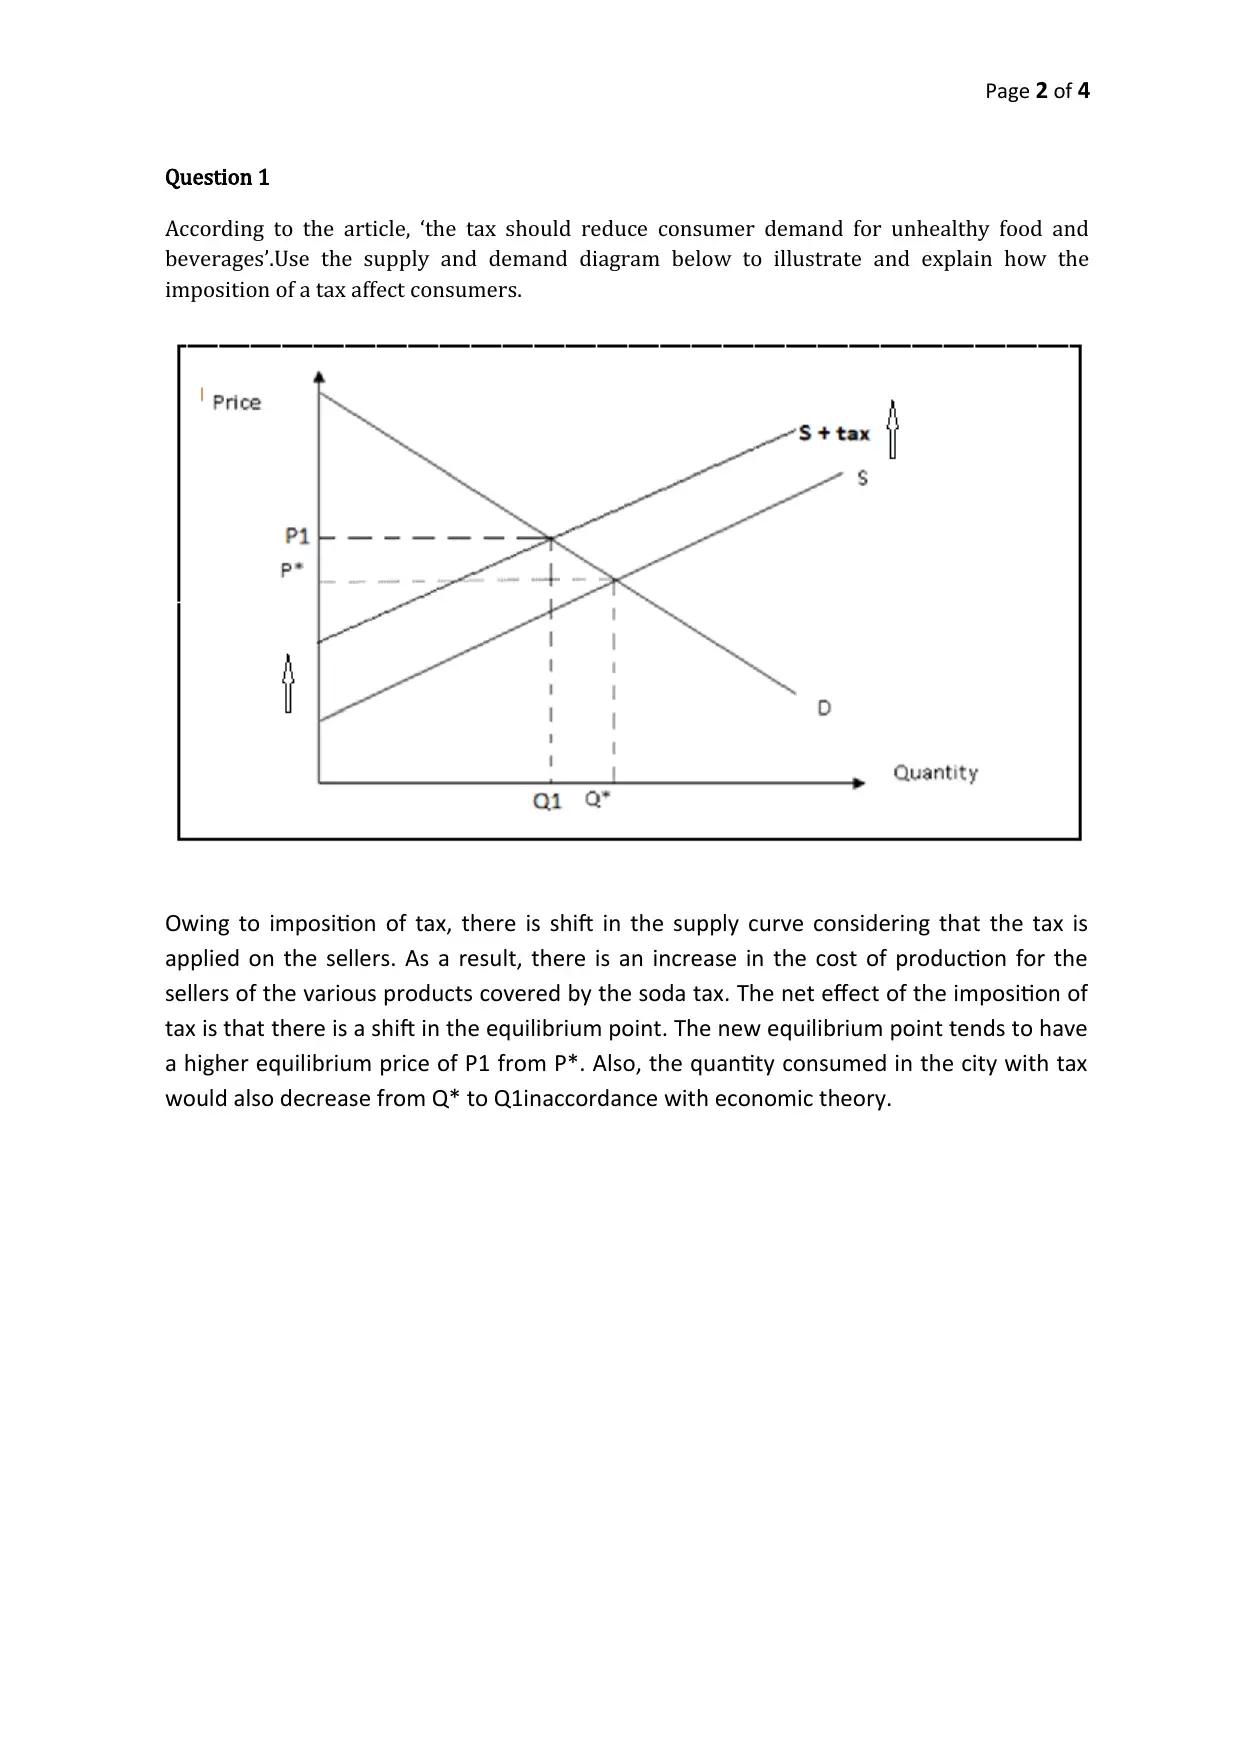
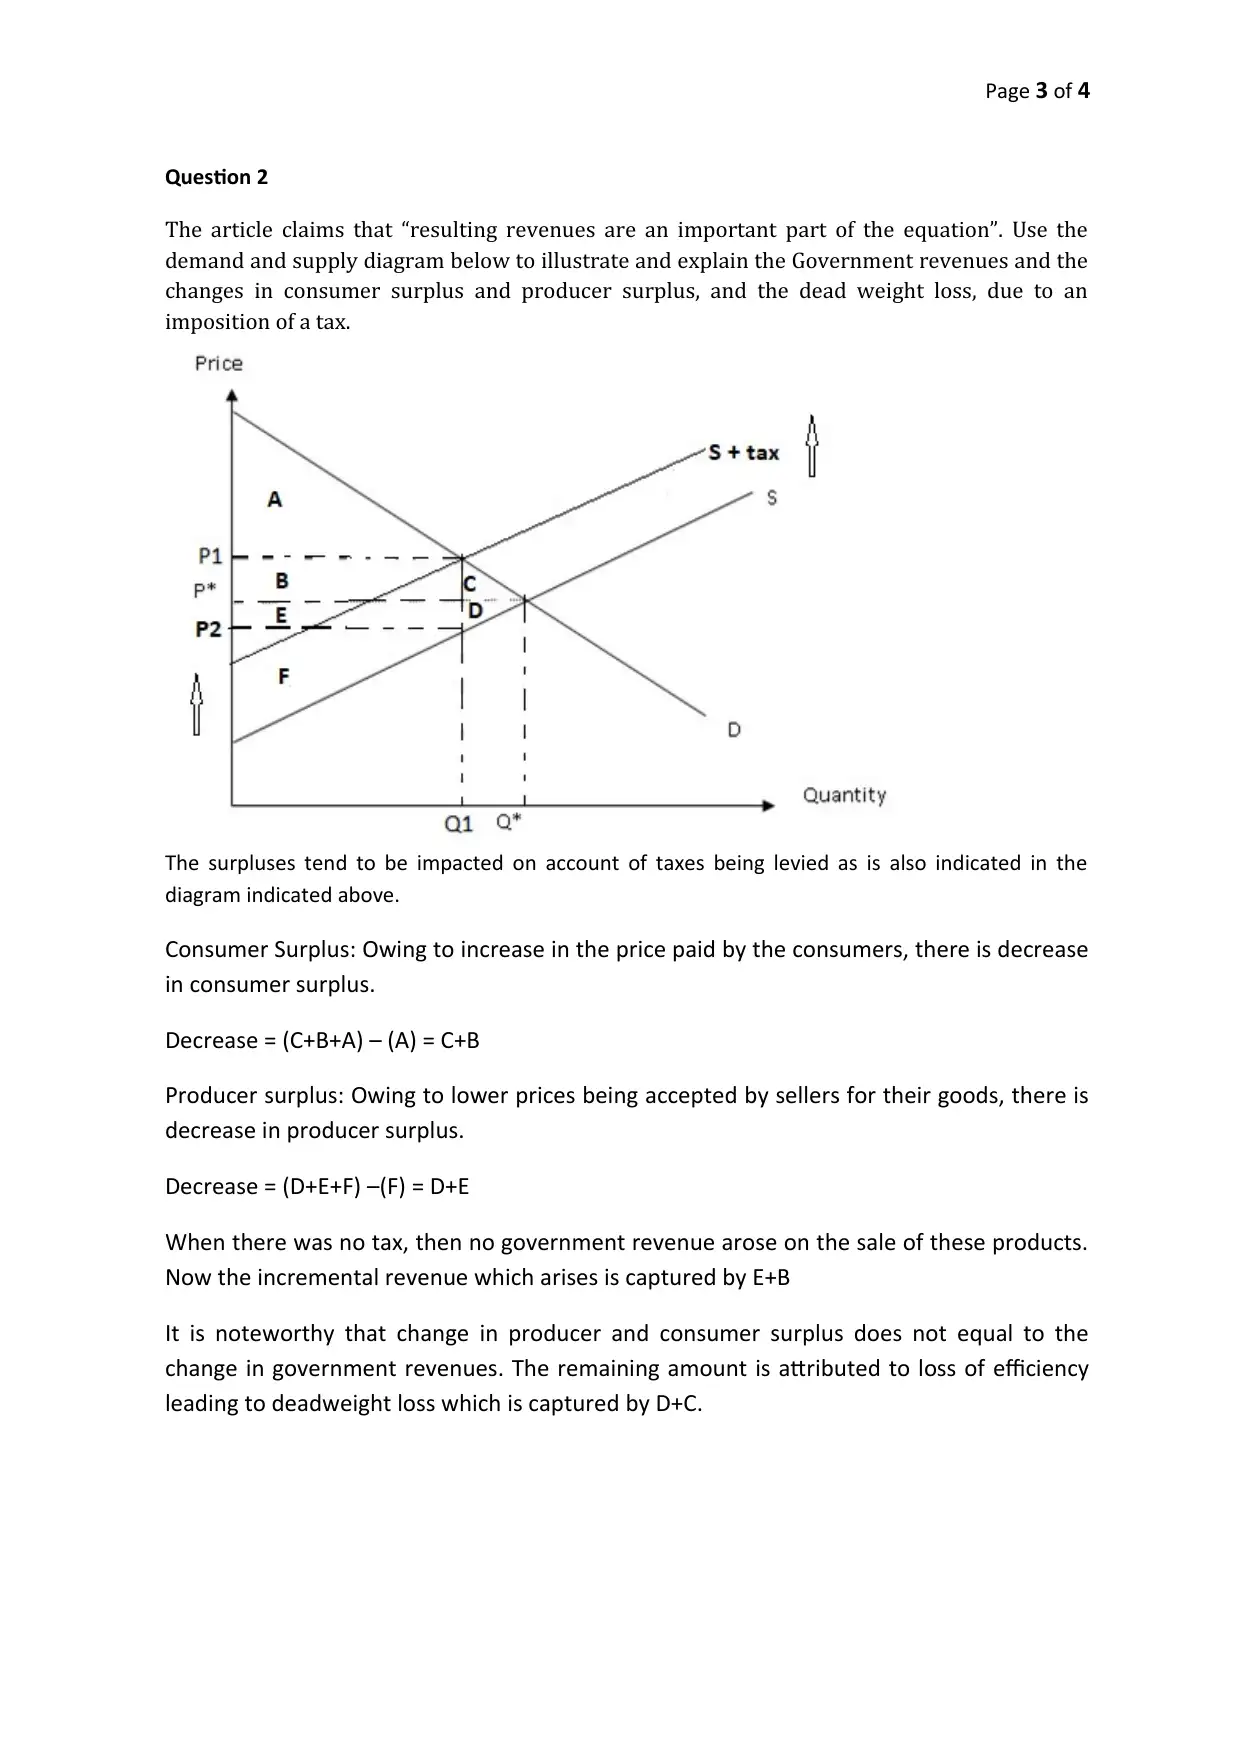
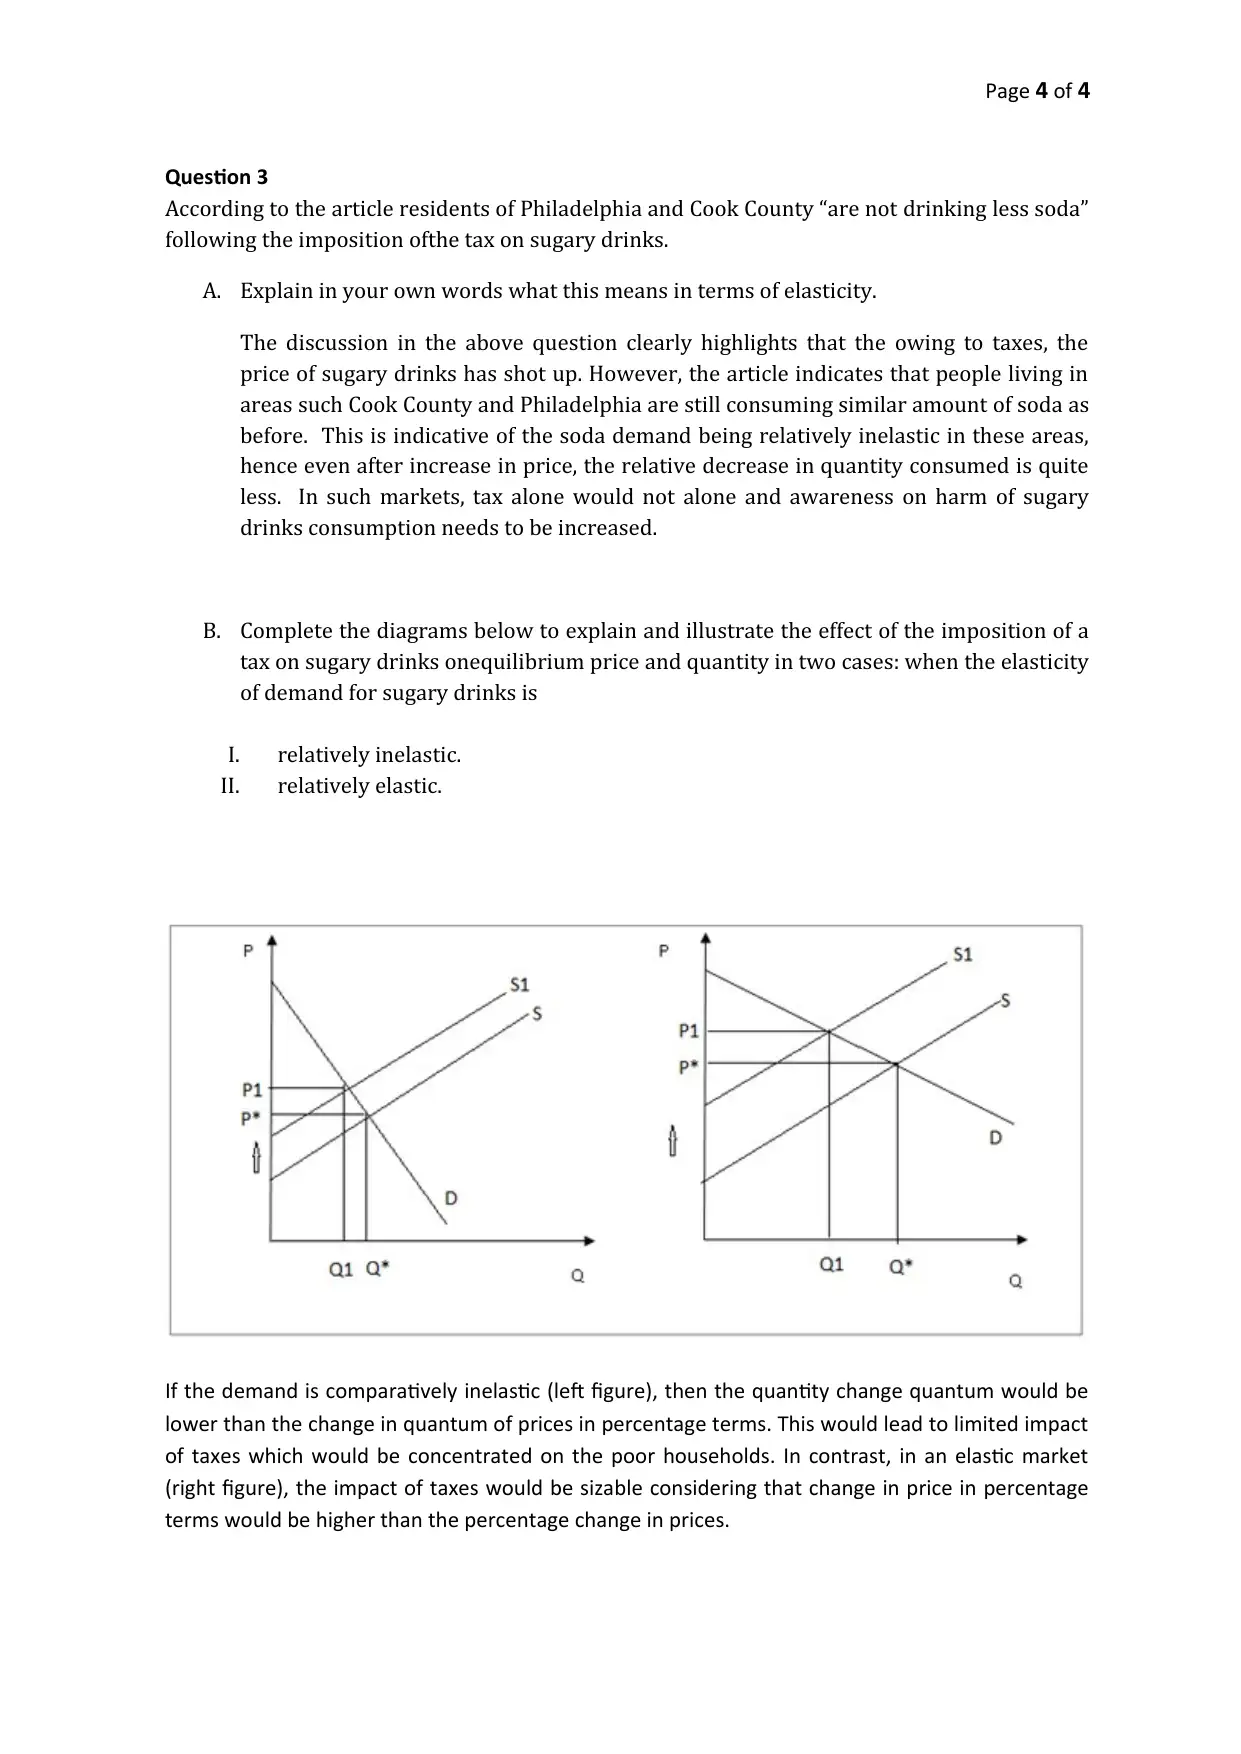
This assignment analyzes the economic impacts of a soda tax, using the article "What is the Soda Tax and which cities have one" by Beverly Bird. The student uses supply and demand diagrams to illustrate how the tax affects consumers, leading to a shift in the supply curve and a new equilibri...
Read More
Contribute Materials
Your contribution can guide someone’s learning journey. Share your
documents today.

Page 1 of 4
ATMC BUS502 Principles of Economics for Accountants
Assessment Task 2 – Responses to articles
Article 2: DUE via Safe Assign 6pm Saturday 12th May
Full Name: Nikita Nikhil Chauhan
Student number: 1123144
Tutor’s name: Monjurul Hoque
Article Title:
“
What is the Soda Tax and which cities have one”by Beverly Birdfrom The Balance from 25th
November 2018. Available at:
https://www.thebalance.com/soda-tax-and-which-cities-have-one-4151209
Instructions:
Access the article at the URL given above and read it carefully. Answer the questions and
complete the diagrams in the spaces provided below. Use full sentences. If you use any
references, please list at least the URL of your source. Possible total for this assessment task is
15 marks.
Secure Best Marks with AI Grader
Need help grading? Try our AI Grader for instant feedback on your assignments.

Page 2 of 4
Question 1
According to the article, ‘the tax should reduce consumer demand for unhealthy food and
beverages’.Use the supply and demand diagram below to illustrate and explain how the
imposition of a tax affect consumers.
Owing to imposition of tax, there is shift in the supply curve considering that the tax is
applied on the sellers. As a result, there is an increase in the cost of production for the
sellers of the various products covered by the soda tax. The net effect of the imposition of
tax is that there is a shift in the equilibrium point. The new equilibrium point tends to have
a higher equilibrium price of P1 from P*. Also, the quantity consumed in the city with tax
would also decrease from Q* to Q1inaccordance with economic theory.

Page 3 of 4
Question 2
The article claims that “resulting revenues are an important part of the equation”. Use the
demand and supply diagram below to illustrate and explain the Government revenues and the
changes in consumer surplus and producer surplus, and the dead weight loss, due to an
imposition of a tax.
The surpluses tend to be impacted on account of taxes being levied as is also indicated in the
diagram indicated above.
Consumer Surplus: Owing to increase in the price paid by the consumers, there is decrease
in consumer surplus.
Decrease = (C+B+A) – (A) = C+B
Producer surplus: Owing to lower prices being accepted by sellers for their goods, there is
decrease in producer surplus.
Decrease = (D+E+F) –(F) = D+E
When there was no tax, then no government revenue arose on the sale of these products.
Now the incremental revenue which arises is captured by E+B
It is noteworthy that change in producer and consumer surplus does not equal to the
change in government revenues. The remaining amount is attributed to loss of efficiency
leading to deadweight loss which is captured by D+C.

Page 4 of 4
Question 3
According to the article residents of Philadelphia and Cook County “are not drinking less soda”
following the imposition ofthe tax on sugary drinks.
A. Explain in your own words what this means in terms of elasticity.
The discussion in the above question clearly highlights that the owing to taxes, the
price of sugary drinks has shot up. However, the article indicates that people living in
areas such Cook County and Philadelphia are still consuming similar amount of soda as
before. This is indicative of the soda demand being relatively inelastic in these areas,
hence even after increase in price, the relative decrease in quantity consumed is quite
less. In such markets, tax alone would not alone and awareness on harm of sugary
drinks consumption needs to be increased.
B. Complete the diagrams below to explain and illustrate the effect of the imposition of a
tax on sugary drinks onequilibrium price and quantity in two cases: when the elasticity
of demand for sugary drinks is
I. relatively inelastic.
II. relatively elastic.
If the demand is comparatively inelastic (left figure), then the quantity change quantum would be
lower than the change in quantum of prices in percentage terms. This would lead to limited impact
of taxes which would be concentrated on the poor households. In contrast, in an elastic market
(right figure), the impact of taxes would be sizable considering that change in price in percentage
terms would be higher than the percentage change in prices.
1 out of 4
Related Documents

Your All-in-One AI-Powered Toolkit for Academic Success.
+13062052269
info@desklib.com
Available 24*7 on WhatsApp / Email
Unlock your academic potential
© 2024 | Zucol Services PVT LTD | All rights reserved.