Economics Assignment: Analysis of Sugar Tax in Mexico - Course ID
VerifiedAdded on 2022/09/22
|10
|984
|14
Homework Assignment
AI Summary
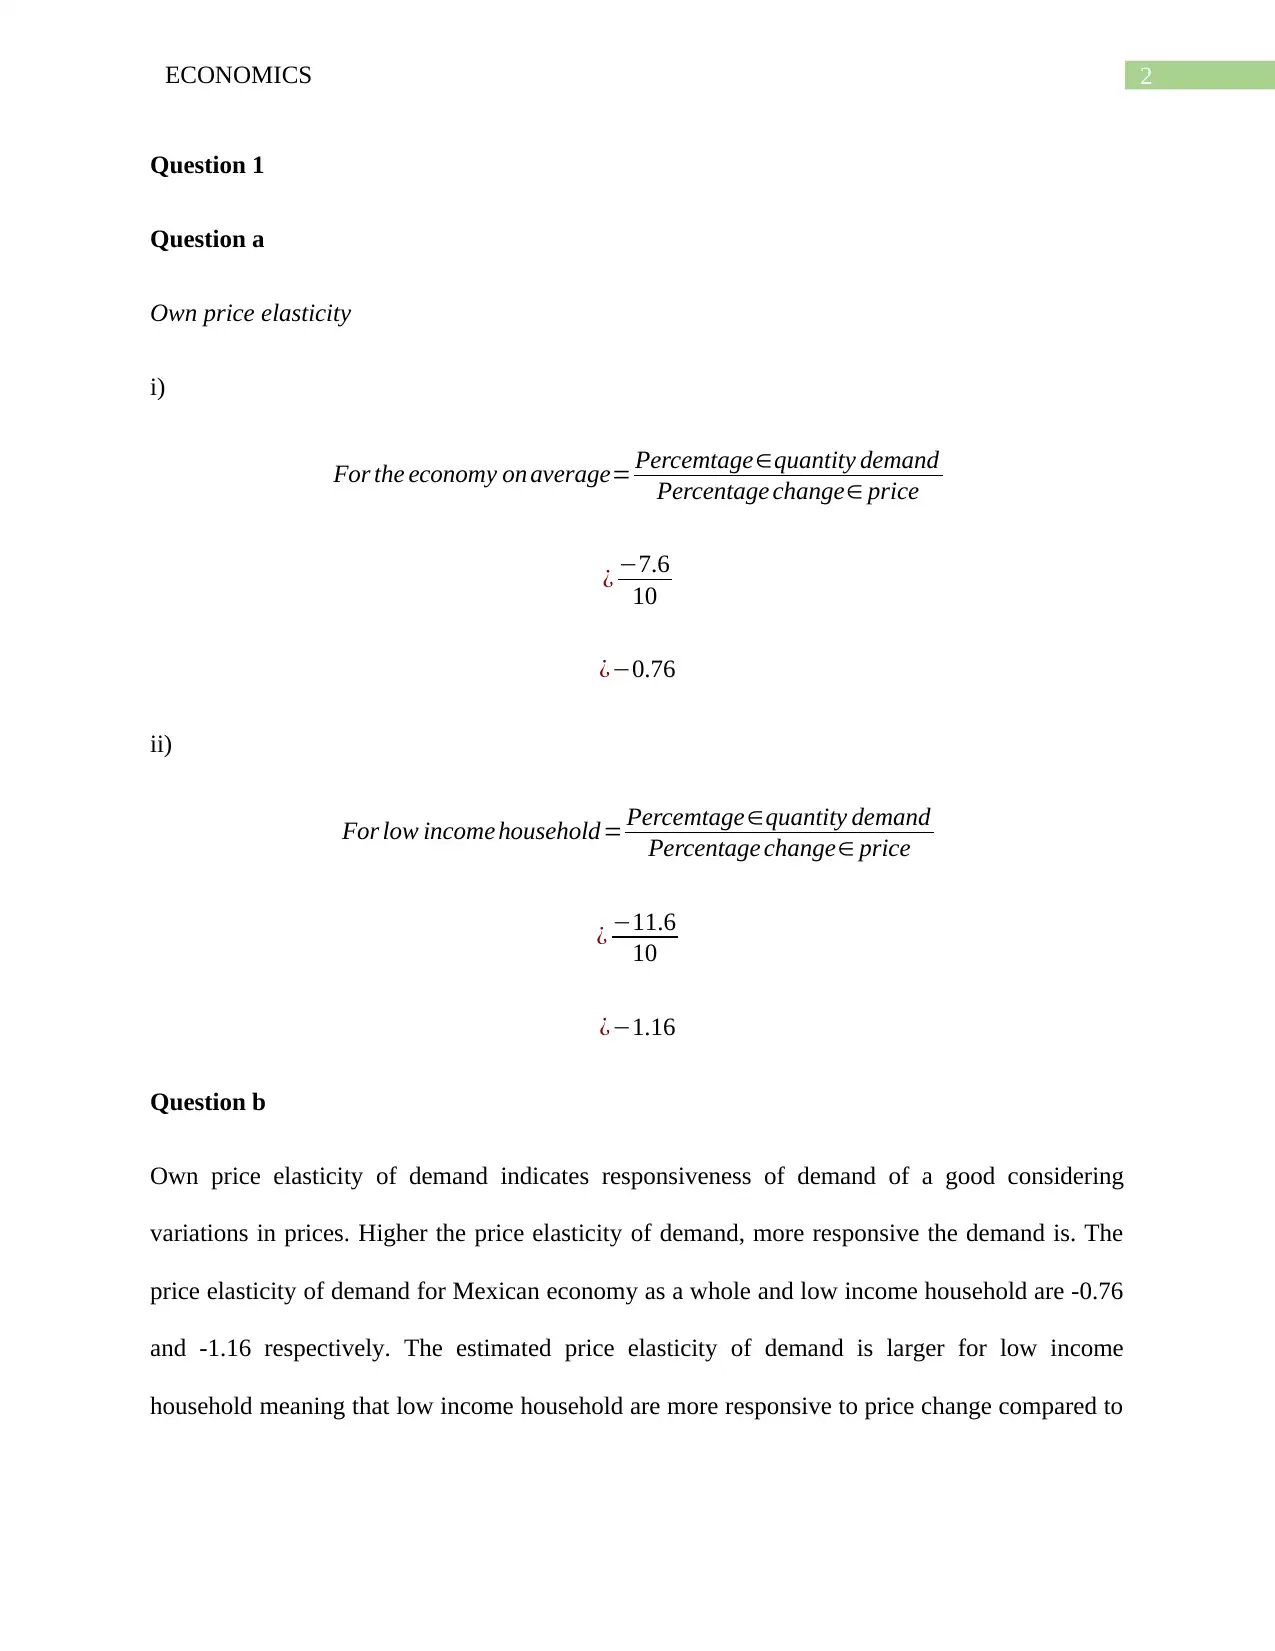
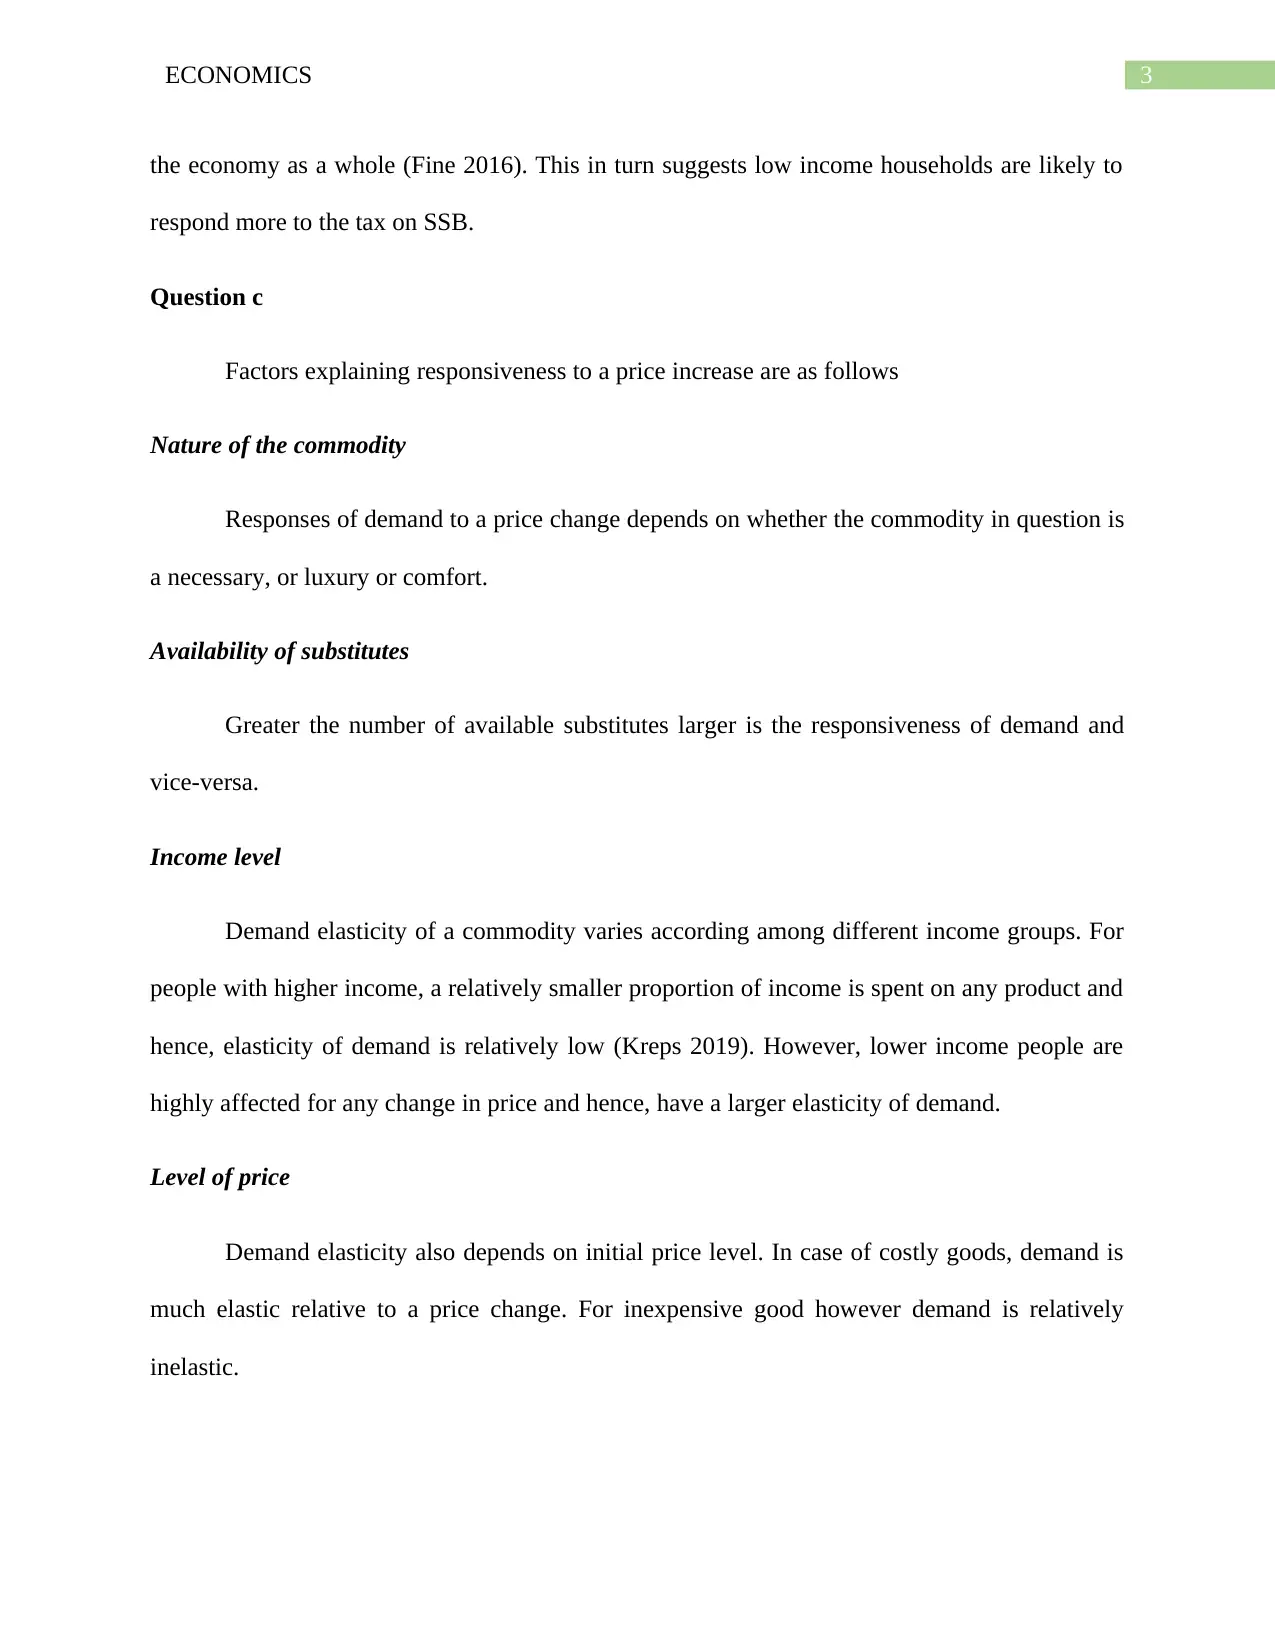
This economics assignment analyzes the impact of a sugar tax implemented in Mexico. The assignment begins by calculating the own price elasticity of demand for sugar-sweetened beverages (SSBs) for both the overall economy and low-income households, based on provided consumption data. It then compares the responsiveness of these two groups to the tax, identifying which group is more affected by price changes. The analysis further explores the factors determining responsiveness to price increases, explaining the differences in elasticity estimates. The cross-price elasticity between SSBs and bottled water is calculated to assess the relationship between these goods. The assignment incorporates graphical representations of the SSB market, illustrating the effects of the tax and a social awareness campaign on market equilibrium, including price, quantity, and tax revenue. Finally, it compares the effects of the tax and the awareness campaign, both individually and in combination, on SSB consumption, concluding that a combined approach would yield the greatest reduction in consumption.

Running head: ECONOMICS
Economics
Name of the Student
Name of the University
Course ID
Economics
Name of the Student
Name of the University
Course ID
Paraphrase This Document
Need a fresh take? Get an instant paraphrase of this document with our AI Paraphraser

1ECONOMICS
Table of Contents
Question 1........................................................................................................................................2
Question a....................................................................................................................................2
Question b....................................................................................................................................2
Question c....................................................................................................................................3
Question d....................................................................................................................................4
Question e....................................................................................................................................5
Question f.....................................................................................................................................6
Question g....................................................................................................................................7
References........................................................................................................................................9

2ECONOMICS
Question 1
Question a
Own price elasticity
i)
For the economy on average= Percemtage∈quantity demand
Percentage change∈ price
¿ −7.6
10
¿−0.76
ii)
For low income household= Percemtage∈quantity demand
Percentage change∈ price
¿ −11.6
10
¿−1.16
Question b
Own price elasticity of demand indicates responsiveness of demand of a good considering
variations in prices. Higher the price elasticity of demand, more responsive the demand is. The
price elasticity of demand for Mexican economy as a whole and low income household are -0.76
and -1.16 respectively. The estimated price elasticity of demand is larger for low income
household meaning that low income household are more responsive to price change compared to
⊘ This is a preview!⊘
Do you want full access?
Subscribe today to unlock all pages.

Trusted by 1+ million students worldwide

3ECONOMICS
the economy as a whole (Fine 2016). This in turn suggests low income households are likely to
respond more to the tax on SSB.
Question c
Factors explaining responsiveness to a price increase are as follows
Nature of the commodity
Responses of demand to a price change depends on whether the commodity in question is
a necessary, or luxury or comfort.
Availability of substitutes
Greater the number of available substitutes larger is the responsiveness of demand and
vice-versa.
Income level
Demand elasticity of a commodity varies according among different income groups. For
people with higher income, a relatively smaller proportion of income is spent on any product and
hence, elasticity of demand is relatively low (Kreps 2019). However, lower income people are
highly affected for any change in price and hence, have a larger elasticity of demand.
Level of price
Demand elasticity also depends on initial price level. In case of costly goods, demand is
much elastic relative to a price change. For inexpensive good however demand is relatively
inelastic.
Paraphrase This Document
Need a fresh take? Get an instant paraphrase of this document with our AI Paraphraser

4ECONOMICS
Share of total expenditure
Larger the share of income spent on goods more elastic is the demand and vice-versa.
Postponement of consumption
Commodities whose demand can be postponed generally have a more elastic demand.
Of the above discussed factors difference in income level in explaining difference in price
elasticity of demand explain the difference in elasticity estimate of low income household and
the economy as a whole. Since, people belonging to low income group are more sensitive to
price change computed elasticity is higher for low income household.
Question d
Cross price elasticity of demand= Percentage ∈demand of a good
Percentage change ∈ price of related good
¿ Percentage change∈demand of bottled water
Percentage change∈ price of SSB
¿ 2.1
10
¿ 0.21
The cross price elasticity stands as a measure of evaluating how demand of a good responds
given a change in the price of related good. For substitute goods, since demand responds
positively with change in price of substitute, cross price elasticity of demand is positive. For
complementary goods however, demand changes in opposite direction of price of its
complements and cross price elasticity therefore is negative (Besanko and Braeutigam 2020).

5ECONOMICS
The positive cross price elasticity of demand in the above case indicate SSB and bottled water
are substitutes.
Question e
Figure 1: Market for Sugar Sweetened Beverages
Figure 1 explains the market of sugar sweetened beverages. SS presents market supply
curve. DD is market demand curve. Because of relatively inelastic demand of SSB for the
Mexican economy as a whole, the demand curve is relatively steeper. E indicates point of market
equilibrium. Price and quantity corresponds to equilibrium are P* and Q* respectively.
⊘ This is a preview!⊘
Do you want full access?
Subscribe today to unlock all pages.

Trusted by 1+ million students worldwide

6ECONOMICS
Question f
Figure 2: Impact of tax on SSB
Imposition of tax on SSB, shifts the supply curve of SSB leftward by the tax amount.
Buyers now pays a higher price of P1 for SSBs while sellers receive a lower price of P2.
Equilibrium in the market after the tax imposition shifts to E1. Equilibrium quantity in the market
falls to Q1. Tax revenue to the government is given by the area P2P1E1F. Because demand is
relatively inelastic a greater burden of tax falls on buyers.
Paraphrase This Document
Need a fresh take? Get an instant paraphrase of this document with our AI Paraphraser

7ECONOMICS
Question g
i)
Figure 2: Impact of social awareness campaign
Awareness campaign by making more aware about the adverse health effect directly
reduces demand. Because of such campaign, the demand curve shifts leftward. This reduces both
equilibrium price and quantity of SSBs.
ii)
Unlike tax, awareness campaign does not create a deviation of price between what buyers
pay and what sellers receive. There is a common price which is lower than price before
campaign. For both cases equilibrium quantity of SSBs fall. Unlike tax, awareness campaign
does not create any revenue for government (Cowell 2018). Awareness campaigns are likely to

8ECONOMICS
have a greater impact on the economy as whole compared to the impact on a particular group
like low income household.
iii)
If awareness campaigns are arranged along with tax, there will be larger reduction of
quantity consumed of SSB. The awareness campaign by increasing awareness among people
reduces demand (Mochrie 2015). Tax on SSBs by increasing price of SSBs reduces quantity of
SSB consumption. Therefore, combined effect of both policies will be larger on consumption on
SSB compared to individual policies.
⊘ This is a preview!⊘
Do you want full access?
Subscribe today to unlock all pages.

Trusted by 1+ million students worldwide

9ECONOMICS
References
Besanko, D. and Braeutigam, R., 2020. Microeconomics. John Wiley & Sons.
Cowell, F., 2018. Microeconomics: principles and analysis. Oxford University Press.
Fine, B., 2016. Microeconomics. University of Chicago Press Economics Books.
Kreps, D.M., 2019. Microeconomics for managers. Princeton University Press.
Mankiw, N.G., 2020. Principles of microeconomics. Cengage Learning.
Mochrie, R., 2015. Intermediate microeconomics. Macmillan International Higher Education
1 out of 10
Related Documents

Your All-in-One AI-Powered Toolkit for Academic Success.
+13062052269
info@desklib.com
Available 24*7 on WhatsApp / Email
Unlock your academic potential
Copyright © 2020–2025 A2Z Services. All Rights Reserved. Developed and managed by ZUCOL.