Economics Homework: Supply, Demand, Elasticity, and Market Structures
VerifiedAdded on  2020/04/07
|6
|1068
|71
Homework Assignment
AI Summary
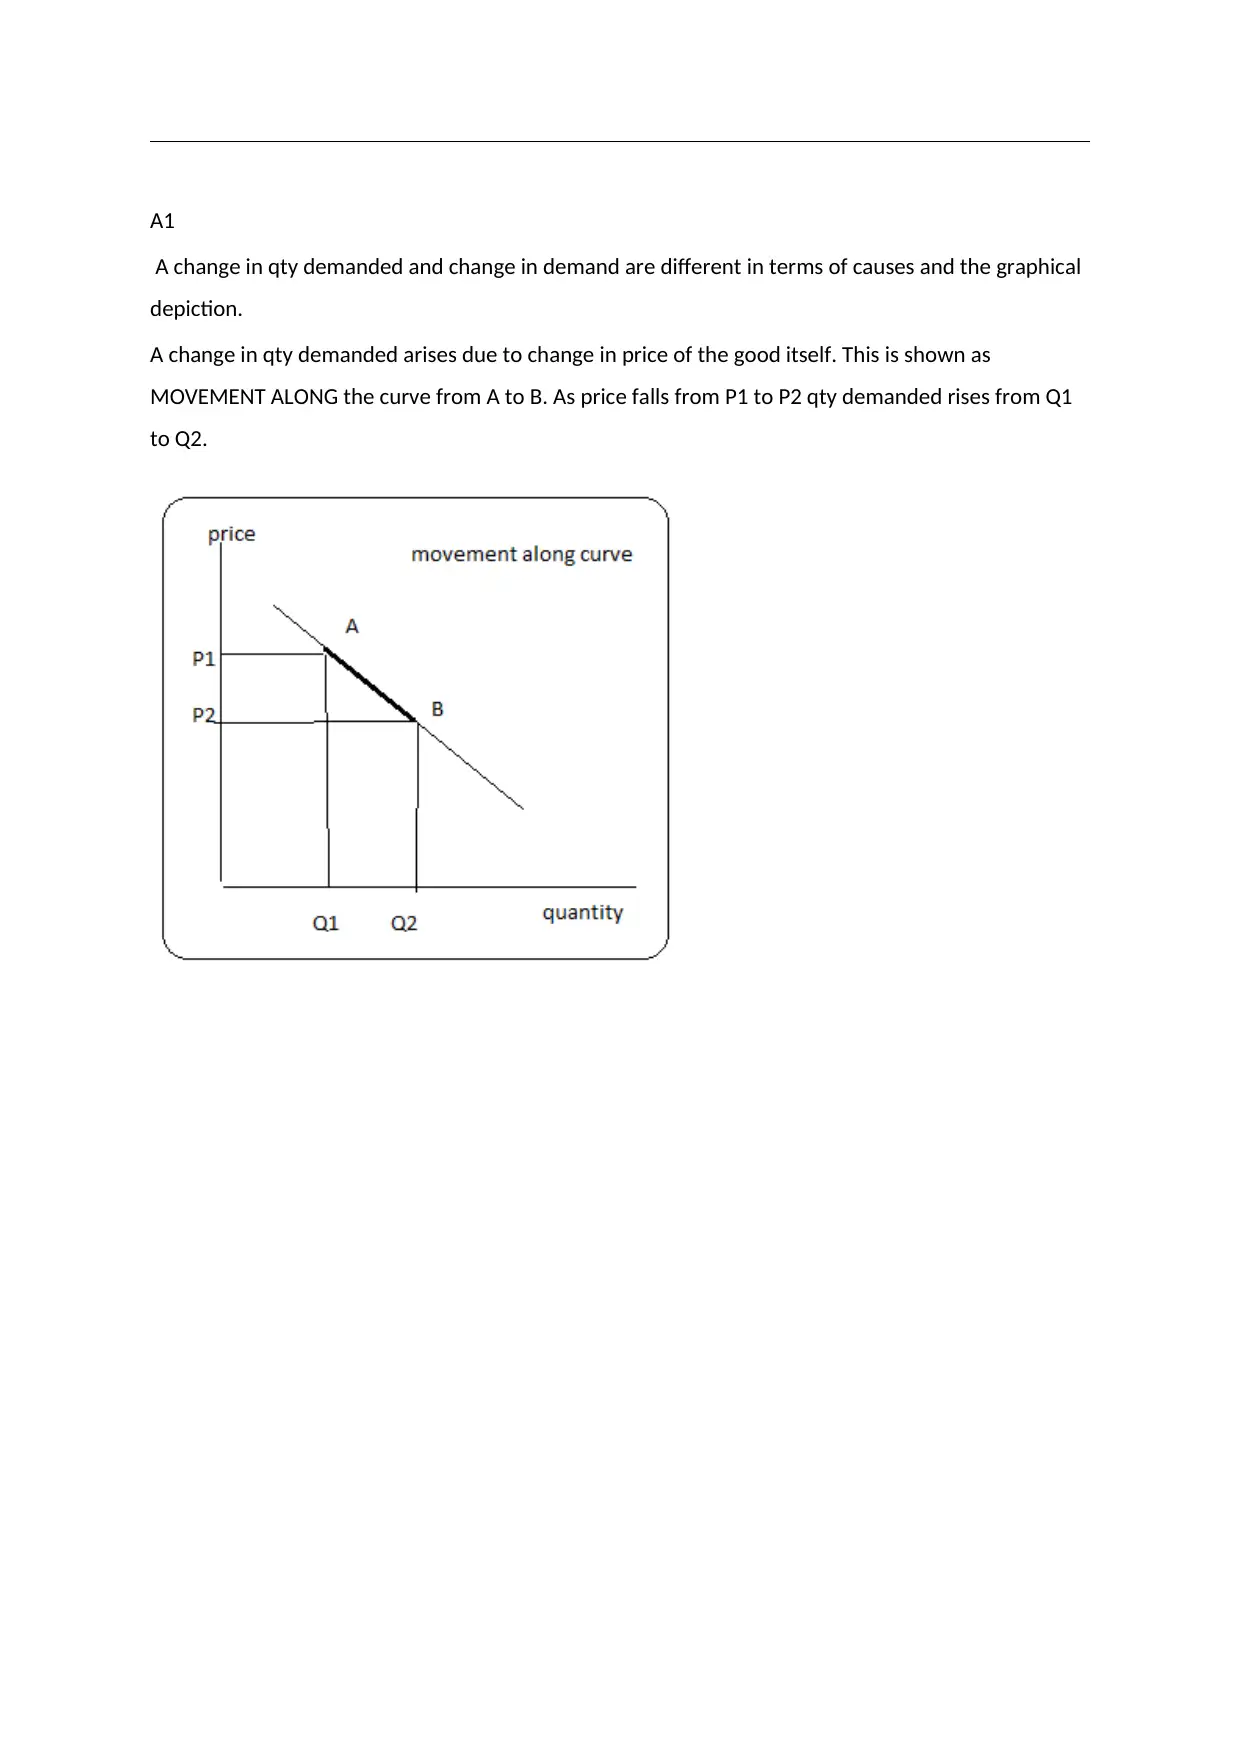
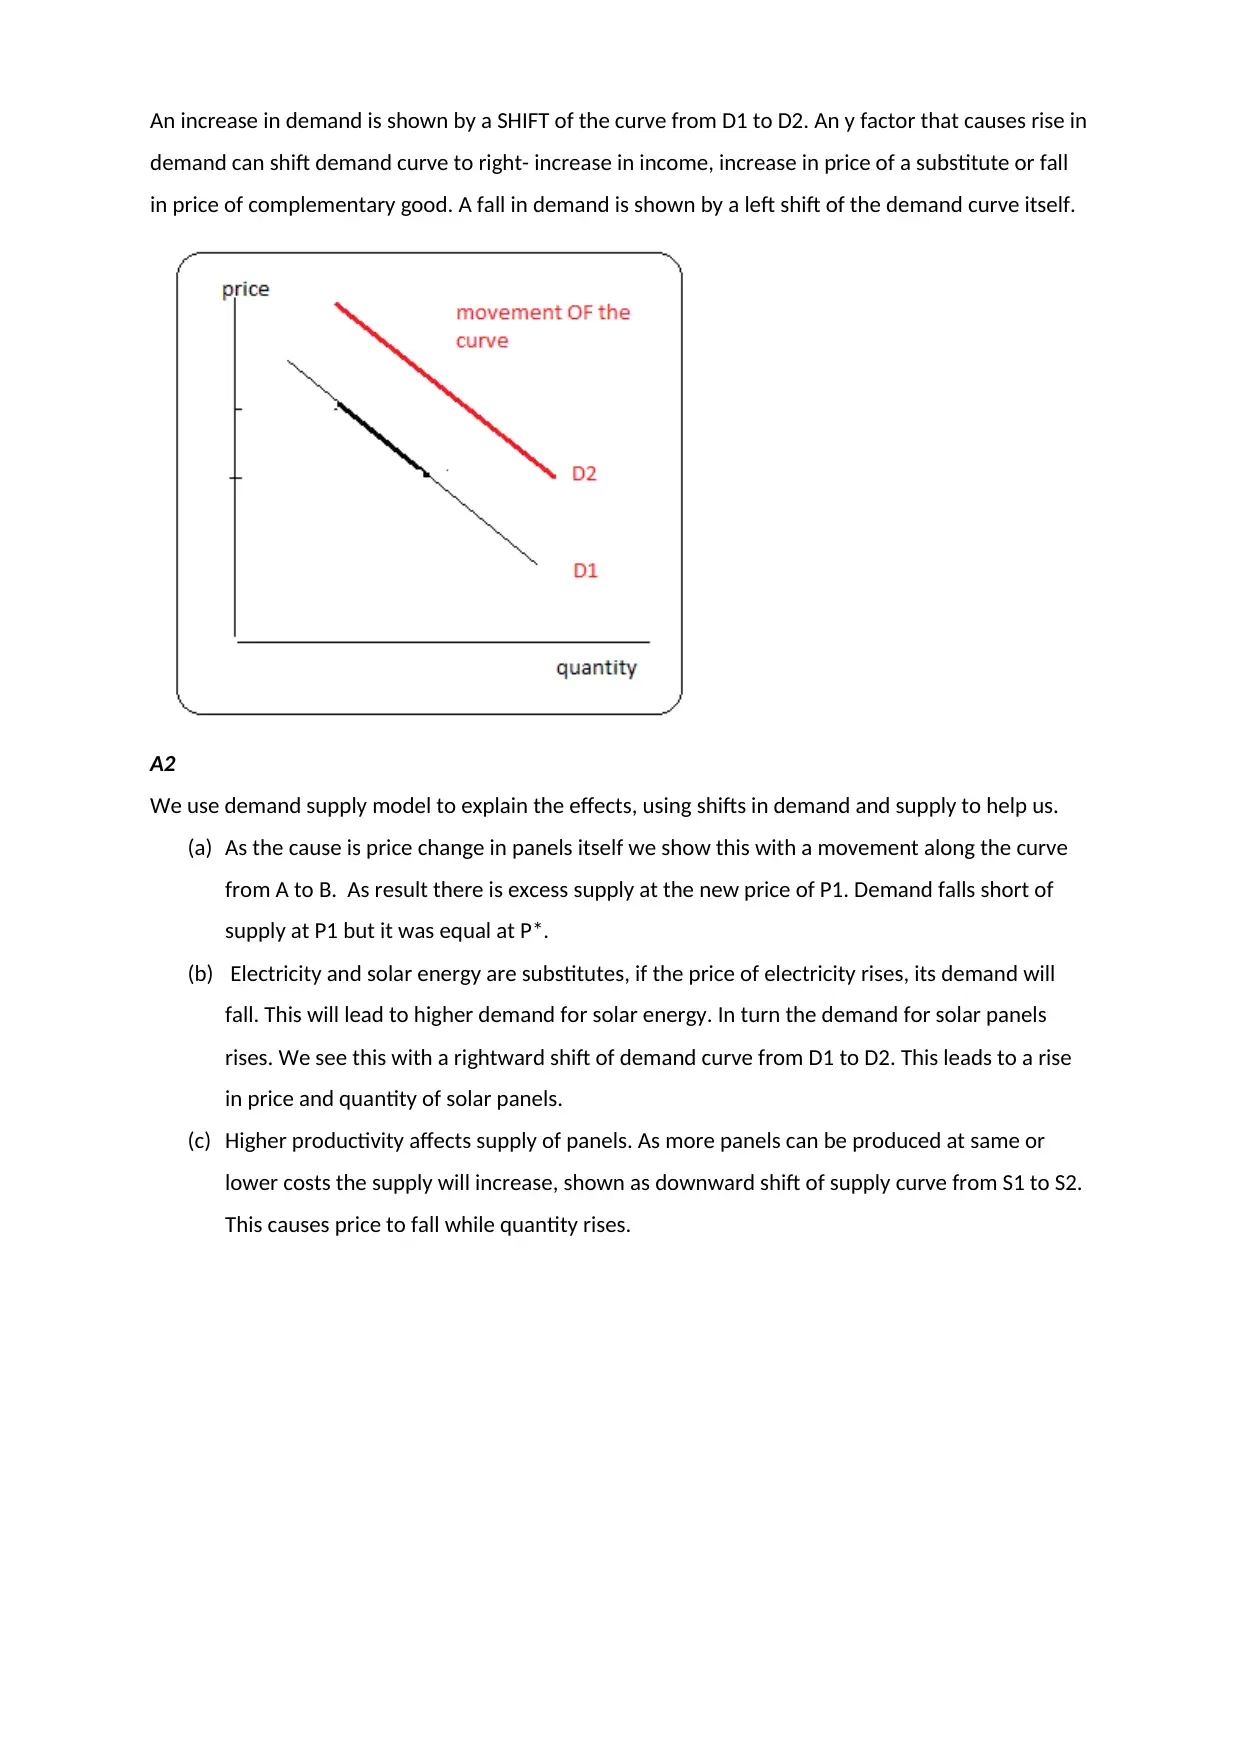
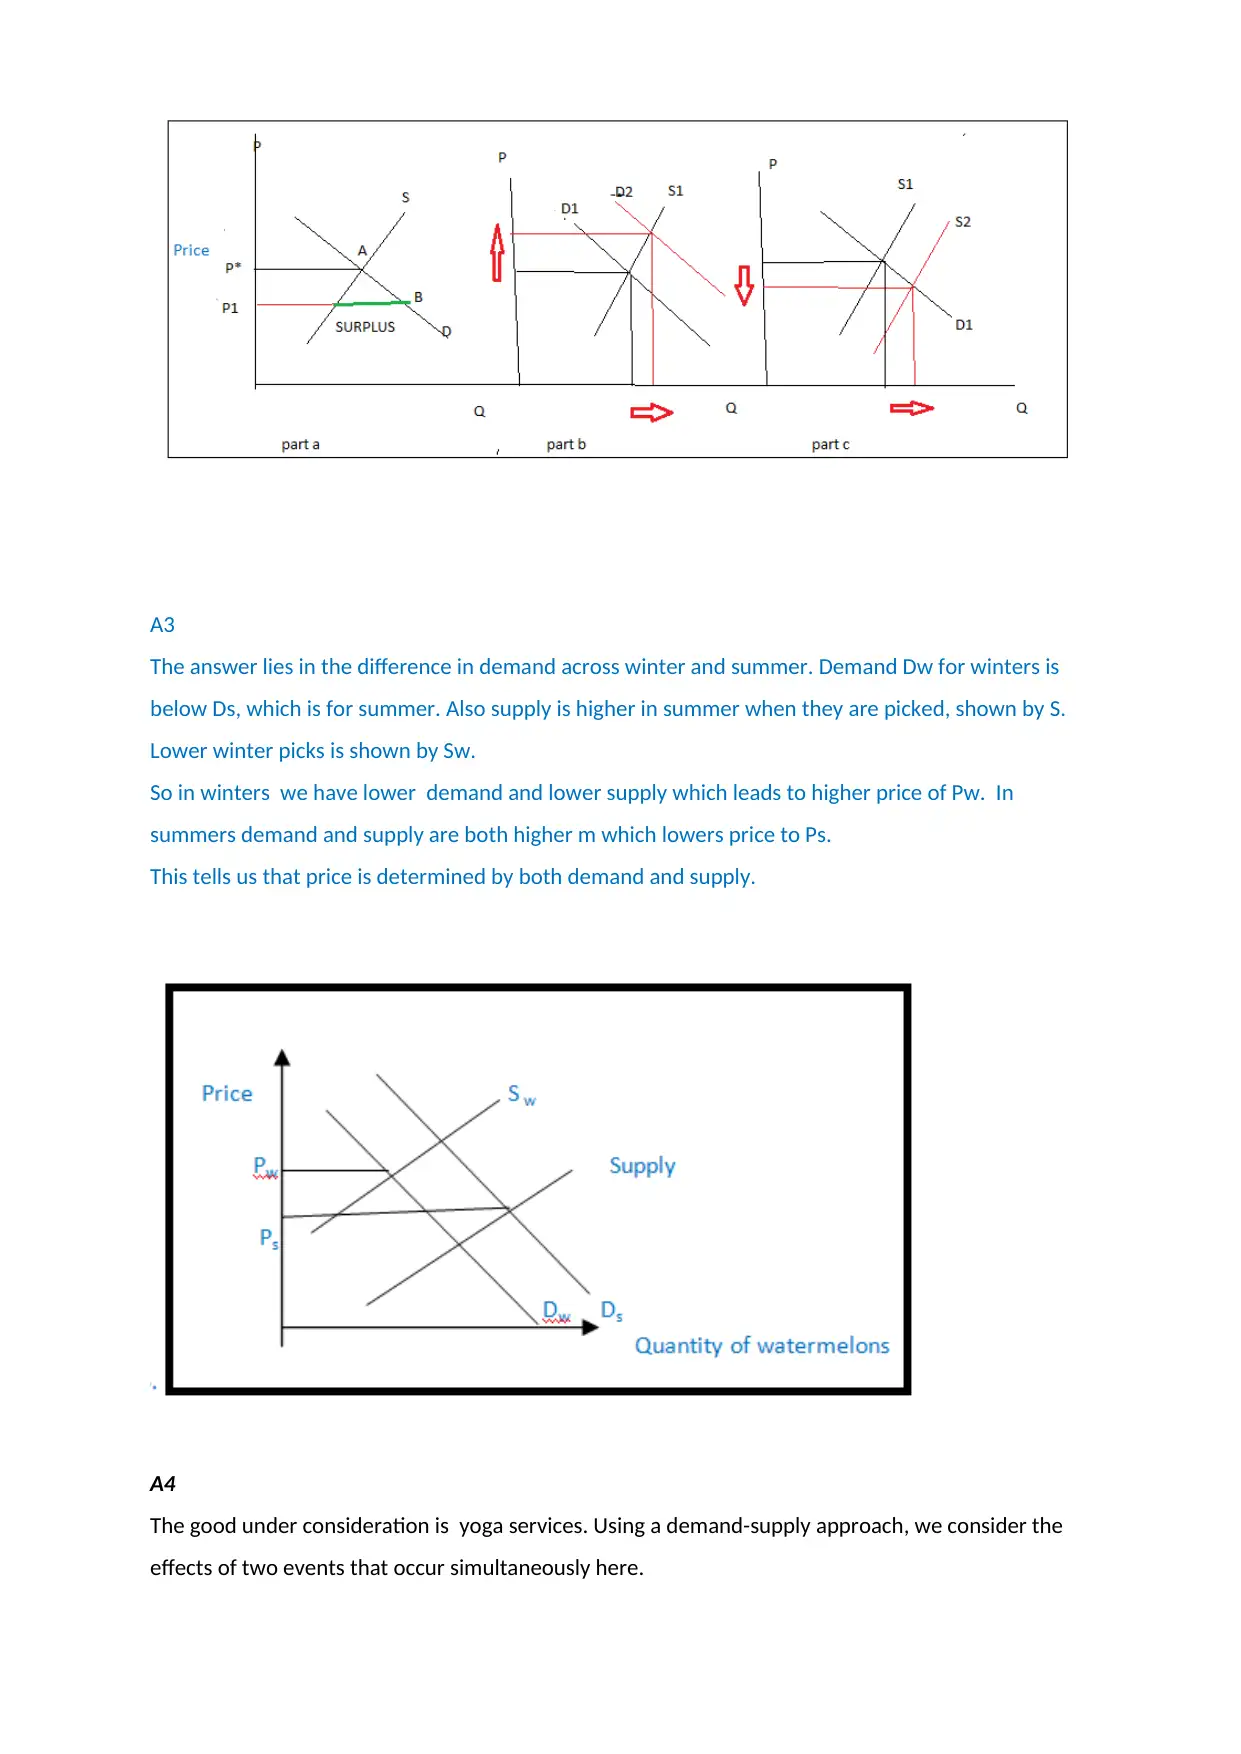
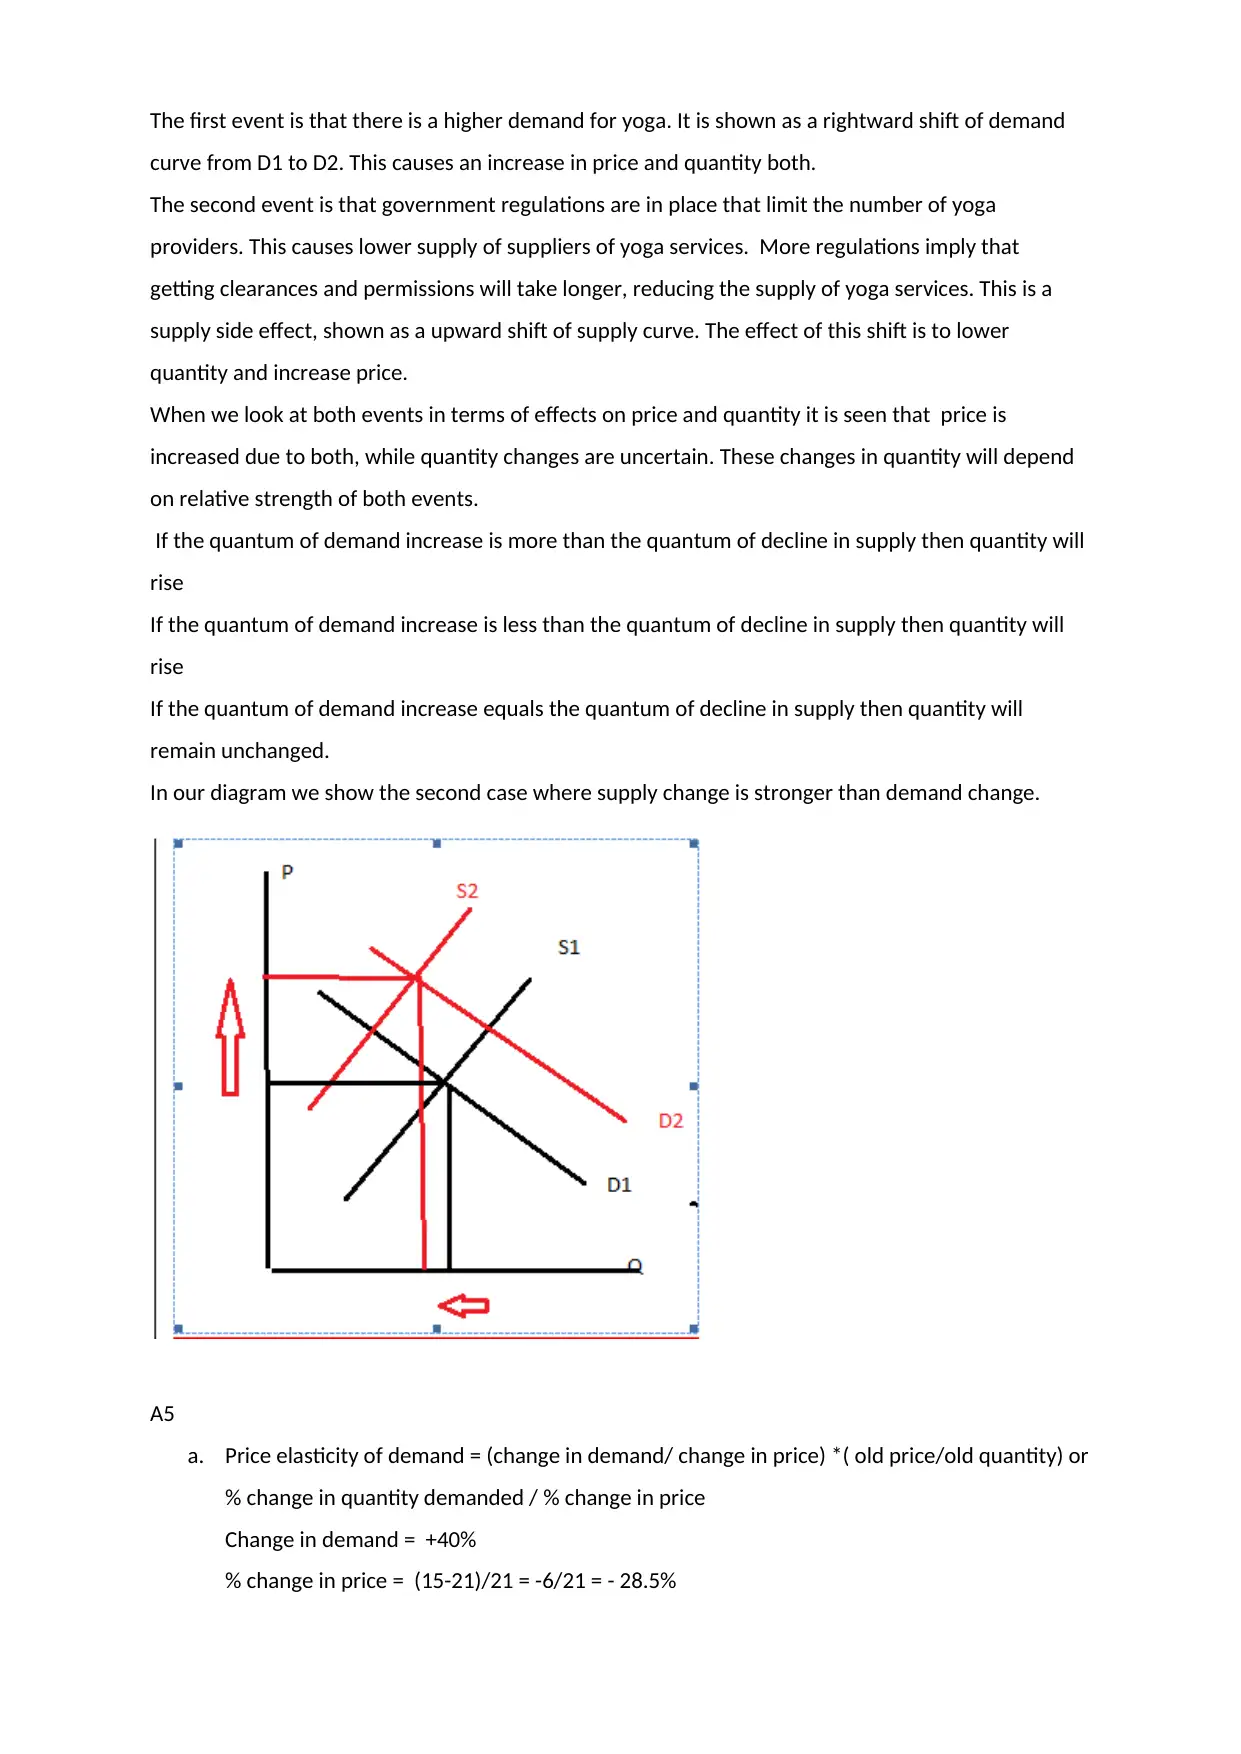
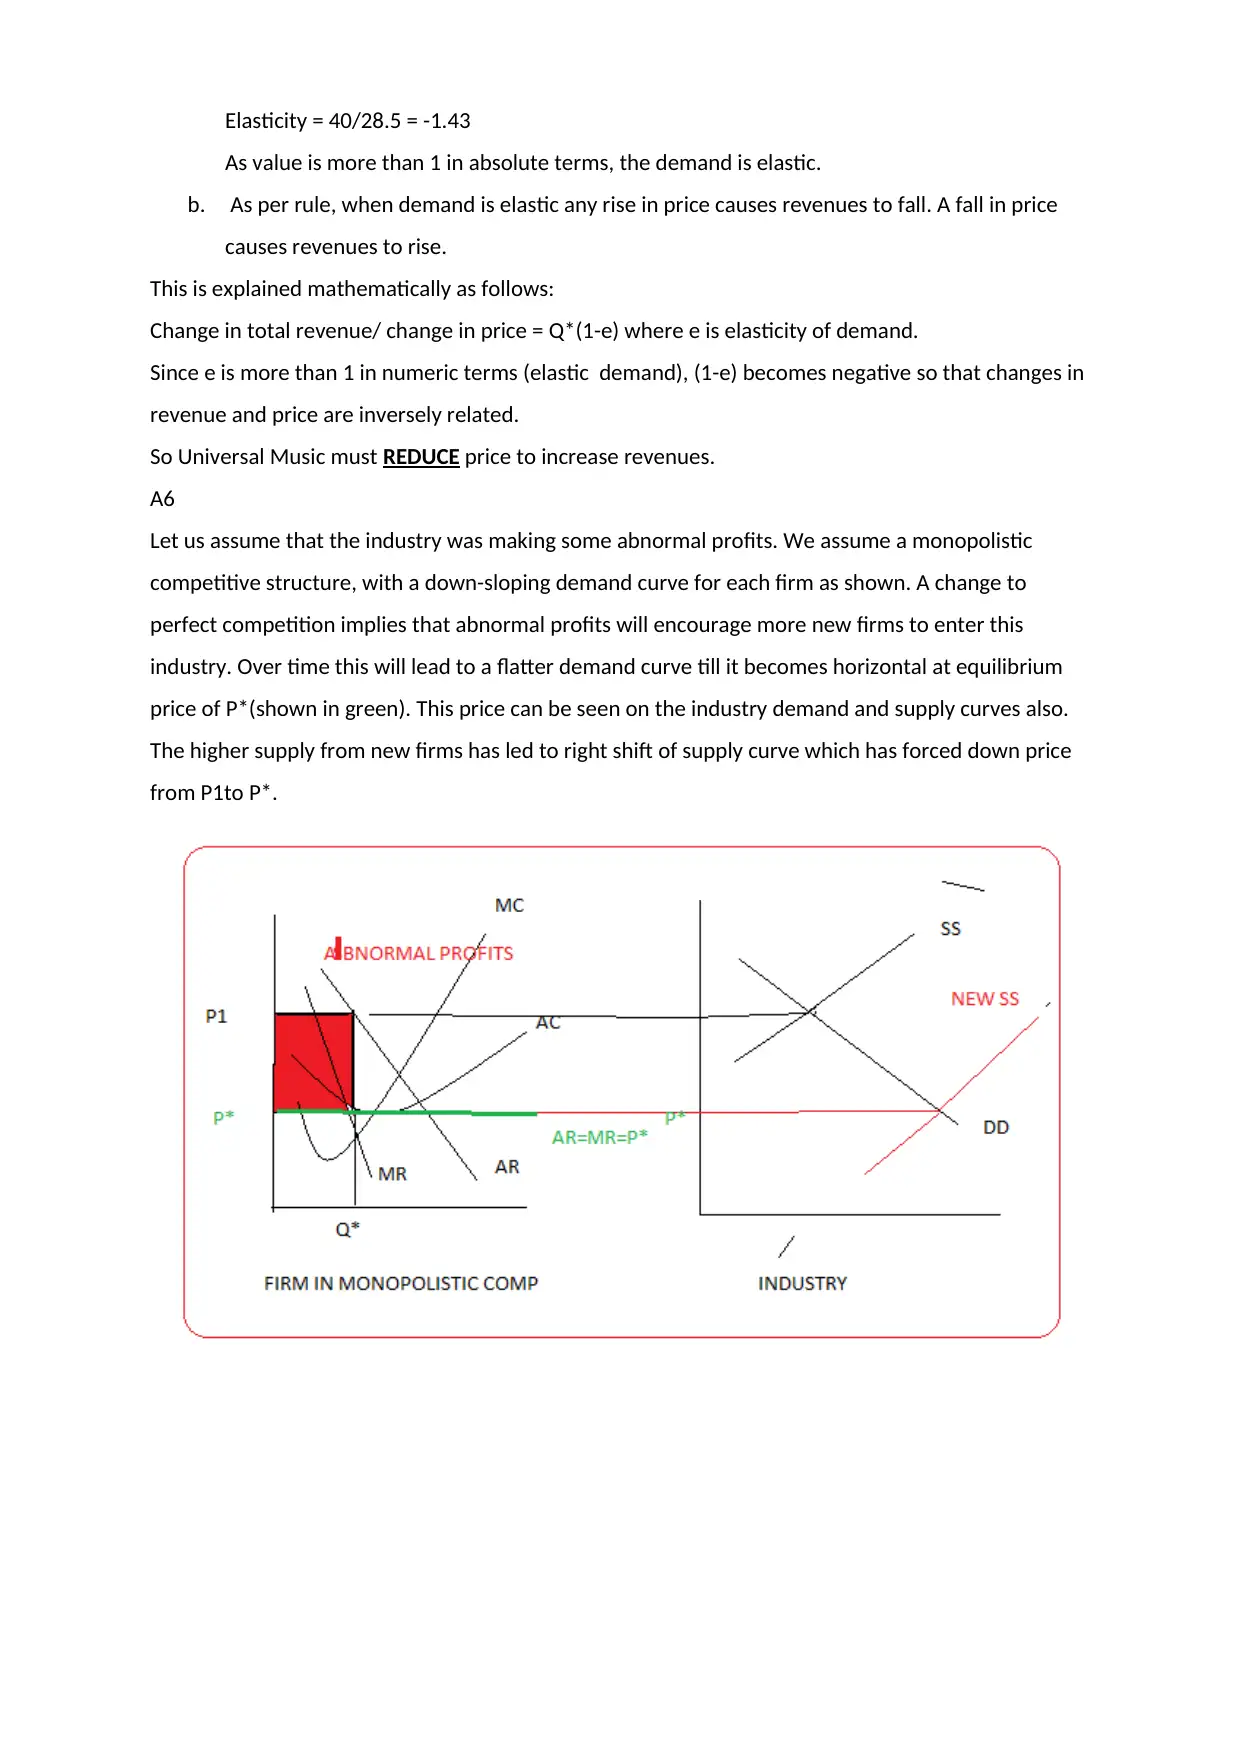
This economics assignment explores fundamental microeconomic concepts including the distinction between a change in quantity demanded versus a change in demand, illustrating these concepts graphically. It analyzes the effects of shifts in supply and demand using various scenarios, such as price changes, substitute goods, and productivity increases. The assignment further examines how supply and demand determine prices in different seasons, using winter and summer examples. It then applies the demand-supply model to analyze the simultaneous effects of increased demand and government regulations on the yoga services market. The assignment includes a detailed examination of price elasticity of demand, calculating elasticity and its implications for revenue. Finally, it explores the transition from monopolistic competition to perfect competition, illustrating the impact of market structure changes on price and supply, with references to supporting economic resources.

A1
A change in qty demanded and change in demand are different in terms of causes and the graphical
depiction.
A change in qty demanded arises due to change in price of the good itself. This is shown as
MOVEMENT ALONG the curve from A to B. As price falls from P1 to P2 qty demanded rises from Q1
to Q2.
Paraphrase This Document
Need a fresh take? Get an instant paraphrase of this document with our AI Paraphraser

An increase in demand is shown by a SHIFT of the curve from D1 to D2. An y factor that causes rise in
demand can shift demand curve to right- increase in income, increase in price of a substitute or fall
in price of complementary good. A fall in demand is shown by a left shift of the demand curve itself.
A2
We use demand supply model to explain the effects, using shifts in demand and supply to help us.
(a) As the cause is price change in panels itself we show this with a movement along the curve
from A to B. As result there is excess supply at the new price of P1. Demand falls short of
supply at P1 but it was equal at P*.
(b) Electricity and solar energy are substitutes, if the price of electricity rises, its demand will
fall. This will lead to higher demand for solar energy. In turn the demand for solar panels
rises. We see this with a rightward shift of demand curve from D1 to D2. This leads to a rise
in price and quantity of solar panels.
(c) Higher productivity affects supply of panels. As more panels can be produced at same or
lower costs the supply will increase, shown as downward shift of supply curve from S1 to S2.
This causes price to fall while quantity rises.

A3
The answer lies in the difference in demand across winter and summer. Demand Dw for winters is
below Ds, which is for summer. Also supply is higher in summer when they are picked, shown by S.
Lower winter picks is shown by Sw.
So in winters we have lower demand and lower supply which leads to higher price of Pw. In
summers demand and supply are both higher m which lowers price to Ps.
This tells us that price is determined by both demand and supply.
A4
The good under consideration is yoga services. Using a demand-supply approach, we consider the
effects of two events that occur simultaneously here.
⊘ This is a preview!⊘
Do you want full access?
Subscribe today to unlock all pages.

Trusted by 1+ million students worldwide

The first event is that there is a higher demand for yoga. It is shown as a rightward shift of demand
curve from D1 to D2. This causes an increase in price and quantity both.
The second event is that government regulations are in place that limit the number of yoga
providers. This causes lower supply of suppliers of yoga services. More regulations imply that
getting clearances and permissions will take longer, reducing the supply of yoga services. This is a
supply side effect, shown as a upward shift of supply curve. The effect of this shift is to lower
quantity and increase price.
When we look at both events in terms of effects on price and quantity it is seen that price is
increased due to both, while quantity changes are uncertain. These changes in quantity will depend
on relative strength of both events.
If the quantum of demand increase is more than the quantum of decline in supply then quantity will
rise
If the quantum of demand increase is less than the quantum of decline in supply then quantity will
rise
If the quantum of demand increase equals the quantum of decline in supply then quantity will
remain unchanged.
In our diagram we show the second case where supply change is stronger than demand change.
A5
a. Price elasticity of demand = (change in demand/ change in price) *( old price/old quantity) or
% change in quantity demanded / % change in price
Change in demand = +40%
% change in price = (15-21)/21 = -6/21 = - 28.5%
Paraphrase This Document
Need a fresh take? Get an instant paraphrase of this document with our AI Paraphraser

Elasticity = 40/28.5 = -1.43
As value is more than 1 in absolute terms, the demand is elastic.
b. As per rule, when demand is elastic any rise in price causes revenues to fall. A fall in price
causes revenues to rise.
This is explained mathematically as follows:
Change in total revenue/ change in price = Q*(1-e) where e is elasticity of demand.
Since e is more than 1 in numeric terms (elastic demand), (1-e) becomes negative so that changes in
revenue and price are inversely related.
So Universal Music must REDUCE price to increase revenues.
A6
Let us assume that the industry was making some abnormal profits. We assume a monopolistic
competitive structure, with a down-sloping demand curve for each firm as shown. A change to
perfect competition implies that abnormal profits will encourage more new firms to enter this
industry. Over time this will lead to a flatter demand curve till it becomes horizontal at equilibrium
price of P*(shown in green). This price can be seen on the industry demand and supply curves also.
The higher supply from new firms has led to right shift of supply curve which has forced down price
from P1to P*.

References
Economics.utoronto.ca, n.d. Elasticity, TR and MR. [Online] Available
athttps://www.economics.utoronto.ca/jfloyd/modules/eltr.html [Accessed 12 Sep 2017].
Econport.org, n.d. Impact of Shifts in demand and supply. [Online] Available
athttp://www.econport.org/content/handbook/Equilibrium/Impact-.html [Accessed 3 SEP 2017].
Open.lib.umn.edu, n.d. Perfect Comnpetition in the Long run. [Online] Available at:
https://open.lib.umn.edu/principleseconomics/chapter/9-3-perfect-competition-in-the-long-run/
[Accessed 15 Sep 2017].
SSC.wise.edu, n.d. Supply and demand. [Online] Available at:
http://www.ssc.wisc.edu/~scholz/Teaching_101/Lecture3.pdf [Accessed 16 Sep 2017].
⊘ This is a preview!⊘
Do you want full access?
Subscribe today to unlock all pages.

Trusted by 1+ million students worldwide
1 out of 6
Related Documents

Your All-in-One AI-Powered Toolkit for Academic Success.
 +13062052269
info@desklib.com
Available 24*7 on WhatsApp / Email
Unlock your academic potential
Copyright © 2020–2025 A2Z Services. All Rights Reserved. Developed and managed by ZUCOL.