Principles of Economics Report: Supply, Demand, and Inflation Analysis
VerifiedAdded on 2019/12/04
|11
|2772
|280
Report
AI Summary
This economics report delves into the core principles of supply and demand, examining their impact on equilibrium price and quantity. It explores how shifts in demand and supply curves affect market dynamics and the consequences of rising production costs on pricing strategies. Furthermore, the report provides a detailed explanation of how Gross Domestic Product (GDP) is calculated using the expenditure method, outlining the key components such as consumption, investment, government spending, and net exports. The report also elucidates the methods used to measure inflation in the UK, focusing on the Consumer Price Index (CPI) and its relationship with GDP. The analysis underscores the interconnectedness of these economic indicators and their significance in understanding market behavior and economic health. Finally, it includes a comprehensive review of the relevant academic literature to support the findings.

PRINCIPLES OF ECONOMICS
Paraphrase This Document
Need a fresh take? Get an instant paraphrase of this document with our AI Paraphraser

TABLE OF CONTENTS
INTRODUCTION...........................................................................................................................3
a) Use of supply and demand framework to find the impact on equilibrium price of product....3
b) How gross domestic product is calculated using expenditure method ..................................6
CONCLUSION................................................................................................................................7
REFERENCES................................................................................................................................9
INTRODUCTION
Economics is related to the science which describes certain factors that help to determine
the production, distribution and consumption of goods. The science of economics depends upon
some principles such as demand and supply (Monga, 2015). The present report is based on
supply and demand framework as well as it also explains equilibrium price and quantity of
product on a large increase in cost of production. Apart from this, method of measuring rate of
inflation in UK has also been elaborated.
a) Use of supply and demand framework to find the impact on equilibrium price of product
Demand refers to the willingness of people for purchasing products and services on a
certain price from the market. On contrary to this, supply refers to the capacity of market to offer
specific amount of services and products. The connection which exists between price and
quantity is known as the demand relationship (Onodipe, Ayadi and Marquez, 2016). A minor
change in demand can make a huge impact on the supply chain of products in market and little
alteration in supply can make high impact on the need of a product.
Demand framework of a product or service:
It is related with the willingness of people to buy some goods and services. It is having
major impact on the equilibrium price of a product or service. Change in demand curve can
affect the total equilibrium point of the market. Apart from that, decrease in requirement can
reduce the equilibrium price and quantity of goods as well.
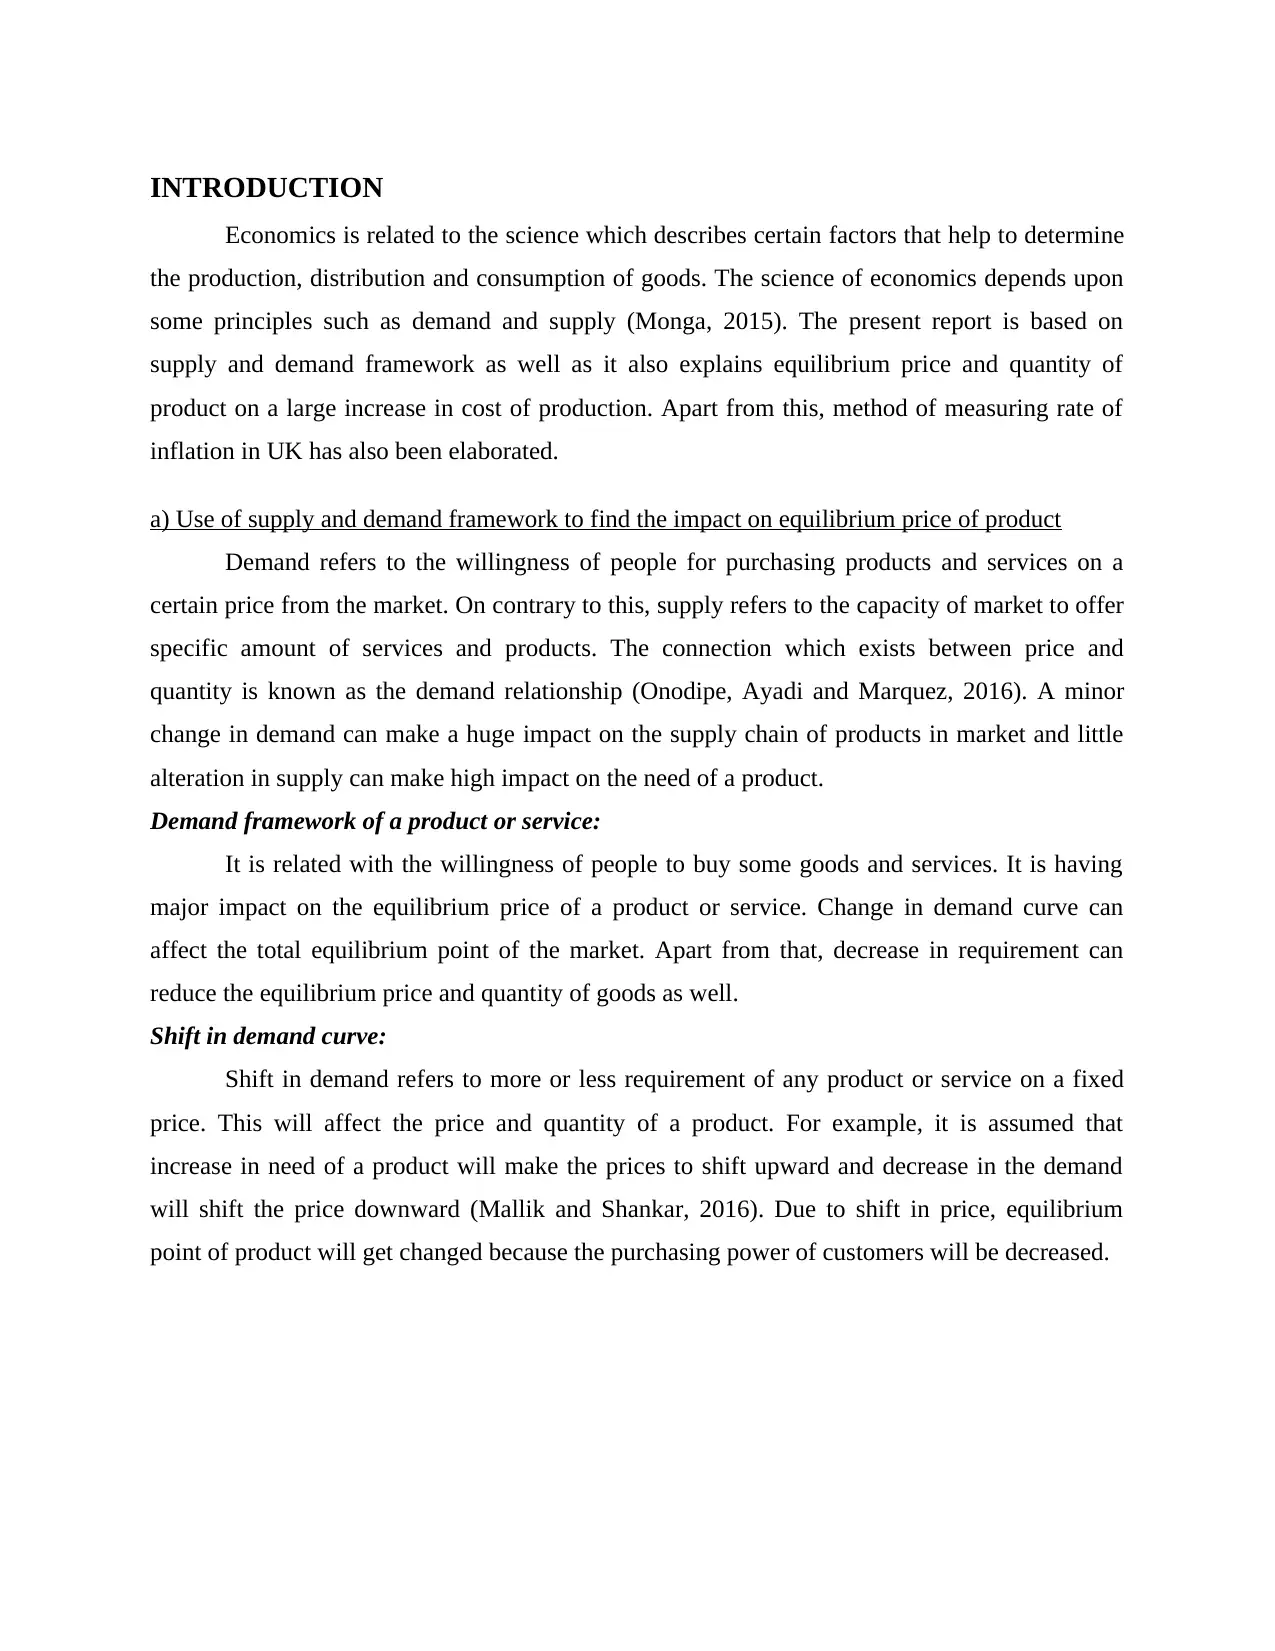
Shift in demand curve:
Shift in demand refers to more or less requirement of any product or service on a fixed
price. This will affect the price and quantity of a product. For example, it is assumed that
increase in need of a product will make the prices to shift upward and decrease in the demand
will shift the price downward (Mallik and Shankar, 2016). Due to shift in price, equilibrium
point of product will get changed because the purchasing power of customers will be decreased.
Economics is related to the science which describes certain factors that help to determine
the production, distribution and consumption of goods. The science of economics depends upon
some principles such as demand and supply (Monga, 2015). The present report is based on
supply and demand framework as well as it also explains equilibrium price and quantity of
product on a large increase in cost of production. Apart from this, method of measuring rate of
inflation in UK has also been elaborated.
a) Use of supply and demand framework to find the impact on equilibrium price of product
Demand refers to the willingness of people for purchasing products and services on a
certain price from the market. On contrary to this, supply refers to the capacity of market to offer
specific amount of services and products. The connection which exists between price and
quantity is known as the demand relationship (Onodipe, Ayadi and Marquez, 2016). A minor
change in demand can make a huge impact on the supply chain of products in market and little
alteration in supply can make high impact on the need of a product.
Demand framework of a product or service:
It is related with the willingness of people to buy some goods and services. It is having
major impact on the equilibrium price of a product or service. Change in demand curve can
affect the total equilibrium point of the market. Apart from that, decrease in requirement can
reduce the equilibrium price and quantity of goods as well.
Shift in demand curve:
Shift in demand refers to more or less requirement of any product or service on a fixed
price. This will affect the price and quantity of a product. For example, it is assumed that
increase in need of a product will make the prices to shift upward and decrease in the demand
will shift the price downward (Mallik and Shankar, 2016). Due to shift in price, equilibrium
point of product will get changed because the purchasing power of customers will be decreased.
⊘ This is a preview!⊘
Do you want full access?
Subscribe today to unlock all pages.
Trusted by 1+ million students worldwide
If the curve above shows that demand curve is shifting towards right side, it states that
there is increase in the need of product. Through increase in the requirement of product,
equilibrium price of product will also get increased. However, on the other hand, if demand
curve shifts to the left side then it shows that there is decrease in the demand of product. Due to
decrease in this, equilibrium price of product will also get lower.
Supply framework of product or service:
Supply framework is related to the number of services which are available in market. If
the supply of products are different from demand of services then equilibrium price of market
will also get changed. Overall, change in supply can make the equilibrium price and output to
change in opposite directions.
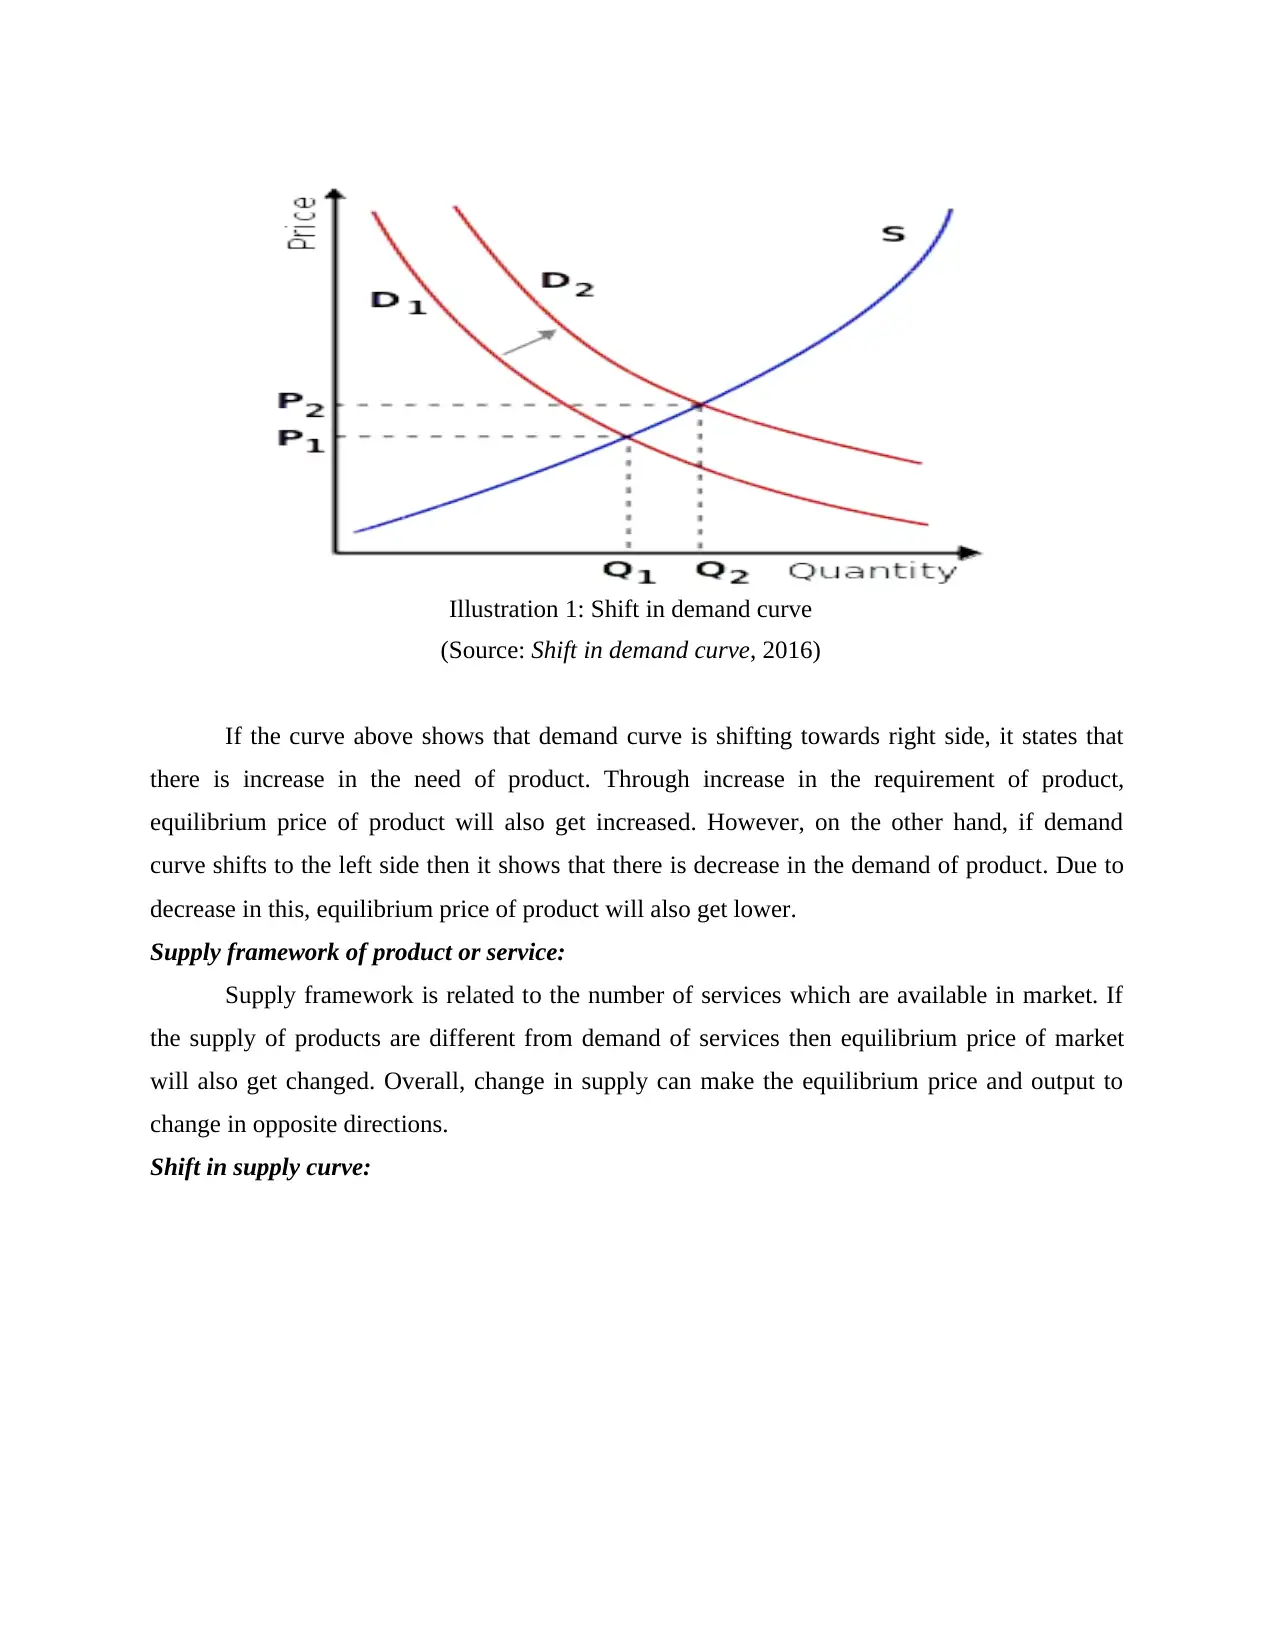
Shift in supply curve:
Illustration 1: Shift in demand curve
(Source: Shift in demand curve, 2016)
there is increase in the need of product. Through increase in the requirement of product,
equilibrium price of product will also get increased. However, on the other hand, if demand
curve shifts to the left side then it shows that there is decrease in the demand of product. Due to
decrease in this, equilibrium price of product will also get lower.
Supply framework of product or service:
Supply framework is related to the number of services which are available in market. If
the supply of products are different from demand of services then equilibrium price of market
will also get changed. Overall, change in supply can make the equilibrium price and output to
change in opposite directions.
Shift in supply curve:
Illustration 1: Shift in demand curve
(Source: Shift in demand curve, 2016)
Paraphrase This Document
Need a fresh take? Get an instant paraphrase of this document with our AI Paraphraser
Shift in supply curve refers to less or more availability of any product or service in
market. Due to increase in the supply of product, equilibrium price of market will get reduced
(Settlage, Settlage and Wollscheid, 2015). On the other hand, decrease in supply of product will
increase the equilibrium price of market.
The above curve presents that supply curve is shifting towards left side which decreases
the equilibrium price of market. On contrary to this, if supply curve will shift more towards the
right side then it will lead to decrease in equilibrium price and would also show increase in the
market supply.
Impact of rise in cost of production on the equilibrium price:
Cost of production is having a great impact on the supply and demand of product as well
as equilibrium price of the market. If cost of production will increase then it will decrease the
overall supply of products in market (Monga, 2015). Due to decrease in the supply, it will cause
increase in equilibrium of product. On the other hand, if supply increases then the equilibrium
price of market will get decreased as well. In case cost if product linked with any commodity
increases then in turn, business has to set higher prices with having motive to recover the overall
cost. Further, equilibrium price is the market rate where quantity of goods being supplied is
Illustration 2: Shift in supply curve
(Source: Shift in supply curve, 2016)
equal to the demand of same. It is the actual point where demand and supply curves intersect.
Rise in cost of production has direct impact on the price being decided by the organization for
offering its goods and services (Cameron and Lim, 2015).
b) How inflation is measured in the UK
Expenditure method is one of the most common approaches with the help of which GDP
can be determined and it is the measure of economy’s output produced within any specific
country (Cosgrove and Olitsky, 2015). GDP in accordance with this method is computed by
summing up all expenses on final goods and services. Generally, four categories are being
undertaken whose details are as follows:
Gross Private Consumption Expenditures(C)
Gross Private Investment (I)
Government Purchases (G)
Net Exports (X - M)
GDP = C + I + G +NX
Private consumption expenditure: It takes into consideration all goods and services
purchased by households. This expenditure is based on different assumptions like:
When taxes go down then people have more income left,
When income increases then C increases and In case of rise in interest rate, people starts to save more money (Bennett, McCarty and
Carter, 2015).
Investment: Two types of investments are present which involves fixed and inventory.
Fixed one is linked with the purchase of capital goods and inventory one is change in
inventories. Generally, investment represents the overall purchase made by businesses on large
number of assets such as machines, equipment, etc (Baumol and Blinder, 2015).
Total Investment (I) = Fixed Investment + Inventory Investment + Residential Investment
Government purchases: It is linked with total expenditure on goods and services by local
along with the federal state authorities. The overall payment takes into consideration government
spending on the welfare project. Entire purchases made by government are the most important as
they are done for the welfare of society and leads to economic development.
⊘ This is a preview!⊘
Do you want full access?
Subscribe today to unlock all pages.
Trusted by 1+ million students worldwide
Net exports: It is considered as the value of a specific country which is calculated by
exports minus total imports (Maier and Chi, 2016).
The main importance of expenditure model of GDP is that it produces both real and
nominal value and all the key elements are being added such as spending, consumption etc which
are most crucial in any type of economy (Khan and Ssnhadji, 2001). Further, without involving
export along with government investments it is quite difficult to calculate GDP of any specific
nation. The main importance of this model can be highlighted on the basis of key factors which it
considers and this supports in knowing the real growth of any specific economy.
It is important to note here that GDP and the mentioned method of inflation, CPI are
directly correlated. These two are the most significant characteristics of a healthy economy. They
run proportional to each other, the only way to offset the negative impact one may experience
due to the other, is steady growth (Rousseau and Wachtel, 2002).
For calculation of inflation in UK overall changes which are taking place in the cost of
living are measured and the most commonly used method is Consumer Price Index (CPI) and
Retail Prices Index (RPI). In order to compute inflation government of the nation undertakes
family expenditure survey and it takes into consideration survey of around 6000 people. This
supports in determining what % of income is being spend on different goods (UK Price
Statistics: A Review, 2015.). Apart from this inflation and GDP are linked with one another as
GDP is always adjusted for 6 percent inflation and for measurement of inflation CPI is used.
Inflation increases when GDP grows with the rate of 2.5% due to presence of several factors
such as demand for goods, overstretching, supply etc (David., 2016). Generally when inflation
rises then consumers prefer to spend more amount on goods and services before the prices go
even higher. This leads to rise in level of GDP and through this it can be stated that GDP and
inflation has direct relation. All this type of information supports government in creating typical
basket of goods. With the help of this weightage is being given to different type of commodities
like petrol 9% etc. Fundamentally, inflation is the rate of change in various aspects of the
economy. Hence, both the CPI and RPI method is used to ascertain the level of inflation in the
country's economy. Both the methods work to determine the fluctuations in prices of certain
Paraphrase This Document
Need a fresh take? Get an instant paraphrase of this document with our AI Paraphraser
products, however the products and formula applied differ in both the cases (Differences between
CPI and RPI measures of inflation, 2010). The former is an international measure, determining
the general price level of economy. The data is collected by sample prices and using a 'basket ' of
goods as weights. It also been observed that RPI is no more used for measuring inflation levels
and the method of CPI is preferred over the RPI.
CONCLUSION
Entire study being carried out has supported in knowing about the impact of equilibrium
price on the manufacturer of commodity. Further, in case if cost of production increases, it
influences the price of product or service. Moreover, calculation of GDP with the help of
expenditure method depends on large number of elements such as investment, government
expenditure, net exports, etc. Moreover, for computation of inflation in UK overall alteration
which are taking place in the cost of living are measured and CPI as one of the method is
employed. Further, expenditure model of GDP is regarded to be most important as it consider
large number of factors which are associated with the economic growth such as exports,
spending etc.
REFERENCES
Journals and books
Cameron, M. P. and Lim, S., 2015. Recognising and building on freshman students’ prior
knowledge of economics. New Zealand Economic Papers. 49(1). pp.22-32.
Cosgrove, S. B. and Olitsky, N. H., 2015. Knowledge retention, student learning, and blended
course work: Evidence from principles of economics courses. Southern Economic
Journal. 82(2). pp.556-579
Emanuel, E. J. and et.al., 2016. Using behavioral economics to design physician incentives that
deliver high-value care. Annals of internal medicine. 164(2). pp.114-119.
Maier, M. and Chi, W. E., 2016. Community college economics instruction: Results from a
National Science Foundation Project. The Journal of Economic Education, 47(1).
pp.84-88.
Mallik, G. and Shankar, S., 2016. Does prior knowledge of economics and higher level
mathematics improve student learning in principles of economics?. Economic Analysis
and Policy. 49. pp.66-73.
Monga, C., 2015. Principles of Economics. In The Oxford Handbook of Africa and Economics.
Onodipe, G., Ayadi, M. F. and Marquez, R., 2016. The efficient design of an online course:
principles of economics. Journal of Economics and Economic Education Research.
17(1). pp.39.
Settlage, D. M., Settlage, L. A. and Wollscheid, J. R., 2015. Measuring knowledge in principles
of economics courses. Journal of Economics and Economic Education Research. 16(3).
pp.241.
Khan, M.S. and Ssnhadji, A.S., 2001. Threshold effects in the relationship between inflation and
growth. IMF Staff papers. 48(1). pp. 1-21.
Rousseau, P.L. and Wachtel, P., 2002. Inflation thresholds and the finance–growth
nexus. Journal of International Money and Finance. 21(6). pp. 777-793.
Online
Shift in demand curve. 2016. [Online]. Available through:
<http://www.economicsonline.co.uk/Managing_the_economy/Inflation_and_deflation.h
tml>. [Accessed on 28th July].
⊘ This is a preview!⊘
Do you want full access?
Subscribe today to unlock all pages.
Trusted by 1+ million students worldwide
Shift in supply curve. 2016. [Online]. Available through:
<http://www.economicsonline.co.uk/Competitive_markets/Shifts_in_supply.html>.
[Accessed on 28th July 2016].
Differences between CPI and RPI measures of inflation, 2010. [PDF]. Available through
<https://www.google.co.in/url?
sa=t&rct=j&q=&esrc=s&source=web&cd=3&cad=rja&uact=8&ved=0ahUKEwjE1MC
H3LbOAhVFN48KHVSECtwQFggrMAI&url=http%3A%2F%2Fwww.ons.gov.uk
%2Fons%2Fguide-method%2Fuser-guidance%2Fprices%2Fcpi-and-rpi
%2Fdifferences-between-the-rpi-and-cpi-measures-of-
inflation.pdf&usg=AFQjCNHOty98RHNnmpkM9gUorfLY_BKSVA&bvm=bv.129389
765,d.c2I>. [Accessed on 10th August, 2016]
UK Price Statistics: A Review, 2015. [PDF]. Available through
<https://www.statisticsauthority.gov.uk/archive/reports---correspondence/current-
reviews/uk-consumer-price-statistics---a-review.pdf>. [Accessed on 10th August, 2010]
DAVID., 2016. The Three Pillars of the Economy: Inflation, GDP and Unemployment
[Online]. Available through < http://financialnerd.com/three-pillars-economy-inflation-gdp-
unemployment/>. [Accessed on 10th August, 2010]
Paraphrase This Document
Need a fresh take? Get an instant paraphrase of this document with our AI Paraphraser
APPENDIX
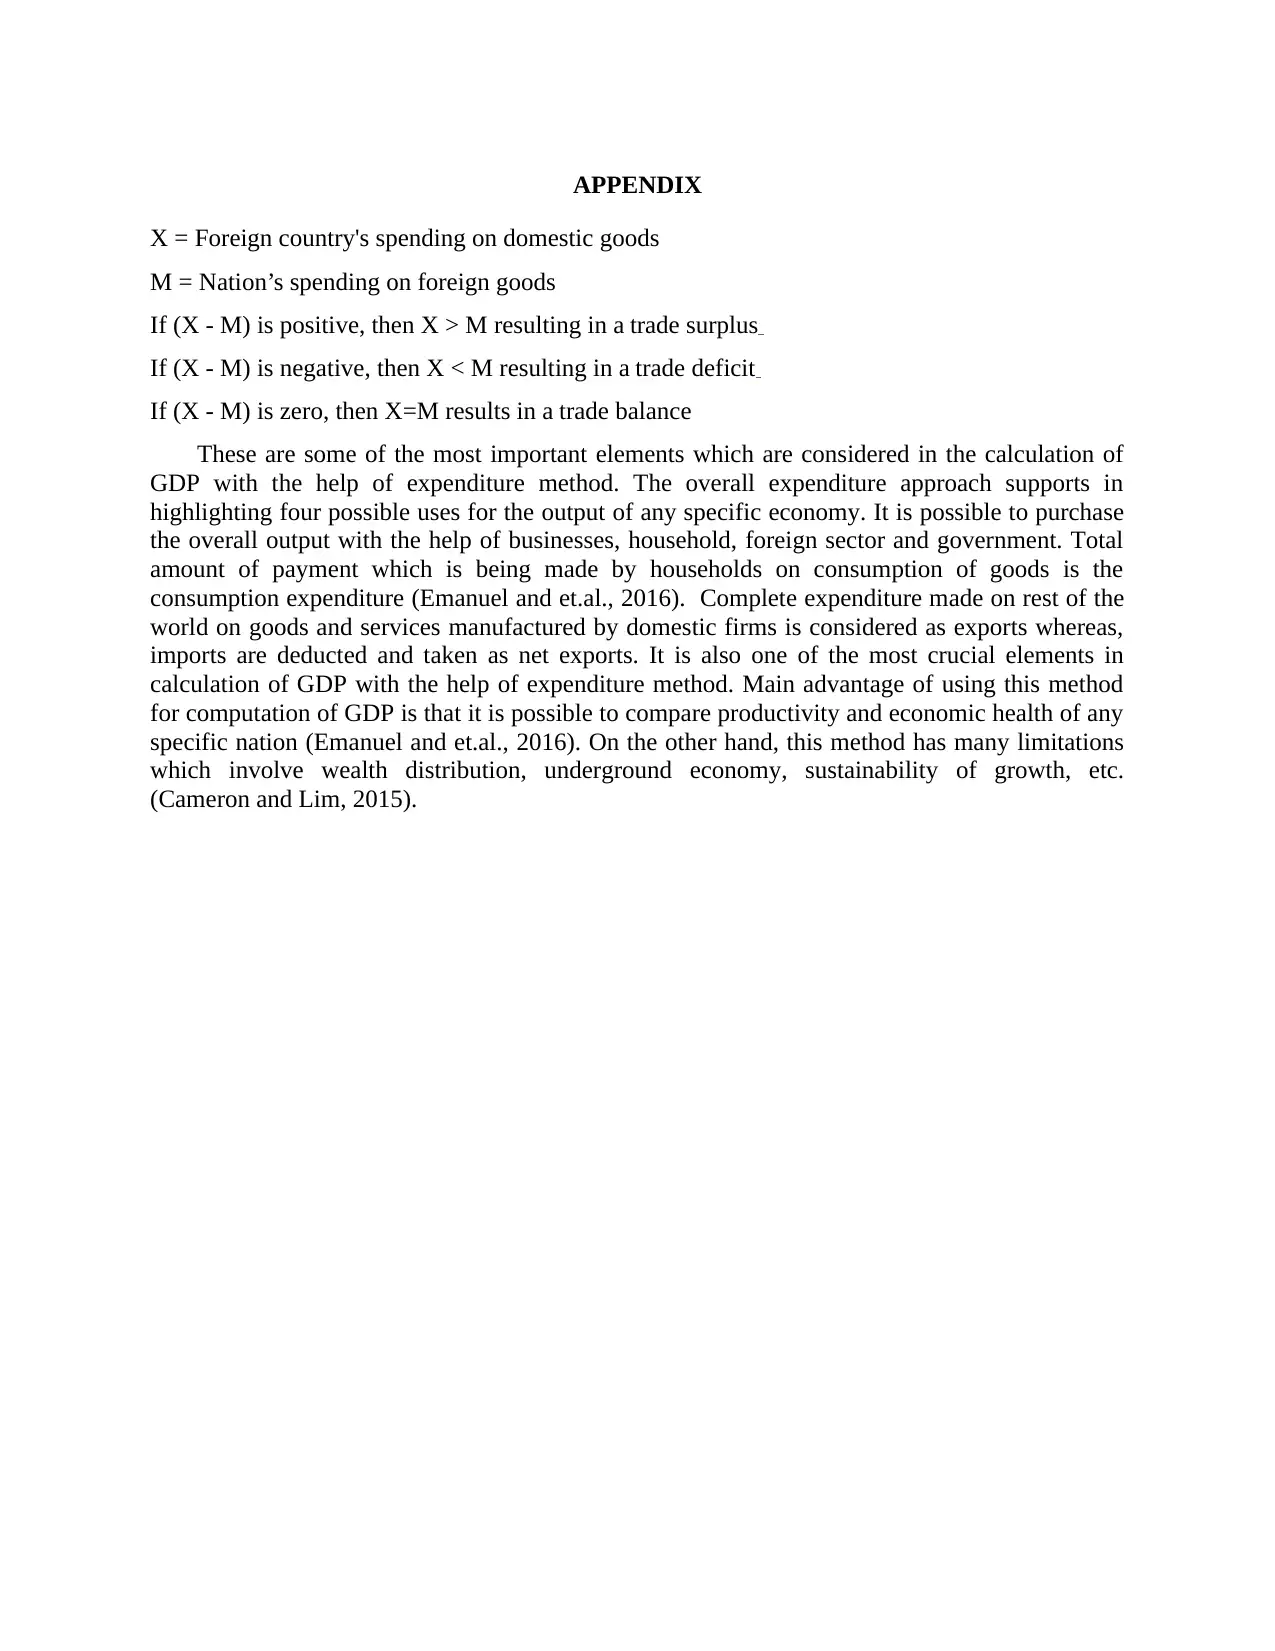
X = Foreign country's spending on domestic goods
M = Nation’s spending on foreign goods
If (X - M) is positive, then X > M resulting in a trade surplus
If (X - M) is negative, then X < M resulting in a trade deficit
If (X - M) is zero, then X=M results in a trade balance
These are some of the most important elements which are considered in the calculation of
GDP with the help of expenditure method. The overall expenditure approach supports in
highlighting four possible uses for the output of any specific economy. It is possible to purchase
the overall output with the help of businesses, household, foreign sector and government. Total
amount of payment which is being made by households on consumption of goods is the
consumption expenditure (Emanuel and et.al., 2016). Complete expenditure made on rest of the
world on goods and services manufactured by domestic firms is considered as exports whereas,
imports are deducted and taken as net exports. It is also one of the most crucial elements in
calculation of GDP with the help of expenditure method. Main advantage of using this method
for computation of GDP is that it is possible to compare productivity and economic health of any
specific nation (Emanuel and et.al., 2016). On the other hand, this method has many limitations
which involve wealth distribution, underground economy, sustainability of growth, etc.
(Cameron and Lim, 2015).
1 out of 11
Related Documents


Your All-in-One AI-Powered Toolkit for Academic Success.
+13062052269
info@desklib.com
Available 24*7 on WhatsApp / Email
![[object Object]](/_next/static/media/star-bottom.7253800d.svg)
Unlock your academic potential
Copyright © 2020–2026 A2Z Services. All Rights Reserved. Developed and managed by ZUCOL.