Economics Homework: Analyzing Supply, Demand, and Revenue for Sorbet
VerifiedAdded on  2021/04/17
|16
|2993
|48
Homework Assignment
AI Summary
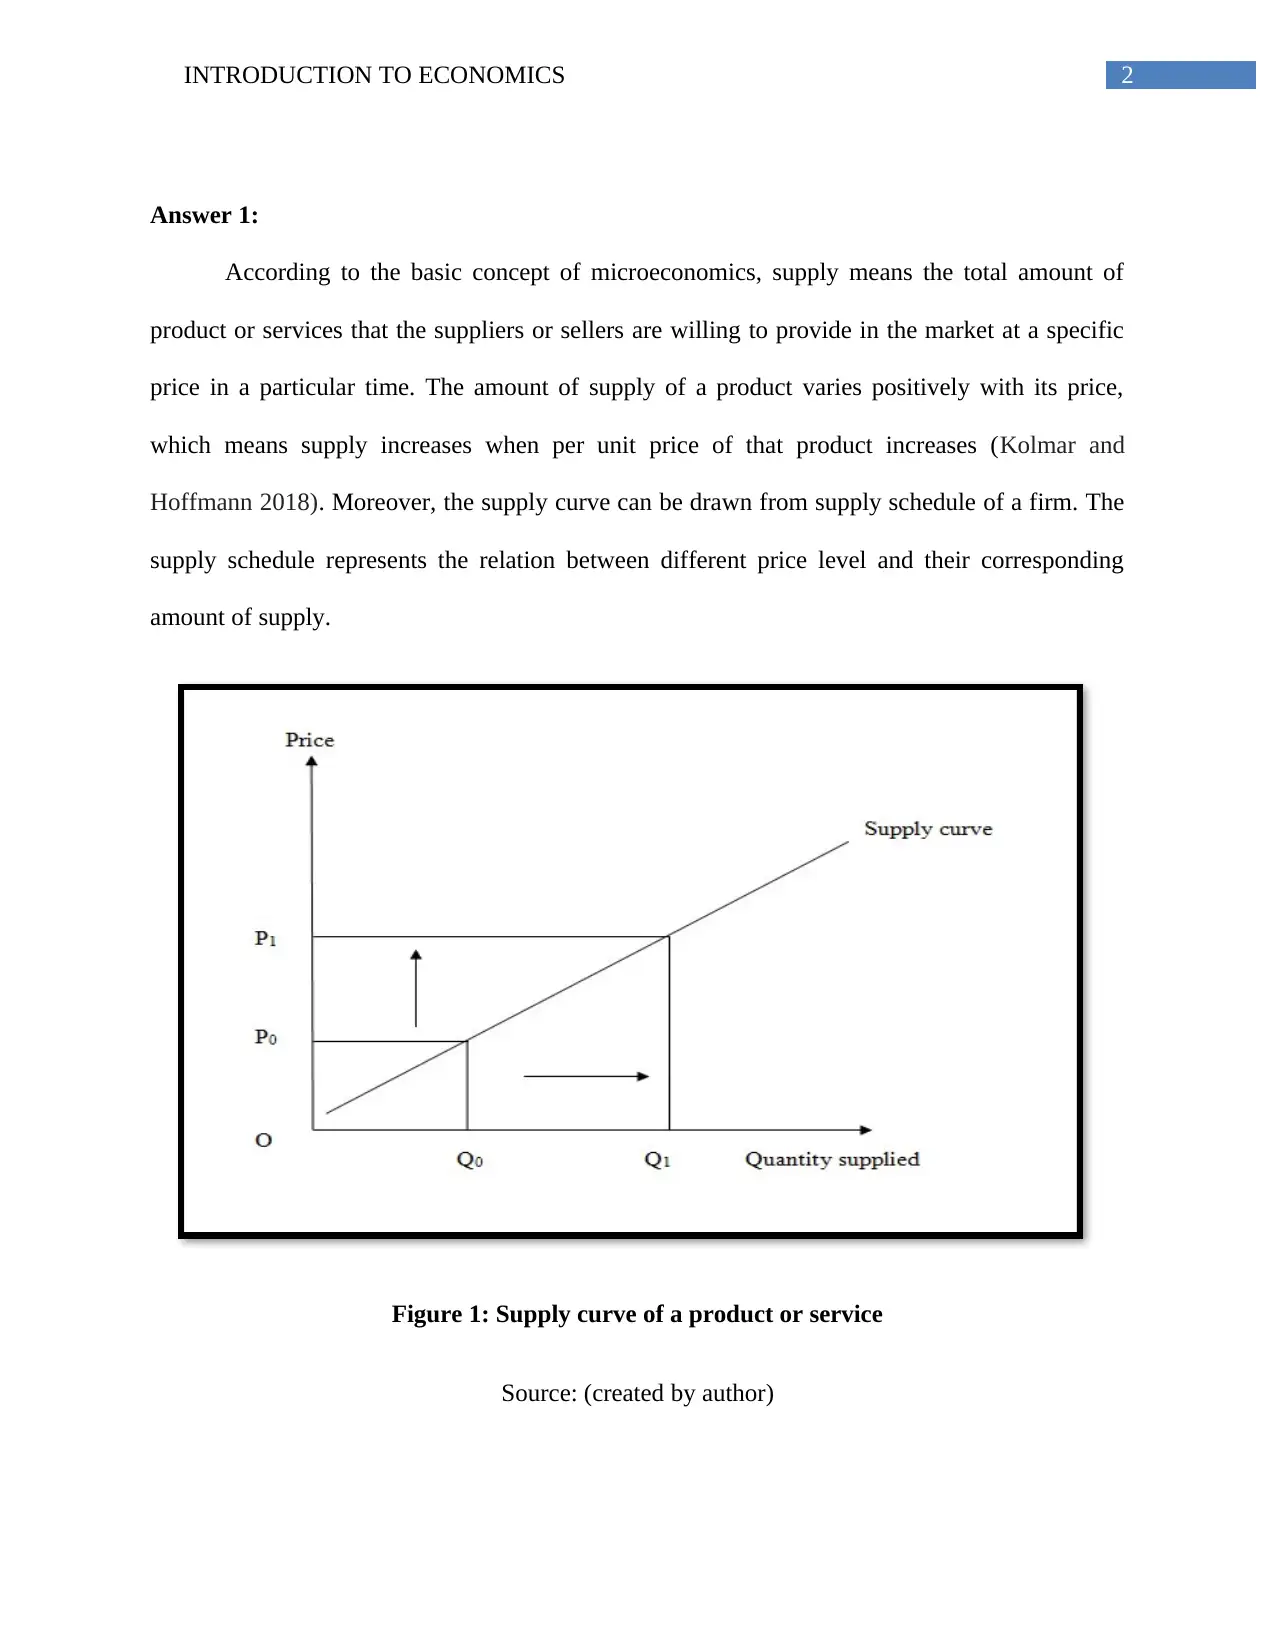
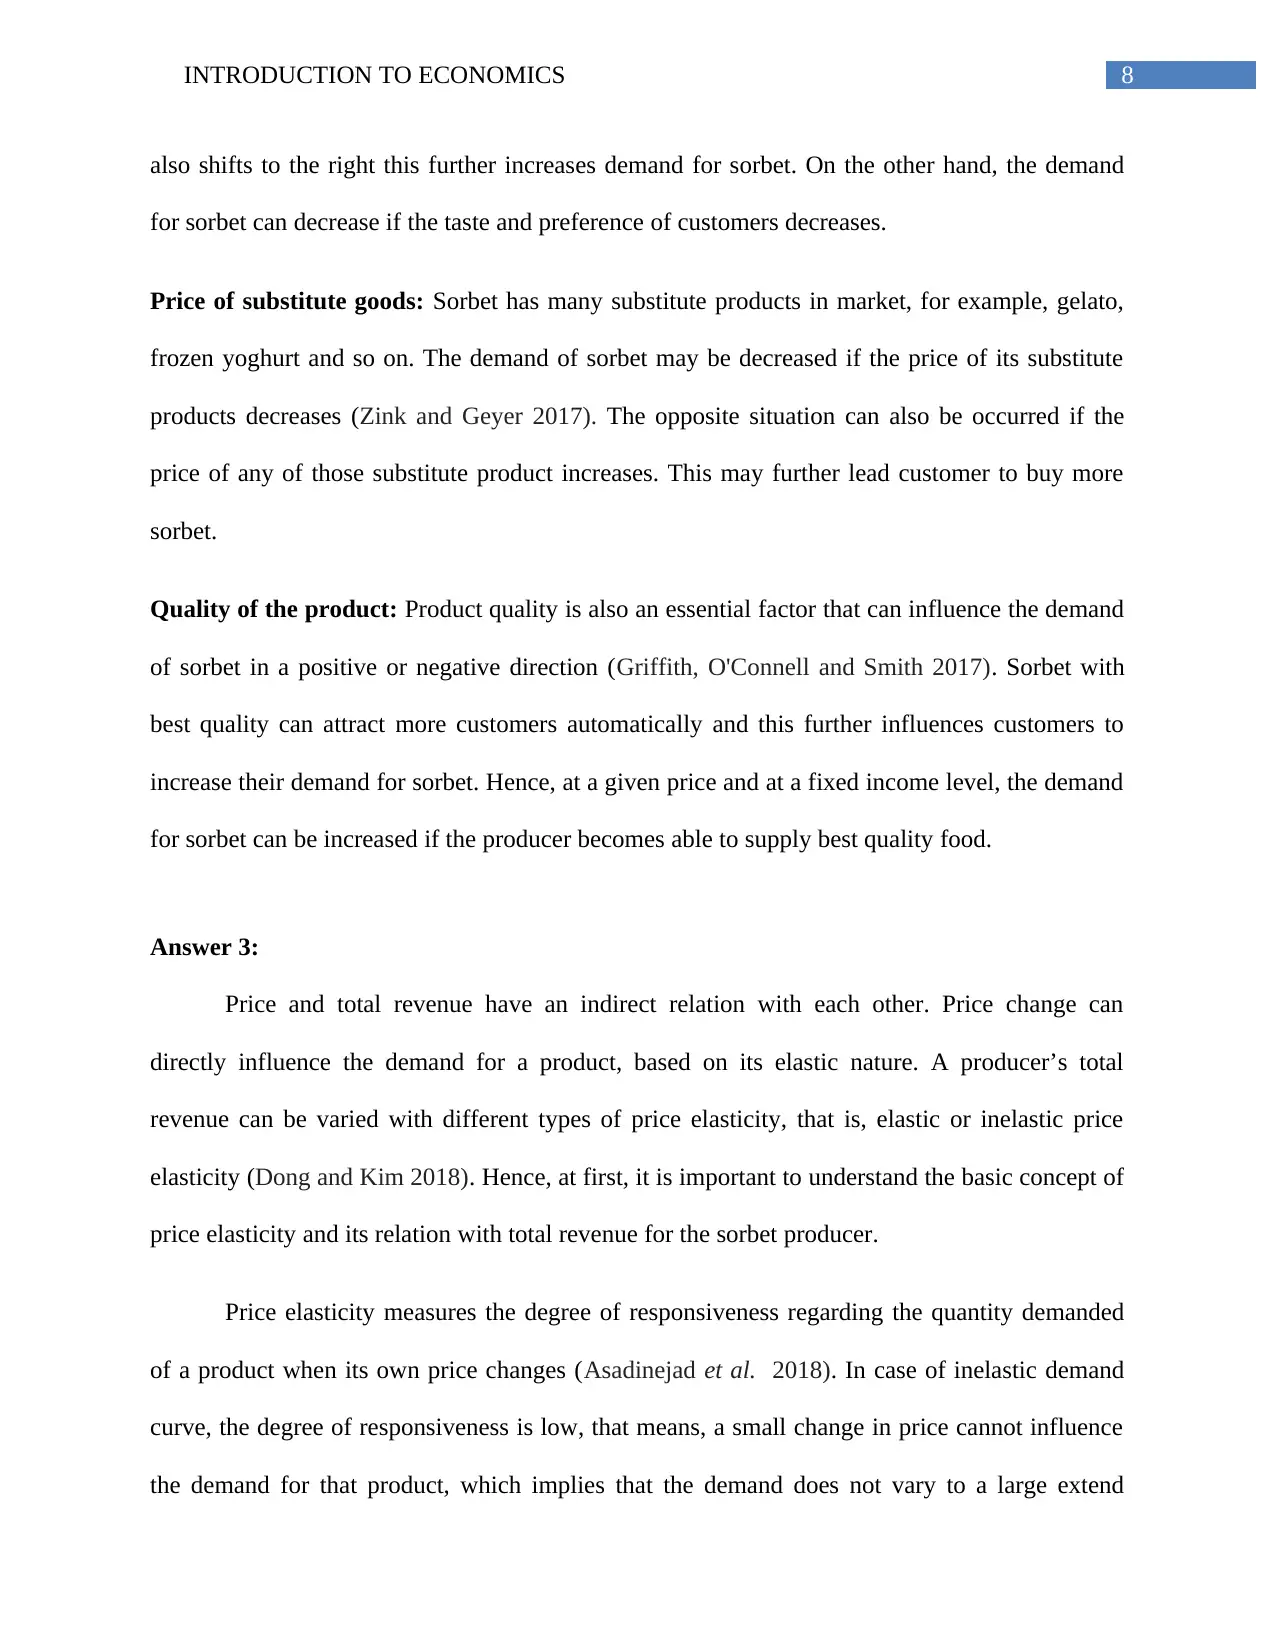
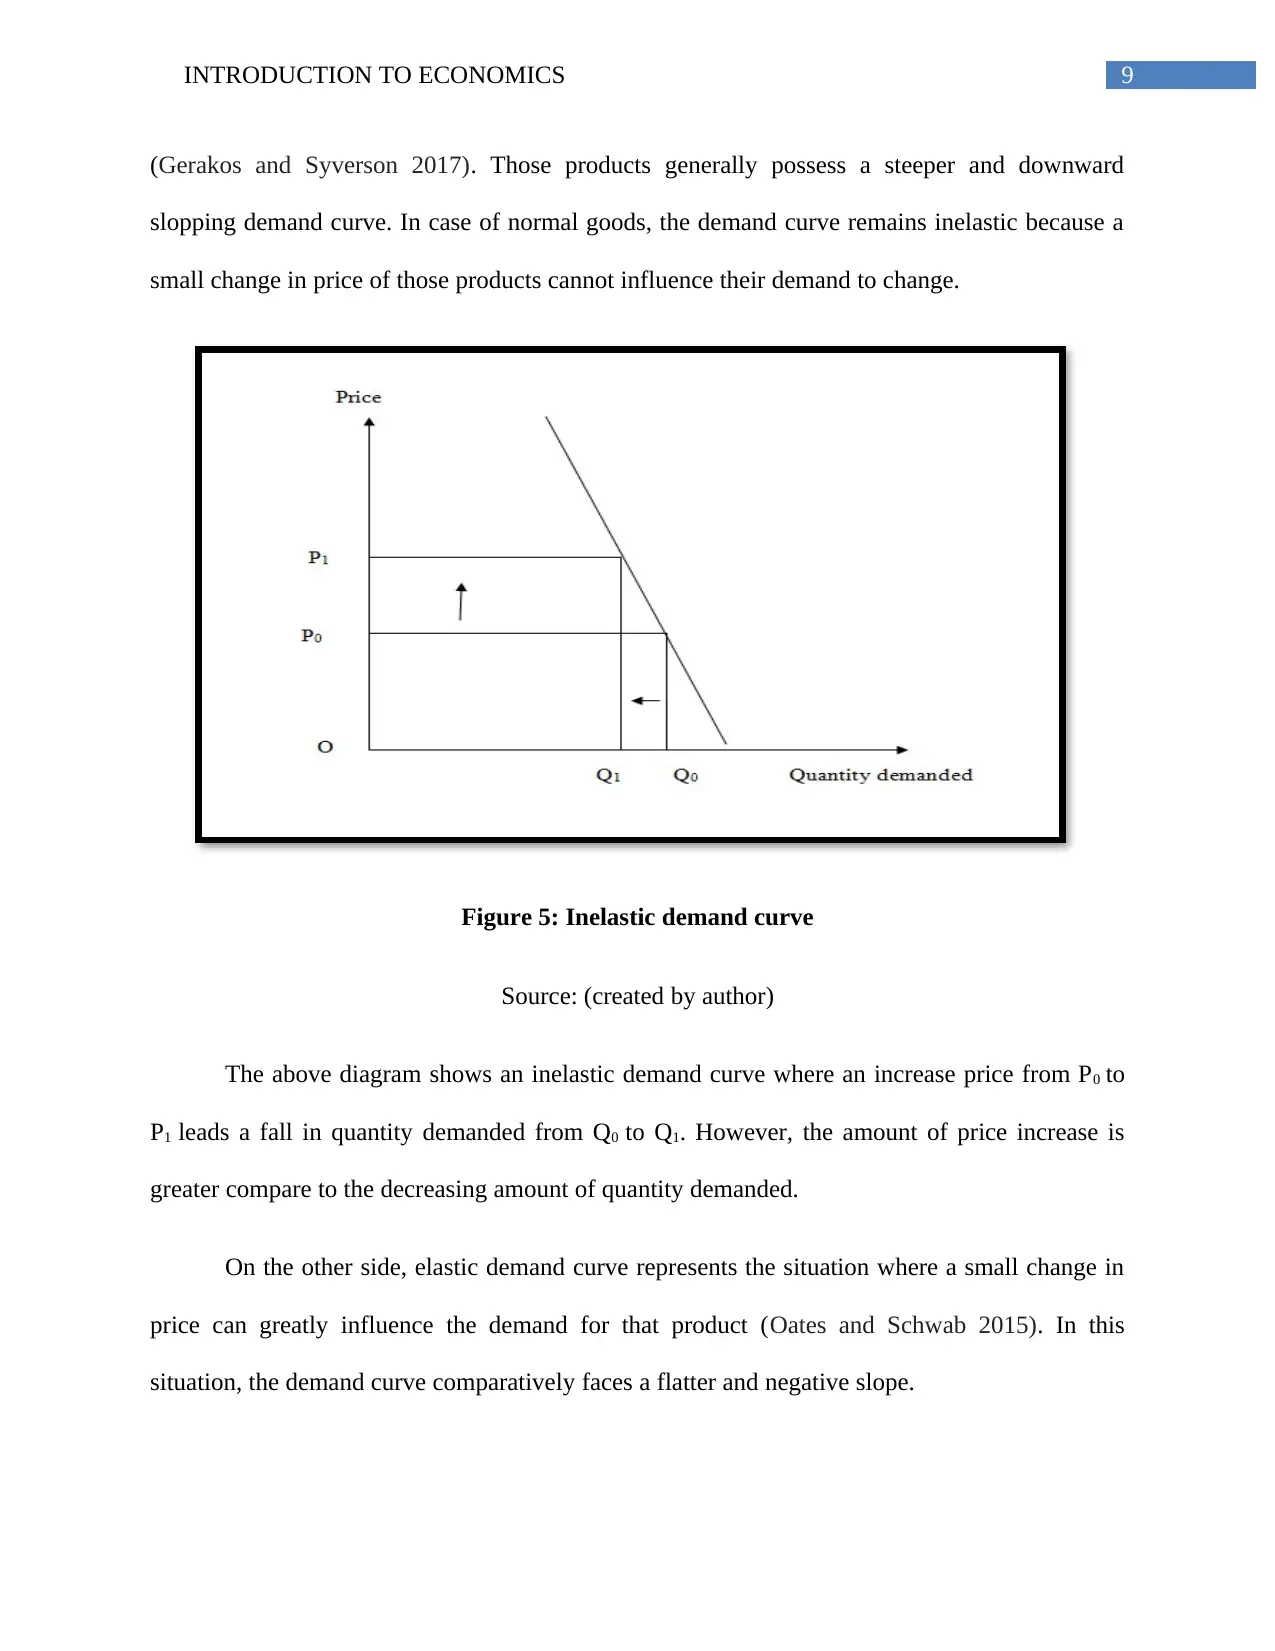
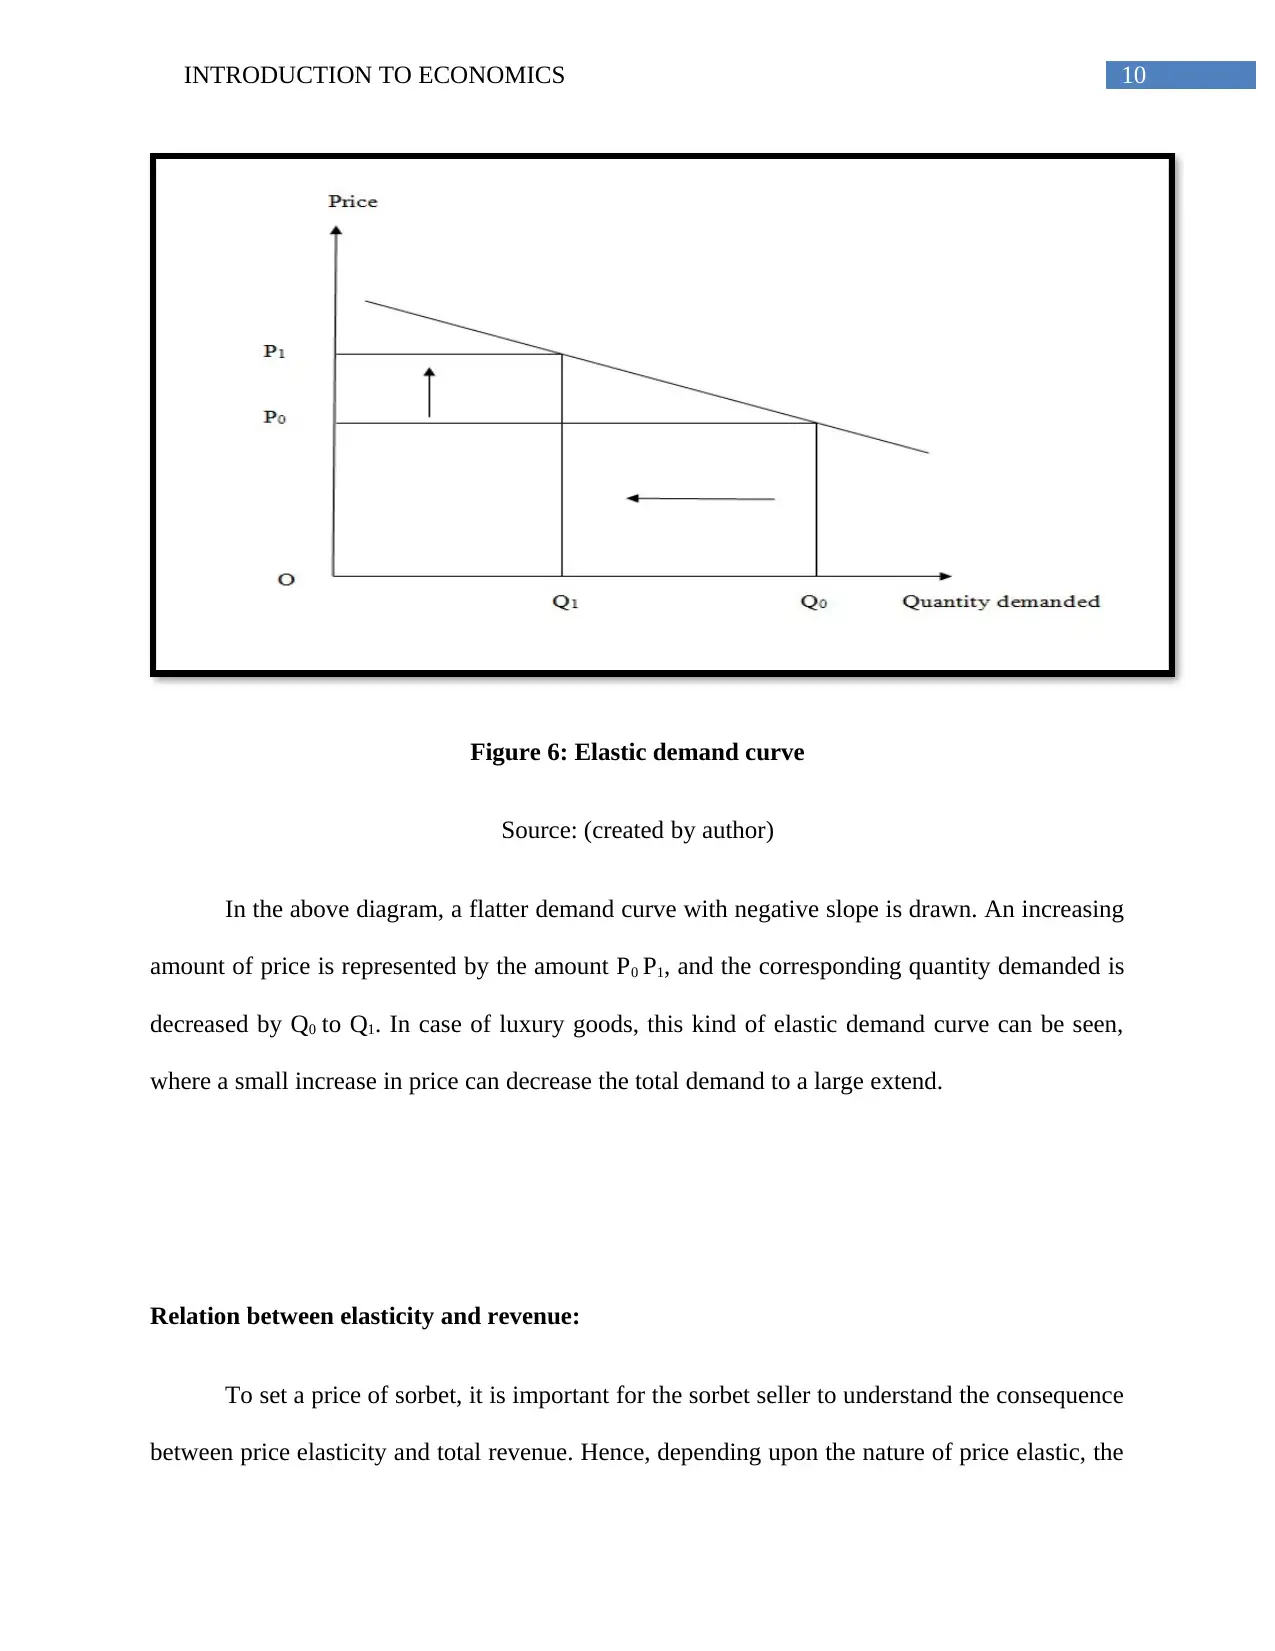
This economics assignment delves into fundamental microeconomic concepts, examining supply, demand, and revenue within the context of the sorbet market. The assignment begins by defining supply and its determinants, including input costs, technology, labor productivity, and the number of sellers, illustrating these concepts with supply curve diagrams. It then explores demand, emphasizing the inverse relationship between price and quantity demanded, and analyzes factors influencing demand such as consumer income, tastes, preferences, the price of substitute goods, and product quality, supported by relevant diagrams. Finally, the assignment investigates the relationship between price elasticity and total revenue, differentiating between elastic and inelastic demand curves, and explaining how price changes impact revenue generation. The analysis includes the point elasticity of demand and concludes with a discussion on how substitute products influence demand, reinforcing the principles of marginal utility and consumer behavior.
Contribute Materials
Your contribution can guide someone’s learning journey. Share your
documents today.

Running head: INTRODUCTION TO ECONOMICS
Introduction to economics
Name of the university
Name of the student
Author Note
Introduction to economics
Name of the university
Name of the student
Author Note
Secure Best Marks with AI Grader
Need help grading? Try our AI Grader for instant feedback on your assignments.

1INTRODUCTION TO ECONOMICS
Table of Contents
Answer 1:.........................................................................................................................................2
Answer 2:.........................................................................................................................................4
Answer 3:.........................................................................................................................................8
Reference:......................................................................................................................................13

2INTRODUCTION TO ECONOMICS
Answer 1:
According to the basic concept of microeconomics, supply means the total amount of
product or services that the suppliers or sellers are willing to provide in the market at a specific
price in a particular time. The amount of supply of a product varies positively with its price,
which means supply increases when per unit price of that product increases (Kolmar and
Hoffmann 2018). Moreover, the supply curve can be drawn from supply schedule of a firm. The
supply schedule represents the relation between different price level and their corresponding
amount of supply.
Figure 1: Supply curve of a product or service
Source: (created by author)

3INTRODUCTION TO ECONOMICS
It can be stated from the above diagram that supply curve is upward rising with positive
slope. As, price of a commodity increases from P0 to P1, the quantity supplied of a firm also
increases from Q0 to Q1. Hence, the above curve has successfully represented a positive
relationship between price and quantity supplied of any product or service. .
In general, every seller knows that price can influence the supply of a product directly.
However, it is sometimes become difficult to analyse other factors that also can influence supply
of a product directly or indirectly (Fujii, Okamoto, Kagawa and Managi 2017). In case of sorbet,
supply can be influenced by changing its input costs, technology, labour productivity and
number of other sellers that are also supplying same type of products.
Input costs of sorbet: To produce and sell sorbets, a producer needs labourers, machineries, raw
materials and factory. The producer may supply less amount of sorbet at the given price if input
costs of production vary. Those input costs include wage rate of labourers, price of machine and
raw materials and rent of factory increase. The opposite situation can occur if the input costs
decrease (Paravisini, Rappoport, Schnabl and Wolfenzon 2014). This affect can be described
with the help of figure 2, which is drawn below.
Secure Best Marks with AI Grader
Need help grading? Try our AI Grader for instant feedback on your assignments.

4INTRODUCTION TO ECONOMICS
Figure 2: Change in supply of Sorbet
Source: (created by author)
In figure, the initial supply curve, at a given price P0, is S0. When, the input costs increase,
the supply curve shifts to the left that further decreases the supply of sorbets by Q1Q0 unit.
Technology: Technology helps a producer to produce more outputs with given factors of
production. Here, sorbet producer also can increase total supply of this desert if new and modern
technology is adopted (Fan, Tao, Deng and Li 2015). This can further shift the supply curve to
the right, that is, from S0 to S2, in figure 2, and as a consequence, the producer increases the
supply of sorbet by Q0Q2 amount, at price P0.
Labour productivity: Total amount of sorbet supply can be changed due to labour productivity.
With given technology and other resources, productivity level of a worker can be changed due
their working skills. With more knowledge and experience, a labour can produce more output
(Blatter, Muehlemann, Schenker and Wolter 2015). Hence, by employing skilled workers, the
producer can supply more sorbet with limited resources and technology.

5INTRODUCTION TO ECONOMICS
Number of other sorbet sellers: The number of sorbet sellers may remain high under a
competitive market environment (Kocas, Pauwels and Bohlmann 2018). Thus, to attract more
customers, the producer can offer same amount of sorbets with comparatively low price. This
will shift the supply curve to the right.
Answer 2:
The concept of demand comes from a customer’s perspective. According to the demand
law, a consumer generally demands more amount of a commodity when its price goes down.
Thus unlike supply, demand presents an inverse relationship with its own price (Kolmar and
Hoffmann 2018). Thus, to represent this negative relation, the demand curve always faces a
downward slopping curve.
Figure 3: Demand curve of a product
Source: (created by author)

6INTRODUCTION TO ECONOMICS
The above diagram is representing the negative relation between price and quantity
demand for a product. As price goes high, that is, P0 to P1, the amount of quantity demanded goes
down by Q0 to Q1 amount.
Hence, from this definition, it can be stated clearly that price plays an important role to
determine demand for any commodity or service and this is true for sorbet, as well. However,
some other factors can also influence the demand for sorbets in a market (Fazlollahi and Franke
2018). Those factors are income of the consumer, tastes and preferences of customers, price of
substitute goods, and quality of the product.
Income of sorbet consumers: Consumers are the most important factor of any production
process. If the income of a customer increases, the person can demand more amount of sorbet at
the given price and the opposite situation can also be happened if the income decreases (Dubé,
Hitsch and Rossi 2018). Thus, the demand for sorbet can be changed positively or negatively
when price of that product remains unchanged. This situation can be presented clearly with help
of a suitable diagram.
Paraphrase This Document
Need a fresh take? Get an instant paraphrase of this document with our AI Paraphraser

7INTRODUCTION TO ECONOMICS
Figure 4: Change in demand for Sorbet
Source: (created by author)
It can be stated from the above diagram that the demand curve for sorbet can shift to the
right, that is, from D0 to D2 at the given price level P0 if the income of customer increases. The
opposite situation can also be seen if the income of a customer decreases and in that situation,
demand decreases by D0 D1 amount.
Tastes and preferences of customers: The demand for sorbet can also be changed if the taste
and preference of customer for this particular commodity changes. If the taste and preference of
a customer increases then the person can buy more sorbets even if the amount of price and
income remain unchanged (Escobar, Kallas and Gil 2018). In this situation, the demand curve

8INTRODUCTION TO ECONOMICS
also shifts to the right this further increases demand for sorbet. On the other hand, the demand
for sorbet can decrease if the taste and preference of customers decreases.
Price of substitute goods: Sorbet has many substitute products in market, for example, gelato,
frozen yoghurt and so on. The demand of sorbet may be decreased if the price of its substitute
products decreases (Zink and Geyer 2017). The opposite situation can also be occurred if the
price of any of those substitute product increases. This may further lead customer to buy more
sorbet.
Quality of the product: Product quality is also an essential factor that can influence the demand
of sorbet in a positive or negative direction (Griffith, O'Connell and Smith 2017). Sorbet with
best quality can attract more customers automatically and this further influences customers to
increase their demand for sorbet. Hence, at a given price and at a fixed income level, the demand
for sorbet can be increased if the producer becomes able to supply best quality food.
Answer 3:
Price and total revenue have an indirect relation with each other. Price change can
directly influence the demand for a product, based on its elastic nature. A producer’s total
revenue can be varied with different types of price elasticity, that is, elastic or inelastic price
elasticity (Dong and Kim 2018). Hence, at first, it is important to understand the basic concept of
price elasticity and its relation with total revenue for the sorbet producer.
Price elasticity measures the degree of responsiveness regarding the quantity demanded
of a product when its own price changes (Asadinejad et al. 2018). In case of inelastic demand
curve, the degree of responsiveness is low, that means, a small change in price cannot influence
the demand for that product, which implies that the demand does not vary to a large extend

9INTRODUCTION TO ECONOMICS
(Gerakos and Syverson 2017). Those products generally possess a steeper and downward
slopping demand curve. In case of normal goods, the demand curve remains inelastic because a
small change in price of those products cannot influence their demand to change.
Figure 5: Inelastic demand curve
Source: (created by author)
The above diagram shows an inelastic demand curve where an increase price from P0 to
P1 leads a fall in quantity demanded from Q0 to Q1. However, the amount of price increase is
greater compare to the decreasing amount of quantity demanded.
On the other side, elastic demand curve represents the situation where a small change in
price can greatly influence the demand for that product (Oates and Schwab 2015). In this
situation, the demand curve comparatively faces a flatter and negative slope.
Secure Best Marks with AI Grader
Need help grading? Try our AI Grader for instant feedback on your assignments.

10INTRODUCTION TO ECONOMICS
Figure 6: Elastic demand curve
Source: (created by author)
In the above diagram, a flatter demand curve with negative slope is drawn. An increasing
amount of price is represented by the amount P0 P1, and the corresponding quantity demanded is
decreased by Q0 to Q1. In case of luxury goods, this kind of elastic demand curve can be seen,
where a small increase in price can decrease the total demand to a large extend.
Relation between elasticity and revenue:
To set a price of sorbet, it is important for the sorbet seller to understand the consequence
between price elasticity and total revenue. Hence, depending upon the nature of price elastic, the

11INTRODUCTION TO ECONOMICS
sorbet seller can change the price level for the purpose of earning higher amount of revenue. As
stated before, a producer cannot charge higher price for those commodities, which have elastic
demand curve (Tauras et al. 2016). Hence, for those products, the opportunity of earning
revenue is comparatively low. On the other side, a producer can charge higher price for those
products, which possess inelastic demand curve. As a small change in price cannot change the
demand for those products to a large extend, it becomes easier for the producer to earn higher
amount of revenue. The point elasticity of demand can describe different forms of elasticity on a
particular demand curve with a specific point. From this concept, the relation between price
elasticity and revenue can be drawn.
Figure 7: Point elasticity of demand
Source: (created by author)
It can be stated from the above diagram that unitary elasticity is occurred at point A and
at this point, the producer can receive the highest amount of revenue. The reason behind this
outcome is that, total revenue cannot be influenced by changing amount of price and the

12INTRODUCTION TO ECONOMICS
consecutive change in output. An inverse relationship between total revenue and price is
obtained when the value of elasticity remains greater than 1, that is, point B and C in figure 7.
Thus, by setting higher amount of price, the producer, in turn, losses the amount of its total
revenue. For inelastic portion, representing by point D and E of the same diagram, a direct
relation between total revenue and price is established where the producer can earn higher
amount of profit by charging more price.
As, sorbet and other similar products have elastic demand curve, where a small change in
price can influence the demand of that product, it becomes very difficult for the producer to
charge higher amount of price. The consumer has other substitute products of sorbet in the
market, which can influence them to shift their preference. Hence, after analysing the entire
decision, the sorbet producer set the decision of charging price of sorbet.
To understand the impacts of substitute products on demand for a commodity, the
relationship between sorbet and its similar products are needed to describe. Consumers always
want to consumer more amount of product when its price has decreased. This inverse
relationship of demand with its price can be derived from the decreasing marginal utility concept
(Allen, Stacey and Bar-Yam 2017). According to this concept, by consuming extra unit of a
product, the level of utility obtained from that particular product decreases. Hence, to consumer
one unit extra of that product, the consumer can pay less amount of money than before. Hence,
the demand for sorbet may be decreased in the market if the price of that product increases, while
price of its related products have remained the same. Increasing amount of price tends the
rational consumers to consume its substitute products. Hence, before setting any price, it is
essential for the sorbet producer to analyse market price of its similar products.
Paraphrase This Document
Need a fresh take? Get an instant paraphrase of this document with our AI Paraphraser

13INTRODUCTION TO ECONOMICS

14INTRODUCTION TO ECONOMICS
Reference:
Allen, B., Stacey, B.C. and Bar-Yam, Y., 2017. Multiscale information theory and the marginal
utility of information. Entropy, 19(6), p.273.
Asadinejad, A., Rahimpour, A., Tomsovic, K., Qi, H. and Chen, C.F., 2018. Evaluation of
residential customer elasticity for incentive based demand response programs. Electric Power
Systems Research, 158, pp.26-36.
Blatter, M., Muehlemann, S., Schenker, S. and Wolter, S.C., 2015. Hiring costs for skilled
workers and the supply of firm-provided training. Oxford economic papers, 68(1), pp.238-257.
Dong, J. and Kim, Y.D., 2018. PRICE ELASTICITY OF ELECTRICITY DEMAND WITH
TEMPERATURE EFFECT IN SOUTH KOREA: EMPIRICAL EVIDENCE. ISSN 2168-0612
FLASH DRIVE ISSN 1941-9589 ONLINE, p.219.
Dubé, J.P., Hitsch, G.J. and Rossi, P.E., 2018. Income and wealth effects on private-label
demand: evidence from the great recession. Marketing Science.
Escobar, C., Kallas, Z. and Gil, J.M., 2018. Consumers’ wine preferences in a changing
scenario. British Food Journal, 120(1), pp.18-32.
Fan, T., Tao, F., Deng, S. and Li, S., 2015. Impact of RFID technology on supply chain decisions
with inventory inaccuracies. International Journal of Production Economics, 159, pp.117-125.
Fazlollahi, A. and Franke, U., 2018. Measuring the impact of enterprise integration on firm
performance using data envelopment analysis. International Journal of Production Economics.

15INTRODUCTION TO ECONOMICS
Fujii, H., Okamoto, S., Kagawa, S. and Managi, S., 2017. Decomposition of toxicity emission
changes on the demand and supply sides: empirical study of the US industrial
sector. Environmental Research Letters, 12(12), p.124008.
Gerakos, J. and Syverson, C., 2017. Audit firms face downward-sloping demand curves and the
audit market is far from perfectly competitive. Review of Accounting Studies, 22(4), pp.1582-
1594.
Griffith, R., O'Connell, M. and Smith, K., 2017. The importance of product reformulation versus
consumer choice in improving diet quality. Economica, 84(333), pp.34-53.
Kocas, C., Pauwels, K. and Bohlmann, J.D., 2018. Pricing Best Sellers and Traffic Generators:
The Role of Asymmetric Cross-selling. Journal of Interactive Marketing, 41, pp.28-43.
Kolmar, M. and Hoffmann, M., 2018. Supply and Demand. In Workbook for Principles of
Microeconomics (pp. 27-41). Springer, Cham.
Oates, W.E. and Schwab, R.M., 2015. The window tax: A case study in excess burden. Journal
of Economic Perspectives, 29(1), pp.163-80.
Paravisini, D., Rappoport, V., Schnabl, P. and Wolfenzon, D., 2014. Dissecting the effect of
credit supply on trade: Evidence from matched credit-export data. The Review of Economic
Studies, 82(1), pp.333-359.
Tauras, J.A., Pesko, M.F., Huang, J., Chaloupka, F.J. and Farrelly, M.C., 2016. The effect of
cigarette prices on cigarette sales: exploring heterogeneity in price elasticities at high and low
prices (No. w22251). national bureau of economic research.
1 out of 16
Related Documents

Your All-in-One AI-Powered Toolkit for Academic Success.
 +13062052269
info@desklib.com
Available 24*7 on WhatsApp / Email
Unlock your academic potential
© 2024  |  Zucol Services PVT LTD  |  All rights reserved.