Economics Quiz 3: Analyzing Tax Impact on Economic Models

Verified

Added on  2021/06/15

|7
|874
|42
Homework Assignment
AI Summary
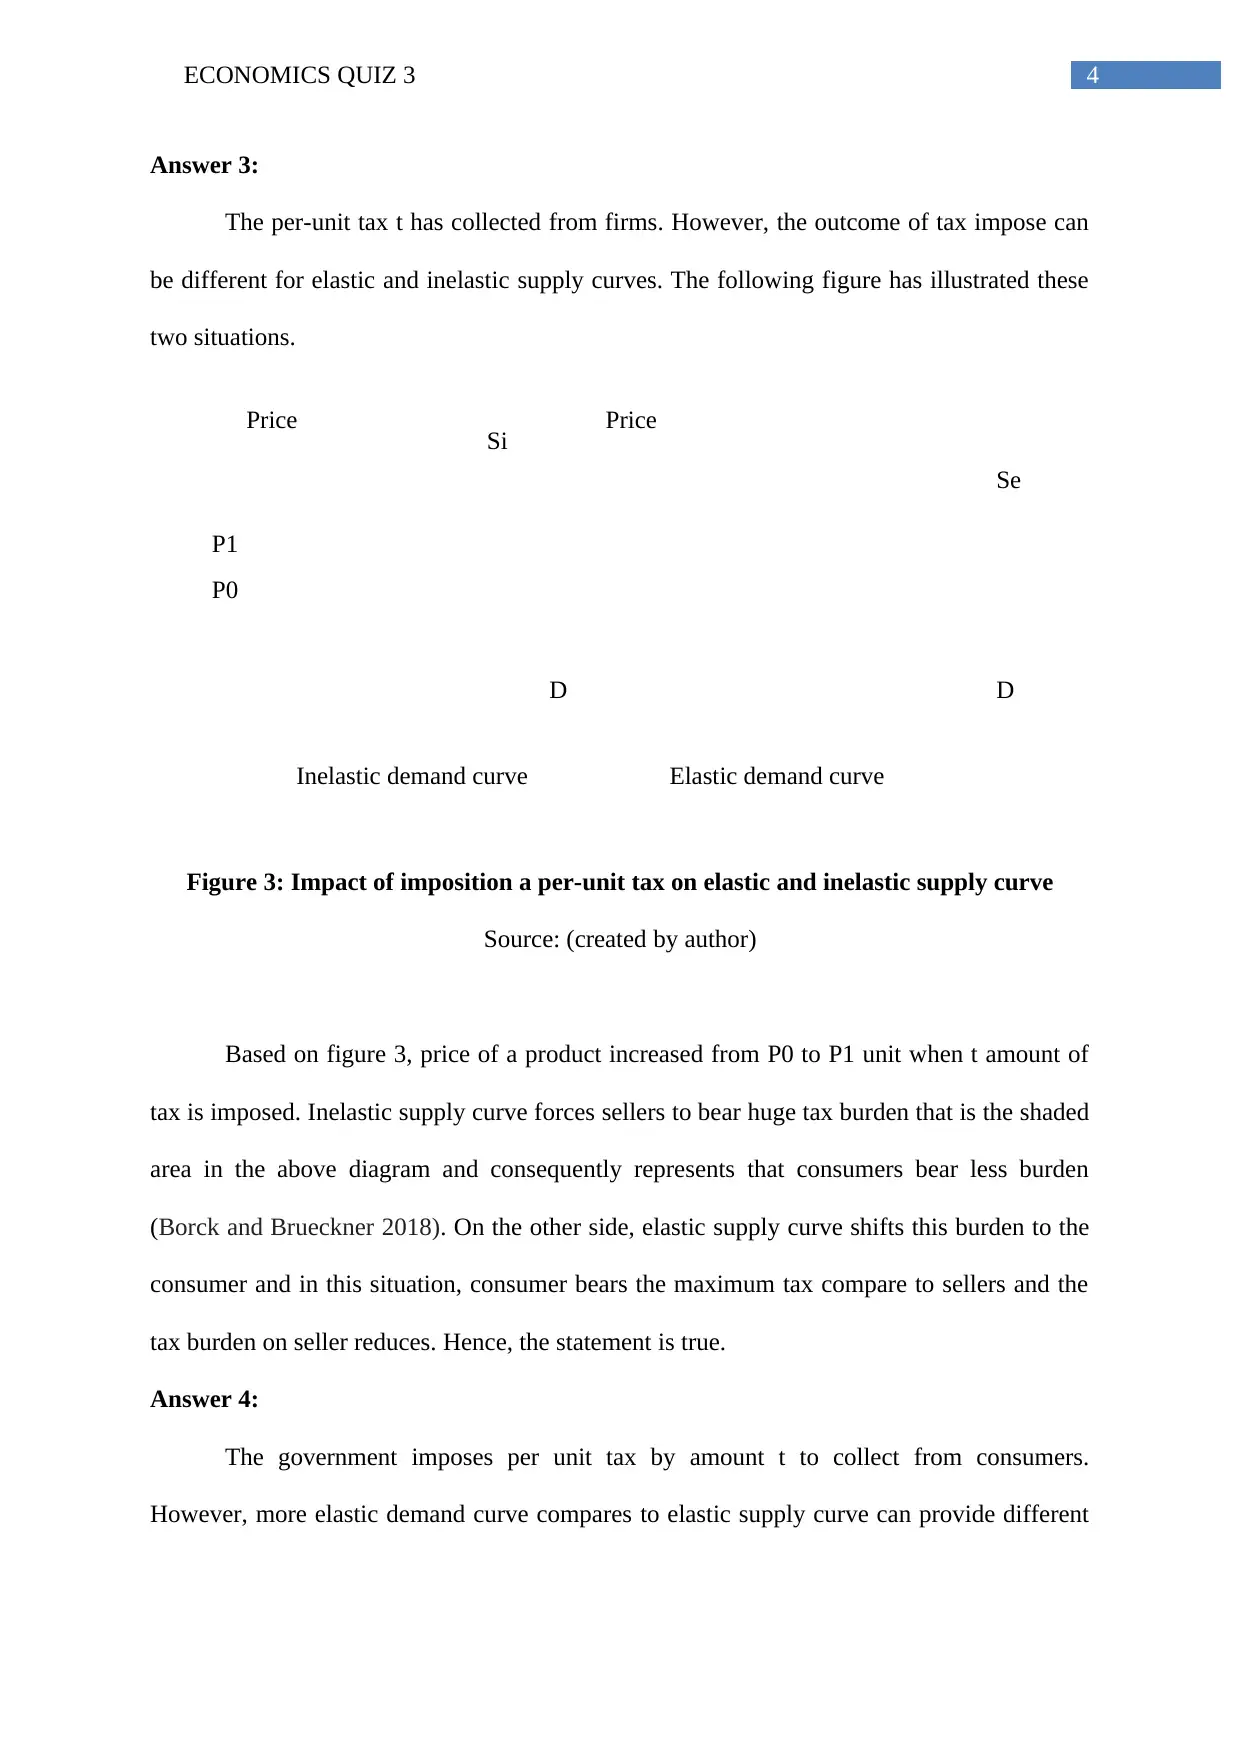
This economics quiz addresses the effects of per-unit taxes on market dynamics, including the concepts of elasticity, deadweight loss, and tax burden distribution. The quiz examines how per-unit taxes shift supply and demand curves, impacting prices and quantities in both elastic and inelastic demand scenarios. The solutions analyze the consequences of these taxes on consumers and producers, differentiating between scenarios where the demand curve is more or less elastic than the supply curve. Figures are included to visually represent the impact of taxes, illustrating deadweight loss, consumer and producer burdens, and shifts in supply and demand curves. The analysis considers different elasticity scenarios and their implications for tax incidence and market outcomes, providing a comprehensive understanding of how per-unit taxes affect economic models. The quiz also explores how governments use per-unit taxes to influence consumer behavior, such as in the case of taxes on sugar consumption, and how these taxes can affect market equilibrium and the overall economic welfare.
Document Page
Running head: ECONOMICS QUIZ 3
Economics quiz 3
Name of the student
Name of the university
Author Note
tabler-icon-diamond-filled.svg

Paraphrase This Document

Need a fresh take? Get an instant paraphrase of this document with our AI Paraphraser
Document Page
1ECONOMICS QUIZ 3
Table of Contents
Answer 1:...................................................................................................................................2
Answer 2:...................................................................................................................................3
Answer 3:...................................................................................................................................4
Answer 4:...................................................................................................................................4
References:.................................................................................................................................6
Document Page
2ECONOMICS QUIZ 3
Price Price
O O
Output Output
S
S+t
S
S+t
De
Di
P1
P0
Deadweight loss
Deadweight loss
Elastic demand curve Inelastic demand curve
Answer 1:
Per unit tax is a fixed amount of tax, imposed on a seller, for each unit of product it
sells. Hence, it is proportional to the certain amount of product sold, without considering
price. Hence, total price of a unit of output increases and this shifts the supply curve upward
(Borck and Brueckner 2018).
Figure 1: deadweight loss after imposition of per-unit tax
Source: (created by author)
The above figure has represented impact of per-unit tax impose on both elastic and
inelastic demand curve. After imposition of tax, supply curve for both cases has shifted from
to S to (S+t) unit and this in turn has led the price of product to increase by P0P1 unit.
However, it can be stated from the above figure that amount of deadweight loss is higher for
elastic demand curve while for inelastic demand curve, this amount is low. Hence, the
statement is true.
Deadweight loss implies the fall in total surplus due to market distortion like tax. For
elastic demand curve, people decrease their quantity demanded by large amount when price
increase in comparatively small amount and the market experience more losses.
Document Page
3ECONOMICS QUIZ 3
Price Price
O O
Output Output
S S
Di
Elastic demand curve
Inelastic demand curve
P0
P1
Q0 Q0Q1 Q2
De
Answer 2:
The Tasmanian government has collected per unit tax on food products from the
consumers for reducing consumption of sugar. Hence, this tax has forced the price of those
foods to increase further by shifting the demand curve in a downward direction and
consequently total consumption can decrease further (Ihori 2017). However, this amount of
reduction can be different for elastic and inelastic demand curve and this can be represented
by the following figure.
Figure 2: Impact on consumer demand after imposition of per-unit tax
Source: (created by author)
According to the above figure, the amount of total decrease in the sugar consumption
due to per-unit tax collected from the consumers is higher when the demand curve is elastic,
which is, from Q0 to Q1, while for inelastic demand curve, this amount is Q0 to Q2. Based
on figure 2, Q0Q1> Q0Q2. Hence, the statement is true.
tabler-icon-diamond-filled.svg

Paraphrase This Document

Need a fresh take? Get an instant paraphrase of this document with our AI Paraphraser
Document Page
4ECONOMICS QUIZ 3
P0
P1
Inelastic demand curve Elastic demand curve
D D
Si
Se
Price Price
Answer 3:
The per-unit tax t has collected from firms. However, the outcome of tax impose can
be different for elastic and inelastic supply curves. The following figure has illustrated these
two situations.
Figure 3: Impact of imposition a per-unit tax on elastic and inelastic supply curve
Source: (created by author)
Based on figure 3, price of a product increased from P0 to P1 unit when t amount of
tax is imposed. Inelastic supply curve forces sellers to bear huge tax burden that is the shaded
area in the above diagram and consequently represents that consumers bear less burden
(Borck and Brueckner 2018). On the other side, elastic supply curve shifts this burden to the
consumer and in this situation, consumer bears the maximum tax compare to sellers and the
tax burden on seller reduces. Hence, the statement is true.
Answer 4:
The government imposes per unit tax by amount t to collect from consumers.
However, more elastic demand curve compares to elastic supply curve can provide different
Document Page
5ECONOMICS QUIZ 3
P0
P1
S
S
De Di
Price Price
O Output OutputQe QeQ1 Q2
More Elastic demand curve Less elastic demand curve
TBC
TBS
outcomes while the demand curve becomes less elastic demand compare the supply curve
(Ihori 2017).
Figure 4: More elastic and less elastic demand curve compare to the elastic supply curve
Source: (created by author)
Figure 4 has represented two demand curves where one curve is more elastic than the
supply curve while the other is less elastic. According this figure, tax burden on consumer is
higher when demand curve is inelastic. Hence, the given statement is wrong and for more
elastic demand curve, sellers pay more bill than consumers do.
Document Page
6ECONOMICS QUIZ 3
References:
Borck, R. and Brueckner, J.K., 2018. Optimal energy taxation in cities. Journal of the
Association of Environmental and Resource Economists, 5(2), pp.481-516.
Ihori, T., 2017. The Theory of Taxation. In Principles of Public Finance (pp. 205-227).
Springer, Singapore.
chevron_up_icon
1 out of 7
circle_padding
hide_on_mobile
zoom_out_icon
[object Object]