Economics Assignment: The Impact of Elasticity on Tax Burden Analysis

Verified

Added on  2022/09/28

|6
|683
|20
Homework Assignment
AI Summary
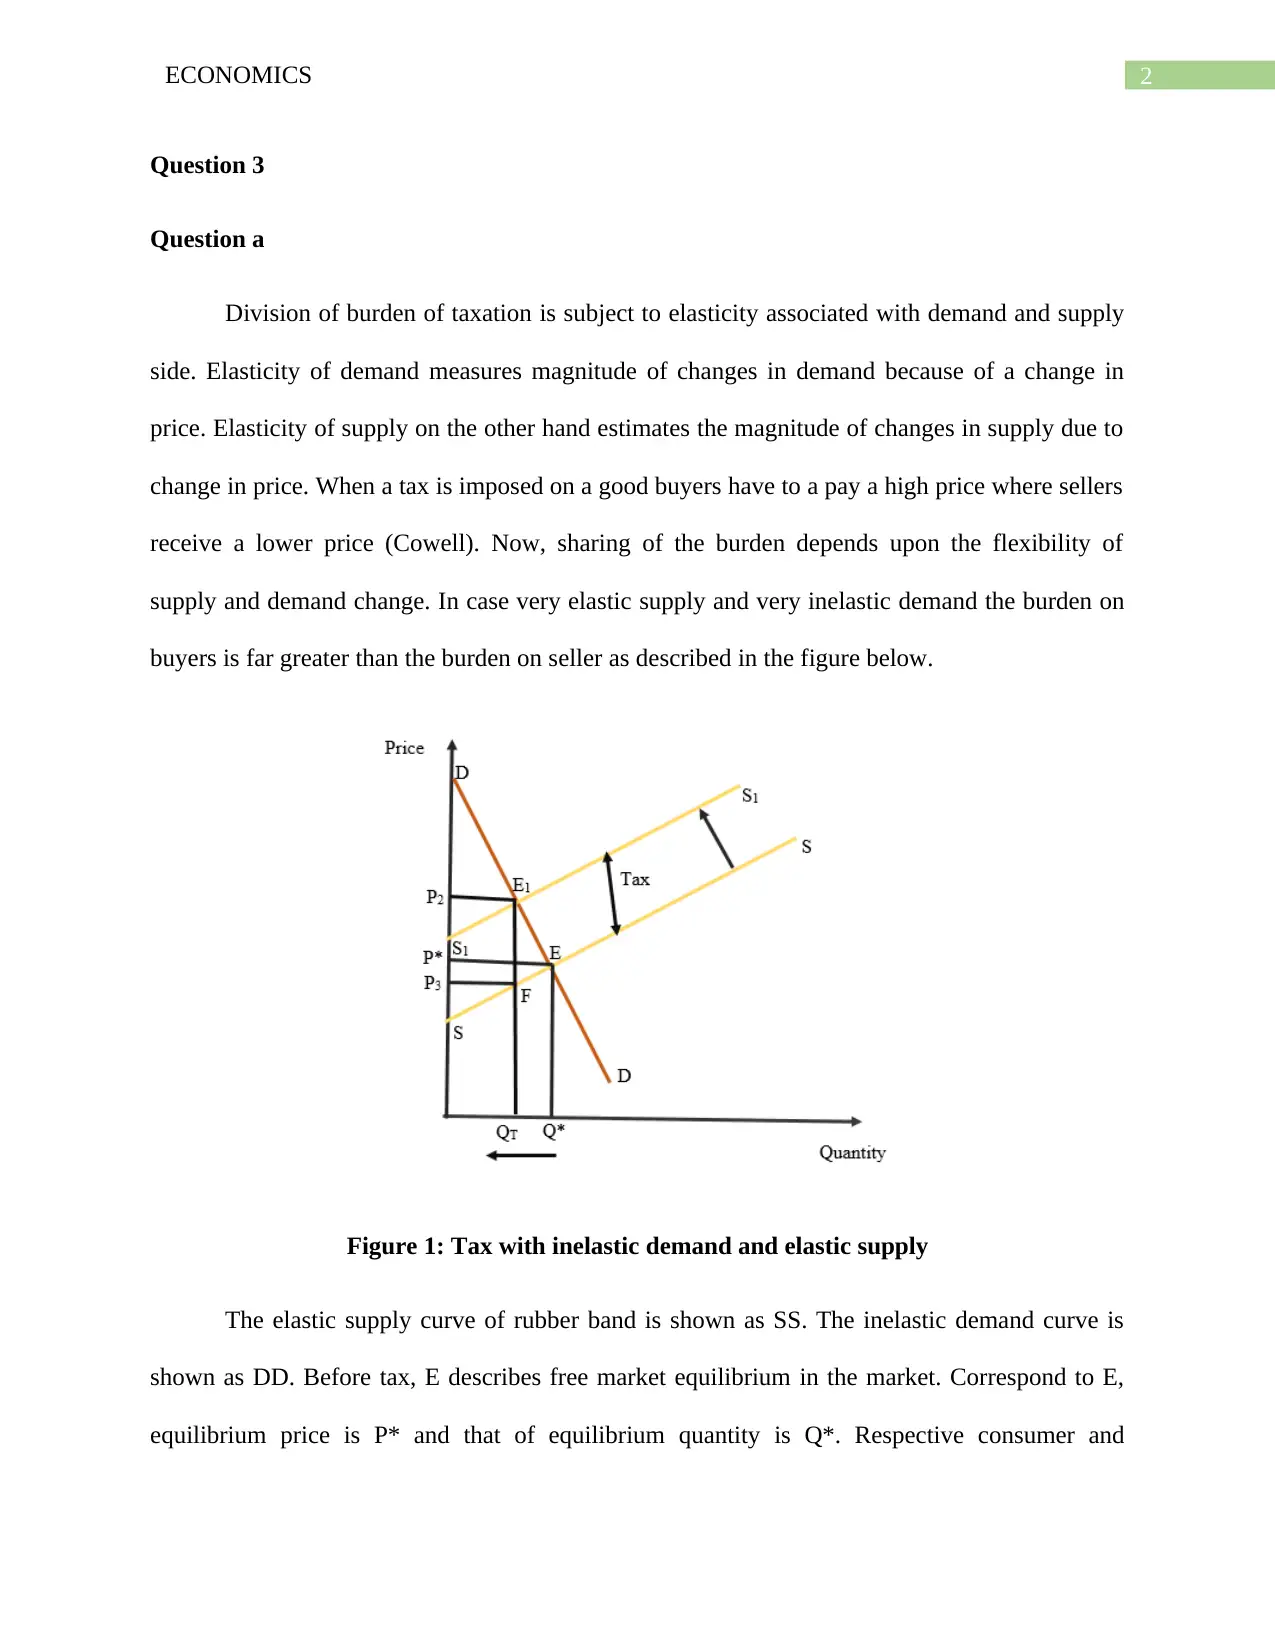
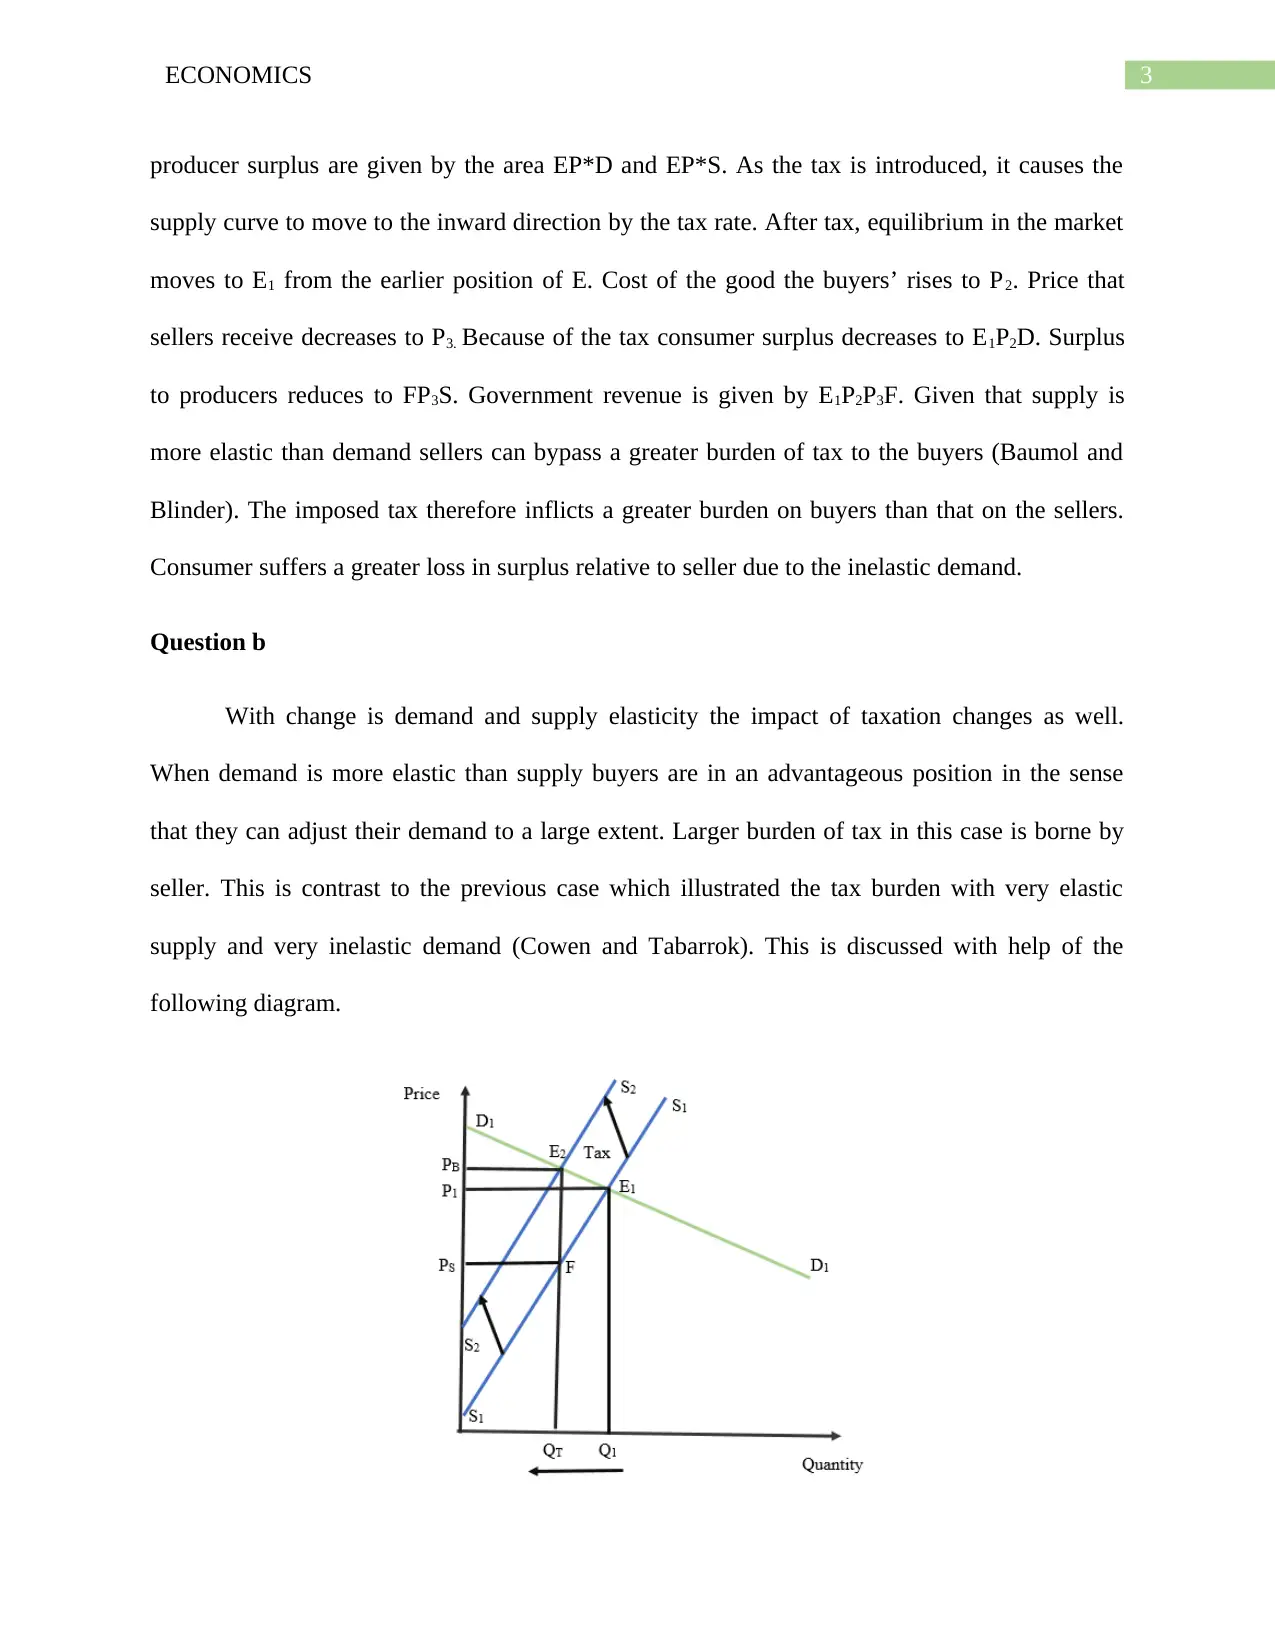
This economics assignment delves into the relationship between elasticity and tax burden, examining how the flexibility of supply and demand influences the distribution of tax costs between consumers and producers. The assignment analyzes two scenarios: one with inelastic demand and elastic supply, and another with elastic demand and inelastic supply. In the first scenario, the burden of the tax falls more heavily on buyers due to their limited ability to adjust demand. The second scenario reveals that sellers bear a greater share of the tax burden when demand is elastic. The assignment utilizes graphical representations to illustrate these concepts, including shifts in supply curves and changes in consumer and producer surplus, offering a comprehensive analysis of how market dynamics affect tax incidence, supported by references to established economic literature.
Document Page
Running head: ECONOMICS
Economics
Name of the Student
Name of the University
Course ID
tabler-icon-diamond-filled.svg

Paraphrase This Document

Need a fresh take? Get an instant paraphrase of this document with our AI Paraphraser
Document Page
1ECONOMICS
Table of Contents
Question 3........................................................................................................................................2
Question a....................................................................................................................................2
Question b....................................................................................................................................3
References........................................................................................................................................5
Document Page
2ECONOMICS
Question 3
Question a
Division of burden of taxation is subject to elasticity associated with demand and supply
side. Elasticity of demand measures magnitude of changes in demand because of a change in
price. Elasticity of supply on the other hand estimates the magnitude of changes in supply due to
change in price. When a tax is imposed on a good buyers have to a pay a high price where sellers
receive a lower price (Cowell). Now, sharing of the burden depends upon the flexibility of
supply and demand change. In case very elastic supply and very inelastic demand the burden on
buyers is far greater than the burden on seller as described in the figure below.
Figure 1: Tax with inelastic demand and elastic supply
The elastic supply curve of rubber band is shown as SS. The inelastic demand curve is
shown as DD. Before tax, E describes free market equilibrium in the market. Correspond to E,
equilibrium price is P* and that of equilibrium quantity is Q*. Respective consumer and
Document Page
3ECONOMICS
producer surplus are given by the area EP*D and EP*S. As the tax is introduced, it causes the
supply curve to move to the inward direction by the tax rate. After tax, equilibrium in the market
moves to E1 from the earlier position of E. Cost of the good the buyers’ rises to P2. Price that
sellers receive decreases to P3. Because of the tax consumer surplus decreases to E1P2D. Surplus
to producers reduces to FP3S. Government revenue is given by E1P2P3F. Given that supply is
more elastic than demand sellers can bypass a greater burden of tax to the buyers (Baumol and
Blinder). The imposed tax therefore inflicts a greater burden on buyers than that on the sellers.
Consumer suffers a greater loss in surplus relative to seller due to the inelastic demand.
Question b
With change is demand and supply elasticity the impact of taxation changes as well.
When demand is more elastic than supply buyers are in an advantageous position in the sense
that they can adjust their demand to a large extent. Larger burden of tax in this case is borne by
seller. This is contrast to the previous case which illustrated the tax burden with very elastic
supply and very inelastic demand (Cowen and Tabarrok). This is discussed with help of the
following diagram.
tabler-icon-diamond-filled.svg

Paraphrase This Document

Need a fresh take? Get an instant paraphrase of this document with our AI Paraphraser
Document Page
4ECONOMICS
Figure 2: Tax with elastic demand and inelastic supply
In the rubber band market, the steep line S1S1 represents inelastic supply. The flatter line
D1D1 shows the elastic demand curve. Market equilibrium in the market attains at E1 with
corresponding equilibrium price and quantity being P1 and Q1 respectively. As the tax is
introduced, it causes the supply curve to move to the inward direction by the tax rate. After tax
price to buyers is PB and after tax price to sellers is PS. Revenue to the government is the area
PSPBE2F. The larger proportion of revenue comes from sellers (Mochrie). That means the tax
imposes a larger burden on sellers compared to buyers. Loss to the consumer surplus in this case
is relatively less than the loss to sellers.
Document Page
5ECONOMICS
References
Baumol, William J., and Alan S. Blinder. Microeconomics: Principles and policy. Nelson
Education, 2015.
Cowell, Frank. Microeconomics: principles and analysis. Oxford University Press, 2018.
Cowen, Tyler, and Alex Tabarrok. Modern principles of microeconomics. Macmillan
International Higher Education, 2015.
Mochrie, Robert. Intermediate microeconomics. Macmillan International Higher Education,
2015.
chevron_up_icon
1 out of 6
circle_padding
hide_on_mobile
zoom_out_icon
[object Object]