BEA111 Principles of Economics 1: Analyzing Trade and Equilibrium
VerifiedAdded on 2023/06/12
|5
|945
|479
Quiz and Exam
AI Summary
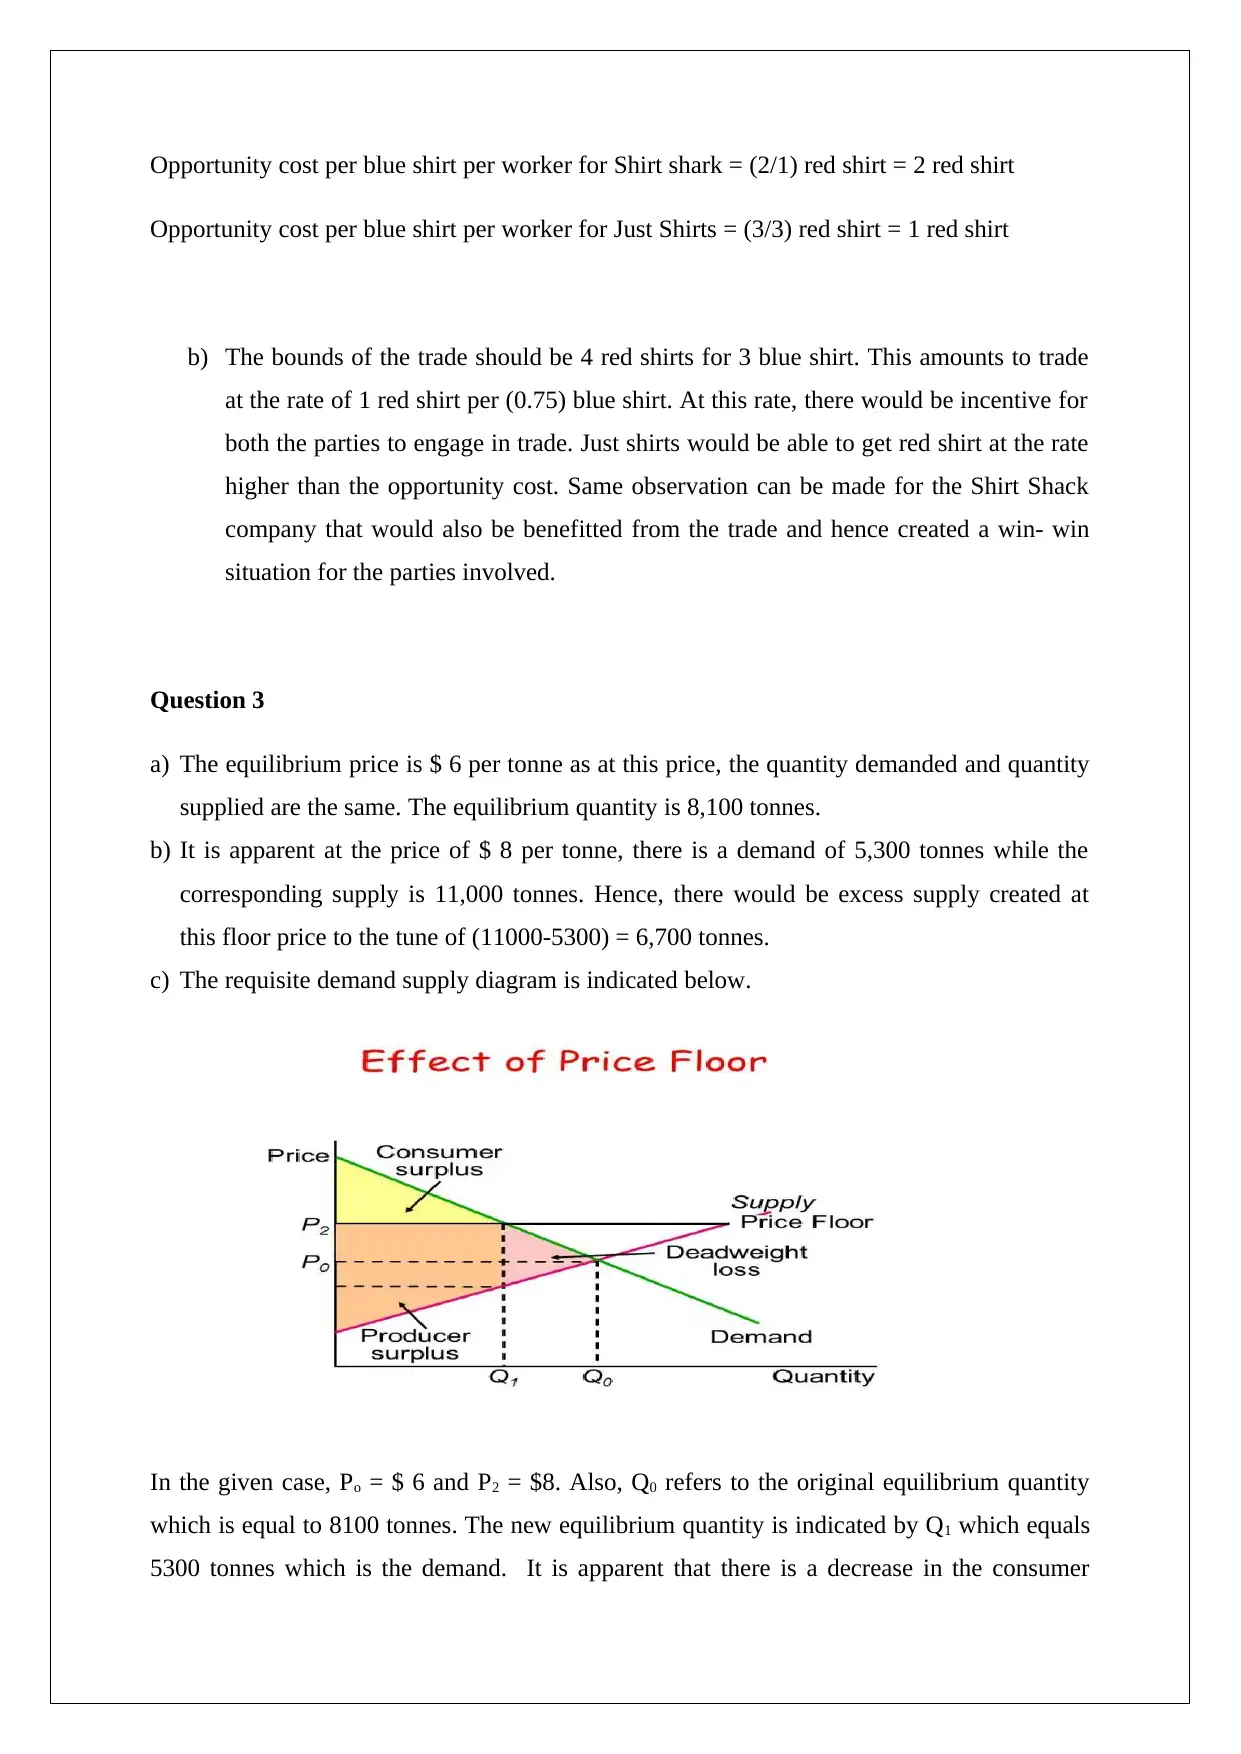
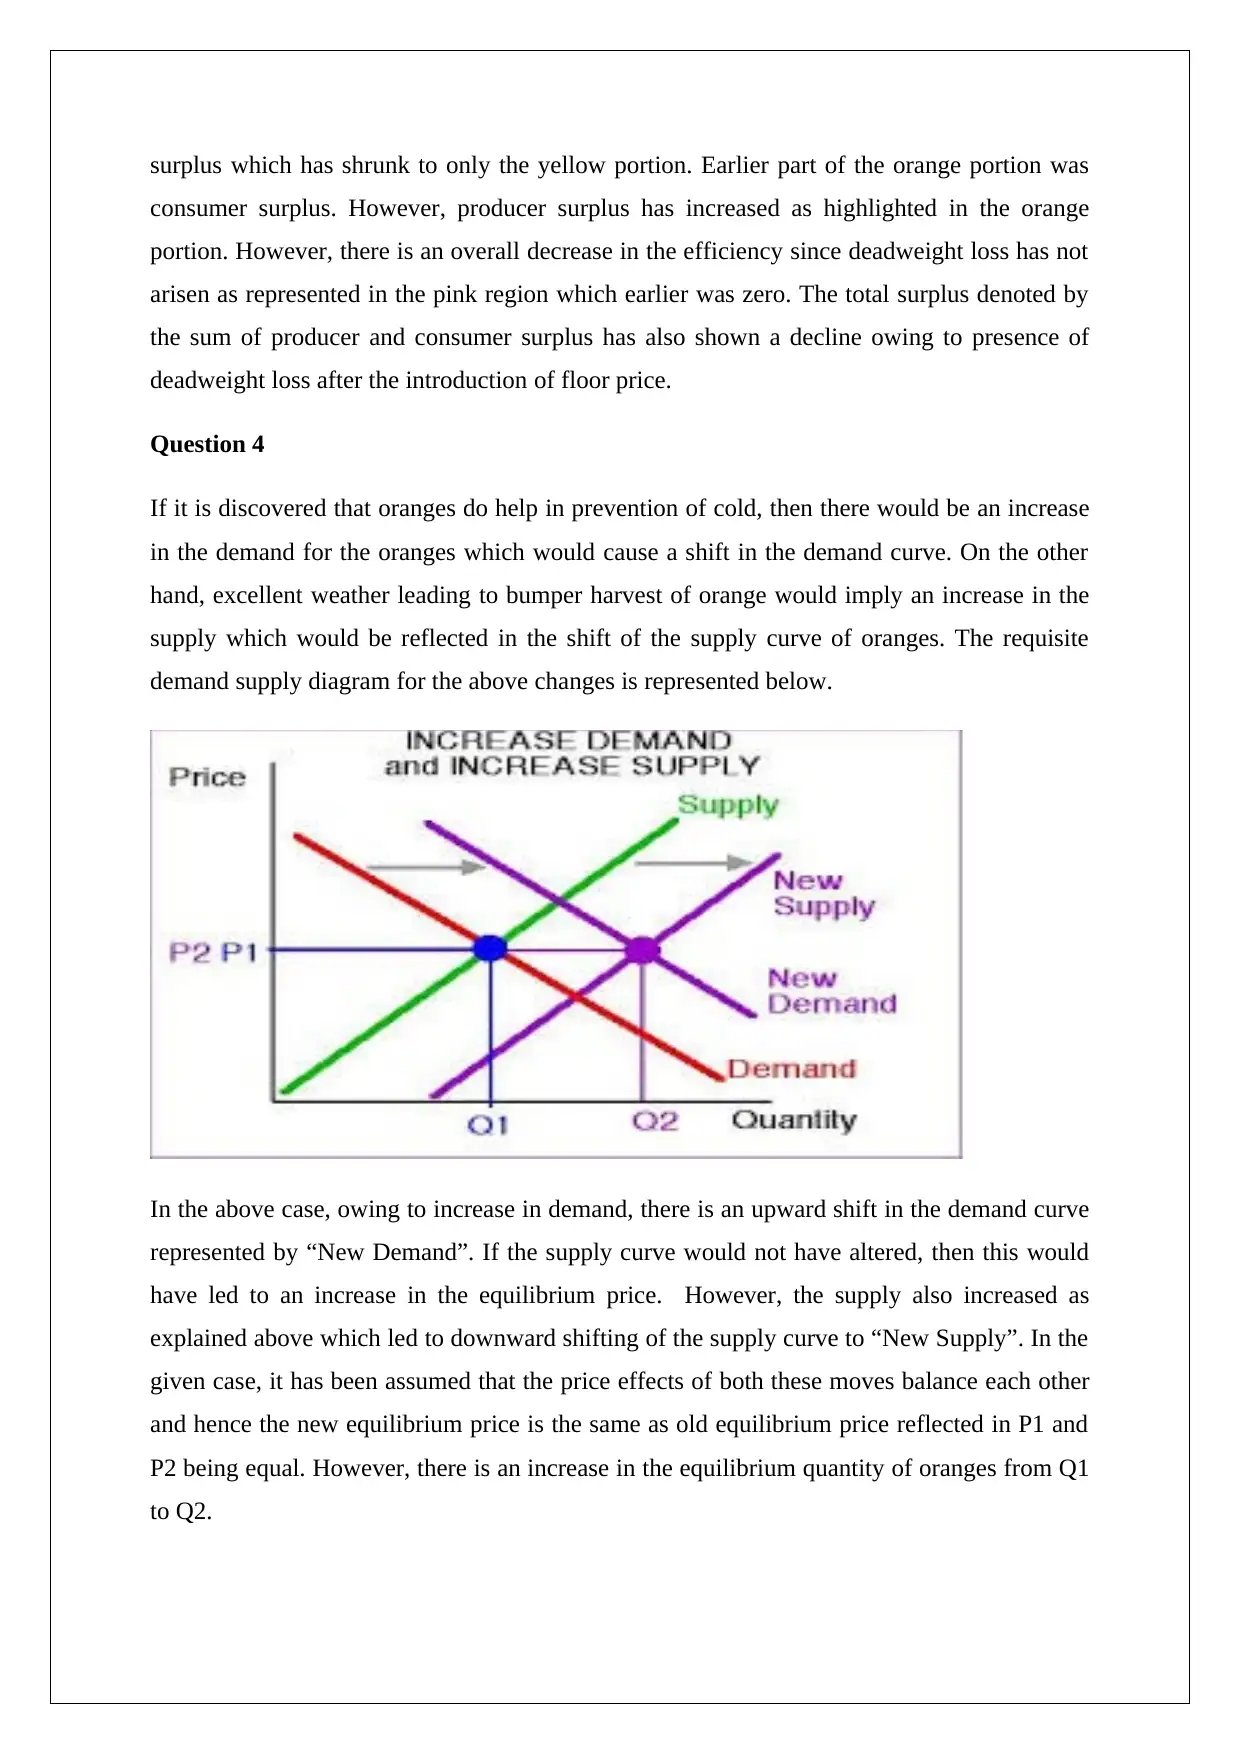
This document presents solutions to an economics quiz focusing on principles of economics. It covers concepts such as absolute and comparative advantage, analyzing trade scenarios between countries and businesses, and determining equilibrium prices and quantities in markets. The solutions include calculations of opportunity costs, analysis of the impact of price floors, and the effects of shifts in supply and demand curves due to external factors like new discoveries and weather conditions. Diagrams are used to illustrate changes in consumer and producer surplus, and the overall efficiency of the market. The analysis provides a comprehensive understanding of how these economic principles operate in real-world scenarios.

BUSINESS ECONOMICS
QUIZ
STUDENT ID
[Pick the date]
QUIZ
STUDENT ID
[Pick the date]
Paraphrase This Document
Need a fresh take? Get an instant paraphrase of this document with our AI Paraphraser

Question 1
a) No country has an absolute advantage in producing cars as the car producing capacity is
same for both the country. However, with regards to grain, it is apparent that by using the
same amount of resources, the output for a Australian worker is higher in comparison
with the Japanese worker. Hence, it would be apt to conclude that Australia has the
absolute advantage in producing grain.
b) The comparative advantage in producing grains lies with Australia since the opportunity
cost in terms of car production is lesser for Australia as compared to Japan. This can be
explained below.
Opportunity cost per tonne of grain by a worker in Japan = (4/5) = 0.8 cars
Opportunity cost per tonne of grain by a worker in Australia = (4/10) = 0.4 cars
The comparative advantage with regards to car production lies with Japan since the
opportunity cost in terms of grain production is lesser for Japan as compared to Australia.
This can be explained below.
Opportunity cost per car by a worker in Japan = (5/4) = 1.25 tonnes
Opportunity cost per car by a worker in Australia = (10/4) = 2.5 tonnes
Question 2
a) Shirt shack should produce the red shirt since it has a comparative advantage in the
production of the same as compared to Just Shirts. This can be highlighted by
computing the relevant opportunity cost.
Opportunity cost per red shirt per worker for Shirt shark = (1/2) blue shirt
Opportunity cost per red shirt per worker for Just Shirts = (3/3) blue shirt = 1 blue shirt
With regards to the blue shirt, Just shirts should produce the same as it has a comparative
advantage in the production of the same as compared to Shirt Shack . This can be highlighted
by computing the relevant opportunity cost.

Opportunity cost per blue shirt per worker for Shirt shark = (2/1) red shirt = 2 red shirt
Opportunity cost per blue shirt per worker for Just Shirts = (3/3) red shirt = 1 red shirt
b) The bounds of the trade should be 4 red shirts for 3 blue shirt. This amounts to trade
at the rate of 1 red shirt per (0.75) blue shirt. At this rate, there would be incentive for
both the parties to engage in trade. Just shirts would be able to get red shirt at the rate
higher than the opportunity cost. Same observation can be made for the Shirt Shack
company that would also be benefitted from the trade and hence created a win- win
situation for the parties involved.
Question 3
a) The equilibrium price is $ 6 per tonne as at this price, the quantity demanded and quantity
supplied are the same. The equilibrium quantity is 8,100 tonnes.
b) It is apparent at the price of $ 8 per tonne, there is a demand of 5,300 tonnes while the
corresponding supply is 11,000 tonnes. Hence, there would be excess supply created at
this floor price to the tune of (11000-5300) = 6,700 tonnes.
c) The requisite demand supply diagram is indicated below.
In the given case, Po = $ 6 and P2 = $8. Also, Q0 refers to the original equilibrium quantity
which is equal to 8100 tonnes. The new equilibrium quantity is indicated by Q1 which equals
5300 tonnes which is the demand. It is apparent that there is a decrease in the consumer
⊘ This is a preview!⊘
Do you want full access?
Subscribe today to unlock all pages.

Trusted by 1+ million students worldwide

surplus which has shrunk to only the yellow portion. Earlier part of the orange portion was
consumer surplus. However, producer surplus has increased as highlighted in the orange
portion. However, there is an overall decrease in the efficiency since deadweight loss has not
arisen as represented in the pink region which earlier was zero. The total surplus denoted by
the sum of producer and consumer surplus has also shown a decline owing to presence of
deadweight loss after the introduction of floor price.
Question 4
If it is discovered that oranges do help in prevention of cold, then there would be an increase
in the demand for the oranges which would cause a shift in the demand curve. On the other
hand, excellent weather leading to bumper harvest of orange would imply an increase in the
supply which would be reflected in the shift of the supply curve of oranges. The requisite
demand supply diagram for the above changes is represented below.
In the above case, owing to increase in demand, there is an upward shift in the demand curve
represented by “New Demand”. If the supply curve would not have altered, then this would
have led to an increase in the equilibrium price. However, the supply also increased as
explained above which led to downward shifting of the supply curve to “New Supply”. In the
given case, it has been assumed that the price effects of both these moves balance each other
and hence the new equilibrium price is the same as old equilibrium price reflected in P1 and
P2 being equal. However, there is an increase in the equilibrium quantity of oranges from Q1
to Q2.
Paraphrase This Document
Need a fresh take? Get an instant paraphrase of this document with our AI Paraphraser

1 out of 5
Related Documents

Your All-in-One AI-Powered Toolkit for Academic Success.
+13062052269
info@desklib.com
Available 24*7 on WhatsApp / Email
Unlock your academic potential
Copyright © 2020–2025 A2Z Services. All Rights Reserved. Developed and managed by ZUCOL.